HEC-RAS Model Output
HEC-FIA supports two types of inputs for computing flood damages: HDF files and gridded output. While cross-section-based results from older models are still compatible, it is strongly recommended to use HDF or gridded output formats, especially for modern AFDR analyses. This recommendation is based on several key advantages. Gridded output offers greater flexibility for future enhancements to HEC-RAS models and simplifies the process of running the "without-levee" computations in HEC-FIA. Furthermore, HEC-RAS models that include 2D flow areas can only generate gridded outputs, making this format essential for those scenarios.
HDF Files
Among the options, using HDF files is typically the most straightforward. This approach reduces both file size and processing time since you do not need to generate and store depth, arrival time, or duration grids unless they are specifically needed for other analyses. To use HDF files in HEC-FIA, you simply need to know the appropriate plan extensions - for example, .p01 for the regulated-with-levee condition and .p02 for the unregulated-with-levee condition. This tutorial provides a step-by-step guide on applying these HDF files in HEC-FIA.
Gridded Files
If you choose to use the gridded output method for AFDR calculations, you must generate the stored grids in HEC-RAS. Gridded output enables HEC-FIA to compute damages prevented for both structures and agricultural assets. For structure-only damage calculations, you need only the maximum extent depth grids and holdout results from HEC-ResSim. However, to calculate agricultural damages reduced, you must also produce arrival time and duration grids, in addition to depth grids.
The following table summarizes the required stored grids for each damage category.
| Damage Type | Required Grids |
|---|---|
Structure Only | Maximum Extents Depth Grid |
| Agriculture Only | Maximum Extents Depth Grid, Arrival Time, Duration |
| Structure and Agriculture | Maximum Extents Depth Grid, Arrival Time, Duration |
Analyzing the HEC-RAS Results
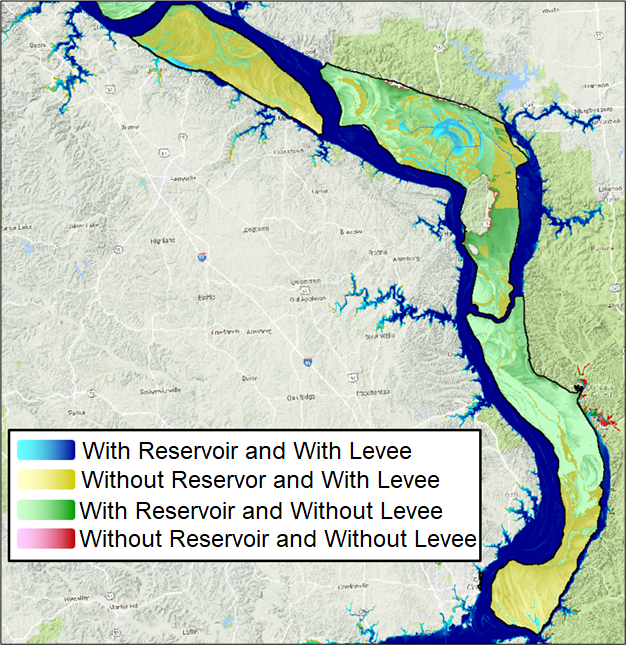
After running the necessary HEC-RAS plans, even if you do not generate stored maps, you can overlay the resulting inundation layers to gain insight into how damage will be allocated. The example figure below illustrates inundation results for a watershed with multiple levees, showing outputs from the four different HEC-RAS scenarios: regulated with levee, unregulated with levee, regulated without levee, and unregulated without levee.

By examining the layered inundation profiles, you can draw meaningful conclusions about Flood Damage Reduction allocation. For example, if the regulated (observed) scenario does not show inundation within a leveed area, it suggests that the levee played a significant role in reducing flood damages and that FDR should be largely attributed to it. This can be verified by comparing it to the unregulated without-levee scenario, which may reveal how much flooding would have occurred without either the reservoir or the levee.
On the other hand, if the unregulated with-levee scenario shows little to no inundation within the leveed area, this implies the levee could have contained the flood on its own, with minimal contribution from the upstream reservoir. In this case, the majority of FDR should be allocated to the levee rather than the reservoir. Conversely, if this same scenario shows significant inundation, it suggests that the reservoir did help reduce downstream flooding, and a greater share of the FDR should be assigned to it.

It is important to note that these interpretations are simplifications. Accurate FDR allocation depends on many factors, including the density, distribution, and value of structures and agricultural land within the affected area, as well as seasonal variations. More detailed guidance on making these allocations is provided in the HEC-FIA Model Setup documentation.
Ultimately, the goal of AFDR modeling is to quantify the economic benefits of USACE projects. The visual outputs from gridded HEC-RAS models not only support these calculations but also serve as powerful tools for communication. These visuals can be included in annual reports to Congress or shared with local stakeholders, especially communities located downstream of USACE flood risk reduction projects.
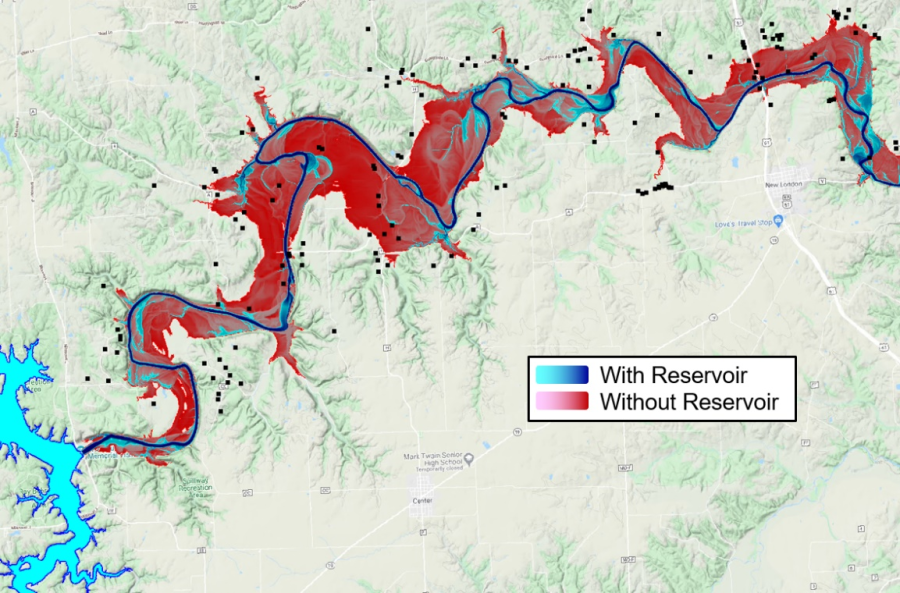
For example, a comparison of inundation depth grids for a headwater reservoir watershed clearly illustrates the reservoir's benefits. In the figure below, black dots represent structures from the inventory. The red area indicates flooding under the unregulated (without-reservoir) condition, while the blue area shows flooding under the regulated scenario. The stark reduction in flooded structures in the regulated case demonstrates the effectiveness of the reservoir in reducing downstream flood risk.