Adding Data to Time Series Icons
After creating a time series icon, the next step is to link it with relevant data. This allows the icon to serve as an access point for time series information within the HEC-RTS map windows.
This guide teaches you how to add and remove data to your time series icons using the Time Series Icon Editor dialog.
Accessing the Time Series Icon Editor Dialog
To access the dialog:
- Launch HEC-RTS and open your watershed.
- Go to the Setup tab.
- In the Map Window Toolbar, select the Time Series Icon Tool.
- Right-click a time series icon and choose Edit.

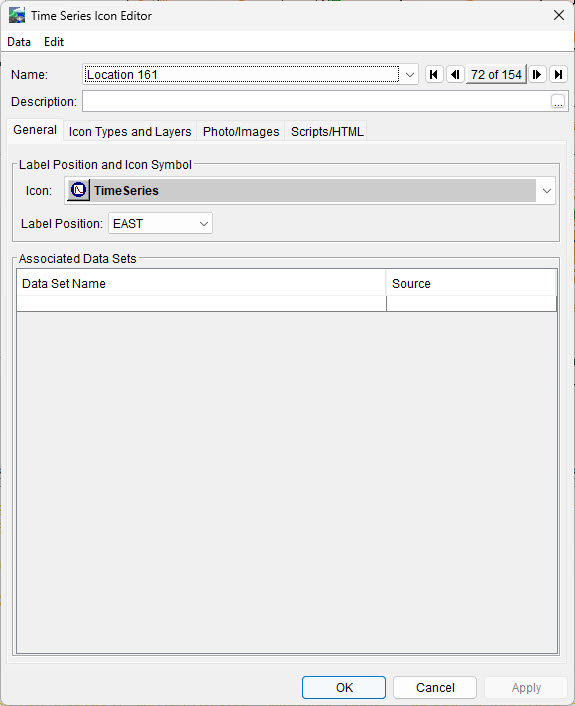
The Time Series Icon Editor dialog will open, displaying the details for the selected icon.
To view a different time series icon:
- Use the Name drop-down to select another icon, or
- Click the left or right arrow buttons to cycle through through the list of icons.
Adding Data from a Database or CDA
Before adding data from a database, ensure you are logged in. CDA connections also require prior server configuration.
To add data:
- In the Time Series Icon Editor, go to the Data menu.
- Choose one of the following:
- Browse CWMS-Vue to add data from a database.
- Browse CWMS Data API to add data from a CDA connection (select the appropriate connection from the list).
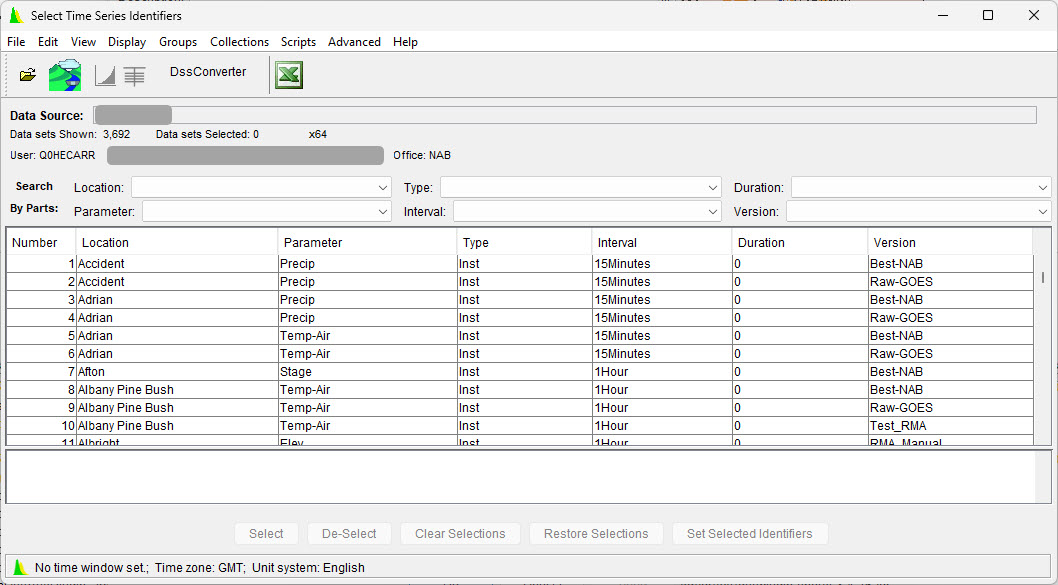
- The Select Time Series Identifiers dialog will open, displaying data from your source.

- Filter available data using the Search by Parts section (e.g., Location, Parameter, Type).
- Select the desired data rows and click Select.
- Your selections will appear in the list below.
- Once finished, click Set Selected Identifiers.
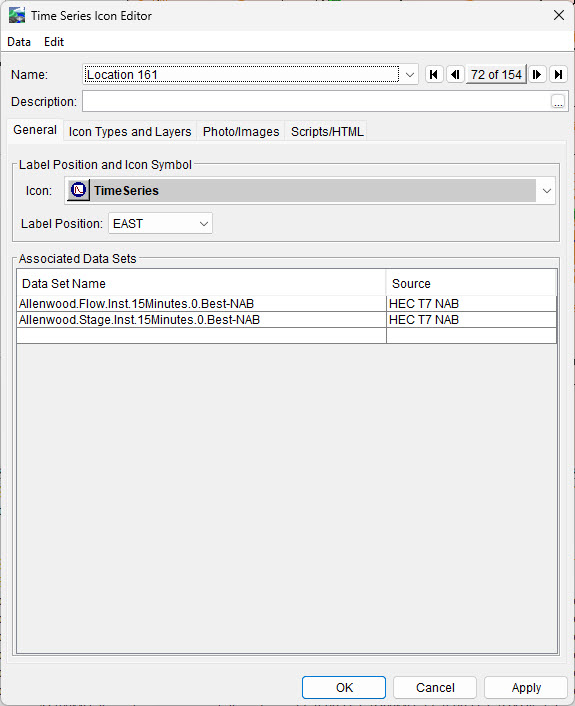
- Close the dialog. The selected pathnames will now appear in the Associated Data Sets table.

Adding Data from an HEC-DSS File
To use data from an HEC-DSS file:
- In the Time Series Icon Editor, open the Data menu and select Browse DSS.
- In the Select Pathnames dialog, choose Open from the File menu.
- Navigate to the appropriate HEC-DSS file and click Open.
- Select the desired data rows and click Select.
- Your selections will appear in the list below.
- Once finished, click Add Pathnames.
- Close the dialog. The selected pathnames will now appear in the Associated Data Sets table.
Using Data from forecast.dss
For icons used in the Modeling module, data from forecast.dss is commonly used. Note that references to forecast.dss are not supported in the Acquisition and Visualization modules.
When using modeling output, you may be prompted to apply % wildcards to F Parts. Click Yes to allow substitution with forecast keys, enabling the plotting of data from the active forecast.
Removing Data from a Time Series Icon
To remove associated data:
In the Time Series Icon Editor, select the rows to remove from the Associated Data Sets table.
From the Edit menu, choose Delete Rows.
The selected data will be removed from the icon.