Adding and Customizing Marker Lines
You can add marker lines on your plot's X and Y axes and customize the appearance of these markers. For example in the figure below a vertical line was inserted on 2 April 2006, 24:00.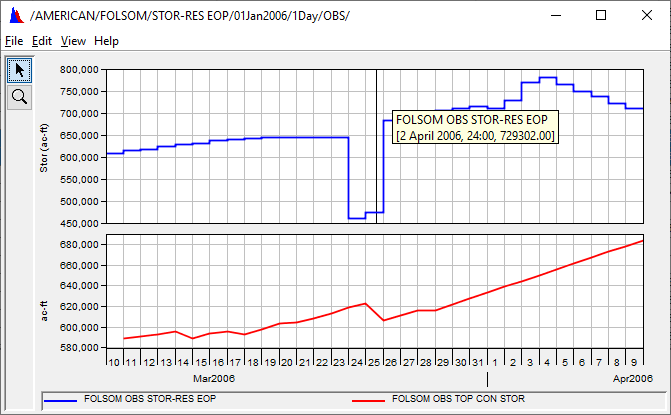
Adding Markers
To add a marker:
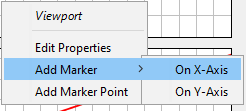
1.Right-click on the location in the plot where you want the marker to appear.
2.From the Viewport shortcut menu (below), point to Add Marker, and then click either On X-Axis or On Y-Axis.
The marker will now appear in the plot.
Deleting Markers
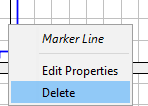
To delete a marker line in a plot, right click on the plot with the Pointer Tool, from the shortcut menu, click Delete.
Customizing Markers
To edit the properties of a marker in an individual plot: From the Edit menu, click Plot Properties. When the Plot Properties editor opens, click the Marker Lines tab. This worksheet is available only if a marker exists in the plot. Choose the marker you want to edit from the Marker Lines list.
Another way to edit a marker is with the Pointer Tool: right-click on the marker you want to edit. From the Marker Line shortcut menu, click Edit Properties.
To specify the default appearance of markers for all of your plots, from the Edit menu, click Default Plot Properties. Once the Default Plot Properties editor opens, choose the Marker Lines tab.
The interfaces for the specialized Edit Marker Line editor and the Default Plot Properties editor are very similar. However, the Plot Properties Editor dialog box differs in two ways. First, the Marker Lines worksheet is available only if a marker exists in the current plot. Second, at the top of the editing panel there is a Marker Lines list containing all markers that exist in the current plot.
You can edit the line style and label of a marker through this worksheet. The Edit Marker Line Properties editor is shown below The Marker Line tabs in the Plot Properties editor and the Default Plot Properties editor use similar worksheets as well. 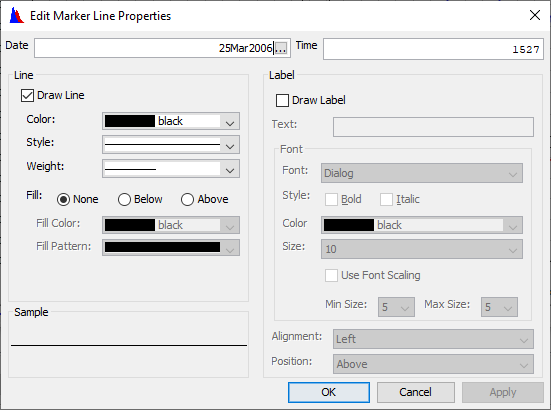
To edit the line style for markers: 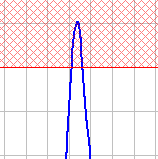
1. Select the Color, Style, and Weight for the marker line.
2. You can display marker lines with a Fill Above or Below the line. A plot with the Fill Above and a hatched Fill Pattern selected using a red Fill Color is shown above.
The Sample box, located in the lower left-hand corner of the worksheet, provides a preview of the new marker line.
Click Apply to save your changes without closing the editor.
To add a label to a marker line:
1. In the Label group, check the Draw Label checkbox and type the label name into the Text field.
2. In the Font section, select the labels Font, Style, Color, and Size.
3. Check Use Font Scaling if you would like to limit the size of the font when zooming in and out of the plot. Set the Min Size and Max Size limits.
4. From the Alignment list, select the justification of the label; Left, Center, or Right of the marker line.
5. Set the position of the label from the Position list, either Above, Center, or Below the marker line.
Set the position of the label from the Position list, either Above, Center, or Below the marker line.
1.If the marker line is on a date, the Date field will be displayed on the top of the worksheet.
2. To change the date, either enter the date in the format DDMMYYYY (e.g., 21Dec1993) or click the ellipse button to access the Calendar Tool
3. For the Time value, enter the time in 24-hour military format (e.g., for 5:08 pm, enter "1708").
4. If the marker line appears on a specific value, the Value field will display at the top of the worksheet instead of the Date field. To change this value, simply enter a new value in the field.
Editing Callouts
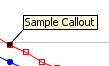
You can add descriptive callouts at specific points along a curve.
To add callouts:
1.Right-click on the location on the curve where you want the callout to appear.
2.From the shortcut menu, select Add Callout. 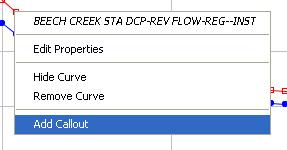
3. In the Add Callout dialog box , enter the text you want to appear in the callout, and then click OK. 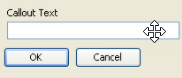
To hide all callouts on a curve, right-click on the curve in the plot, or in the legend, and select Hide Callouts from the shortcut menu.
Once you have hidden callouts, Hide Callouts in the shortcut menu changes to Show Callouts; allowing you to return callouts to the plot. To permanently remove all callouts from a curve, right-click on a curve in the plot, or in the legend, and click Clear Callouts from the shortcut menu.