Water Quality Plots
Water quality profile data, such as water temperature time series at different depths should be stored in DSS with the following convention for the B part of the Path:
<name>xnn,nnu
| B- Part Convention | Description |
|---|---|
| <name> | location name |
| x | D for depth, H for height or E for elevation |
| nn,nn | decimal numeric position with the comma representing the optional decimal point. |
| u | units of the numeric value |
| Examples | tokens |
|---|---|
Palm Springs-Soil Profile #2-D0,5m | <name>=Palm Springs-Soil Profile #2- x= D (depth) nn,nn = 0,5 (represents 0.5 ) u = m |
| E1843,26ft would be a sensor at elevation | <name>= blank x= E (elevation) nn,nn = 1843,26 (represents 1843.26) u = ft |
| H3ft | <name> = blank x= H (height) nn,nn = 3 u = ft |
| KinzuaD36ft | <name> = Kinzua x= D (depth) nn,nn = 36 u = ft |
The convention is also supported as part of the Sub-Location ID in CWMS database records, as described in Append B of CWMS Standard Naming Conventions.
To access the Water Quality Profile plots in HEC-DSSVue, first select Water Quality records in the record table, then select the Display -> Plot Water Quality Profile menu option, which is enabled when more than one Water Quality data set is selected as shown below.
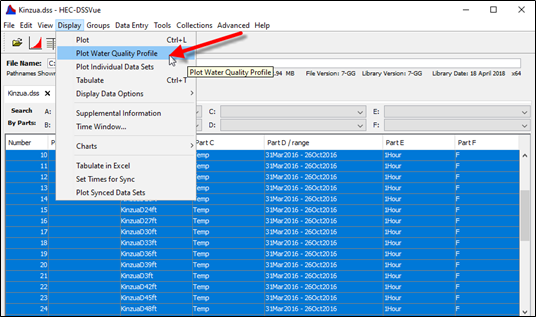
Note - If selected records contain some other types of records (non-water quality records) the profile plot will ignore them and only plot the WQ data.
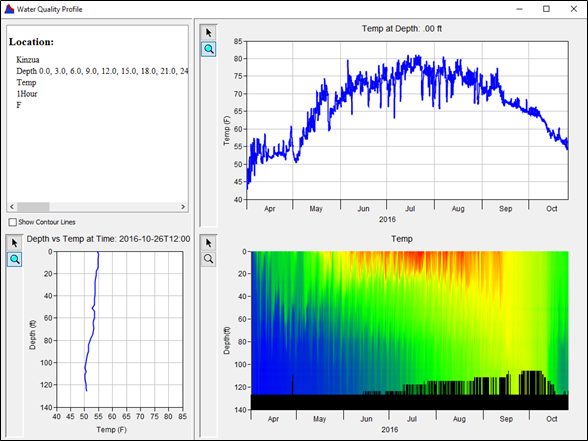
The Water Quality Profile plot contains four panels as shown below:
| Panel | Name | Description |
|---|---|---|
| Upper Left | B-Part | Summary of selected records: B-Part: Location Depth: lists all the depths derived from the B-Part C-Part: Parameter E-Part: Time Step F-Part: Parameter Units |
| Lower Left | Depth | Profile Plot that displays the paired data for the time step. By default this time step is the last time step record in the dataset. In the example above the last Depth vs Temp record is shown |
| Upper Right | Plot | The Time Series Plot is located in the upper-right hand panel and displays, by default, the first depth parameter time series. In the example above the default parameter time series is the water surface at depth 0. |
| Bottom Right | Profile | the Water Quality Profile Plot that displays the contour depth profile. |
The Time Series and Profile Plots’ data can be changed by clicking the mouse in the Water Quality Profile Plots viewport area. To change the Time Series and Profile Plots using the mouse pointer, first select the Pointer tool in the Water Quality Profile Plot Panel, as shown below:
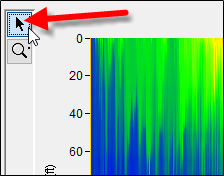
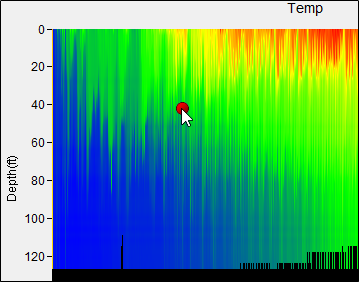
Once the pointer tool is selected, you can click anywhere on the Water Quality Profile Plot and the other two plots will update for the selected record. A red dot is added to the plot viewport at the clicked location (see below).
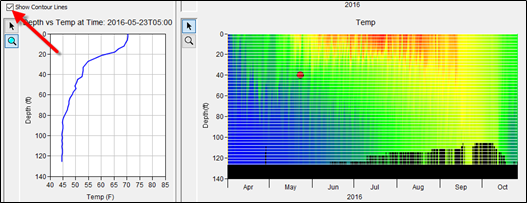
Horizontal contour lines for each record can be displayed in the Water Quality Profile Plot. To display the contour lines, click the Show Contour Lines checkbox to the left of the window, see below. The contour lines represent the height/depth of each record in the data set. The information displayed between these lines is interpolated.
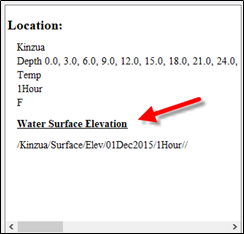
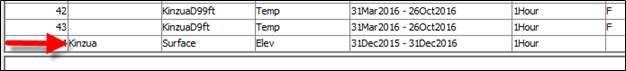
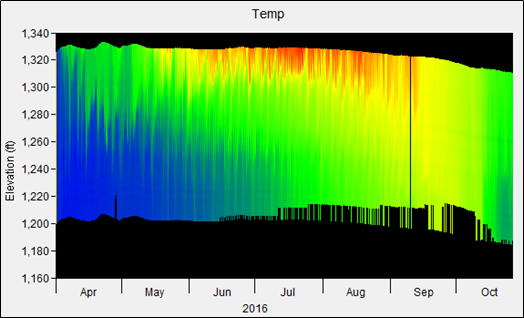
The Water Quality Profile Plot displays a depth profile by default. However, it can produce a water surface profile plot. To view the Water Quality Profile Plot using a water surface elevation, select the surface elevation record with the original data set before opening the Water Quality Plot (Kinzua in the example below).
The Water Quality Profile Plot will mathematically transform the plot using the water surface data as shown below:
The surface elevation information will also be added to the Selected Record Panel as shown below: