Download PDF
Download page Layer Settings.
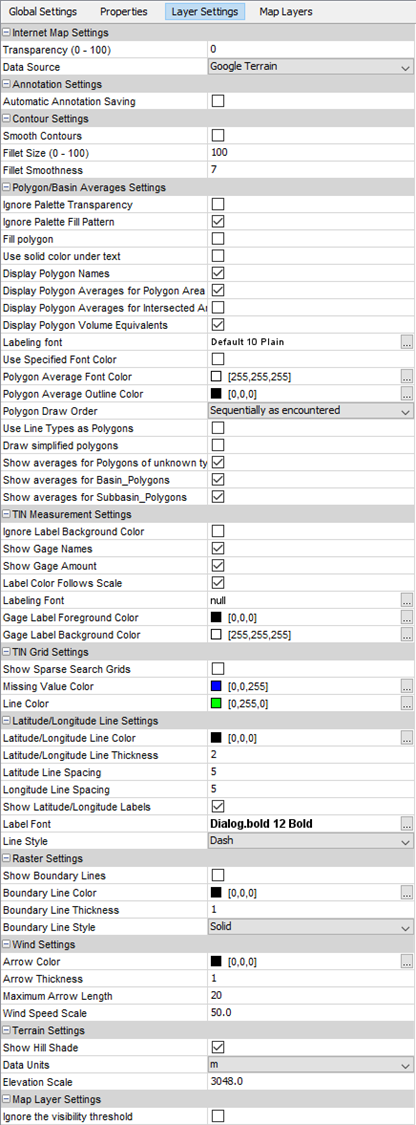
Layer Settings
This sets the layer options for the various layers in the Map Windows. These properties are inherited from the Project to the Session and to the Map Window. Once a property is changed for the Session or Map Window, the Session or Map Window maintains its own copy of all these properties from that point forward.
The table below provides definitions for the features available in the Layer Settings tab.
Group | Layer Setting | Definition |
Internet Map Settings |
| |
Transparency (0-100) | Used to set the transparency level of the selected Internet Map in the event that this layer is not the first layer drawn. | |
Data Source | This sets the data source to use for the Internet Map. | |
| Annotation Settings | ||
Automatic Annotation Saving | When checked, this will assure annotations are automatically saved as the edits are occurring. When not checked, saving annotation edits requires right-clicking on the correct file in the active annotations node via the Project Explorer Window and selecting 'Save File' from the context menu for the node. | |
Contour Settings | ||
Smooth Contours | Sets whether the contours should be smoothed or not. Smoothed contours look nicer but draw much slower. | |
Fillet Size (0-100) | Sets the size of the fillet (round or arc) to smooth the contour with. For the best look, set to 100. | |
Fillet Smoothness | The number of points to draw a fillet with. Using more points will result in smoother fillet appearance and increased draw times. | |
| Polygon/Basin Averages Settings | ||
Ignore Palette Transparency | If enabled, the basin averages use the palette color but draw them opaque (without transparency). | |
Ignore Palette Fill Pattern | If enabled, the basin averages ignore any palette fill patterns and just use the shade color. | |
Fill Polygon | If enabled, the polygons are filled with the color and patterns associated with the basin average value. | |
Use solid color under text | If enabled, the palette color will be opaque under the text. | |
Display Polygon Names | If enabled, the name of the polygon is displayed in the center of the polygon. The name is from the shapefile .dbf file LOCATION column. | |
Display Polygon Averages for Polygon Area | If enabled, the polygon average for the entire polygon area is displayed in the appropriate units in the center of the polygon. | |
Display Polygon Averages for Intersected Area | If enabled, the polygon average for the TIN and polygon intersected area is displayed in the appropriate units in the center of the polygon. | |
Display Polygon Volume Equivalents | If enabled, the volume equivalents are computed for the basin. This is only done if the program can convert the measurements units and average to a known resultant unit type. | |
Labeling font | Shows the current font in use. Button instantiates a standard font selection dialog. | |
Use Specified Font Color | Select this to override using the palette to set the font colors for the labels. Normally the labeling font color is computed from the Color Scale in use. | |
Polygon Average Font Color | This is the color to use for the labeling font. | |
Polygon Average Outline Color | This is the color to use for the polygon outlines. | |
Polygon Draw Order | This can be set to either 'Sequentially as Encountered' or 'By Defined Attribute Type'. | |
Use Line Types as Polygons | If enabled, this option allows the use of shapefile line types as polygon type in area based computations. Normally this option is not enabled because the shapefile has the necessary objects identified as polygons. | |
Draw simplified polygons | If enabled, polygon average layer will draw the simplified polygons (used in computations), based on the simplification thresholds in the global settings. | |
Show Averages for unknown type | There will be on one of these for each polygon attribute type defined in the schema being used plus one named 'Polygons' for unknown type polygons. If the option to Use Line Types as Polygons is selected, the enumeration will also include all the line types for the schema. | |
Show averages for Basin_Polygons | Displays averages for polygons of "Basin_Polygons" type. | |
Show averages for Subbasins_Polygons | Displays averages for polygons of "Subbasin_Polygons" type. | |
Tin Measurement Settings | ||
Ignore Background Label Color | When checked, the label background color is not used. When un-checked the label background color is used. When many labels are present and overlap, leaving this unchecked will assure that the topmost TIN measurement settings can be read at the expense of obscuring earlier rendered data in the Map Window. | |
Show Gage Names | Check this to show the names of the gages at their locations. | |
Show Gage Amount | Check this to show the gage measurements. | |
Label Color Follows Scale | If this is checked, the color of the label text matches the corresponding color from the specified Color Scale palette to the measurement value. If unchecked, the label is colored using the applicable background and foreground colors. | |
Labeling Font | The font to use to label TIN points. | |
Gage Label Foreground Color | The text color to use when not basing the colors on the measurement value. | |
Gage Label Background Color | The text background color to use when not basing the colors on the measurement value and the 'Ignore background label color' is not checked. This options draws a small color filled box under the text label, which improves readability but may obscure earlier rendered layers in the Map Window. | |
| Tin Grid Settings | ||
Show Sparse Search Grids | Primarily used for debugging, this option shows the layered sparse search TINs which are used to improve program performance. In order to show the Sparce Grids, this option must be enable in addition to enabling the "Show TIN Grid/Mesh" in the Map Layers tab. There are no options for setting the color attributes of the sparse search grids. | |
Missing Value Color | The color to use for TIN grids triangles that are undefined or out of bounds. | |
Line Color | The color to use for TIN grid triangles that have valid measurement data defined. | |
| Latitude/Longitude Line Settings | ||
| Latitude/Longitude Line Color | The color to use for latitude and longitude lines. | |
| Latitude/Longitude Line Thickness | The thickness of the latitude and longitude lines. | |
| Latitude Line Spacing | Specifies the spacing of latitude lines (in degrees). | |
| Longitude Line Spacing | Specifies the spacing of longitude lines (in degrees). | |
| Show Latitude/Longitude Labels | If selected, markers labeling the latitude/longitude degree will show at the edge of the screen for each latitude/longitude line. | |
| Label Font | Specifies the font of latitude/longitude labels. | |
| Line Style | Specifies the line style for latitude/longitude lines. | |
| Raster Settings | ||
| Show Boundary Lines | If enabled, the boundary around each raster cell will be shown. | |
| Boundary Line Color | Specifies the color of the boundary lines of raster cells. | |
Boundary Line Thickness | Specifies the line thickness of the boundary lines of raster cells. | |
| Boundary Line Style | Specifies the line style of boundary lines of raster cells. | |
| Wind Settings | ||
Arrow Color | Specifies the color of the arrow vectors for the wind layer. | |
| Arrow Thickness | Specifies the thickness of the arrow vectors for the wind layer. | |
| Max Arrow Length | Specifies the max arrow length (in screen pixels) to be drawn. This will determine how large to draw arrows representing the highest wind speeds (based on the wind speed scale). | |
| Wind Speed Scale | Specifies the maximum wind speed value (consistent with the display units) for the Wind Speed Scale, which represents the length of the displayed wind speed vectors. Wind speeds greater than or equal to this specified maximum value will be displayed as the maximum vector length. | |
| Terrain Settings | ||
| Show Hill Shade | If enabled, this will draw the hill shade layer over the raster to provide shaded relief. | |
| Data Units | Specifies the elevation units for the data. | |
| Elevation Scale | Specifies the maximum value of the elevation scale (scale is linear and starts at zero) to use for rendering the elevation. | |
| Map Layer settings | ||
Ignore the Visibility Threshold | Some map attributes have visibility thresholds defined which limit the amount of data displayed at various zoom levels within the program. For example, if viewing a map showing the continental U.S., an active map that shows city streets would likely create map clutter and convey very little. When zooming in, perhaps to the city limits, the city streets become visible. Selecting this option disables the threshold parameters and draws everything within the view. |