Download PDF
Download page Stage and Flow Hydrographs.
Stage and Flow Hydrographs
For HEC-RAS version 6.7, the Stage and Flow Hydrograph plots has been greatly improved to provide more options to the user all in one "plot" location.
If the user has performed an unsteady flow analysis, the stage and flow hydrographs will be available for viewing. To view a stage and/or flow hydrograph, select the Stage and Flow Hydrographs option from the View menu of the main HEC-RAS window or the ![]() button. The plot window shown below will become available.
button. The plot window shown below will become available.
Each plot has a backing table. The table can be accessed (and hidden) by clicking on the Table ![]() button. The plot can be hidden (and viewed) by clicking on the Plot
button. The plot can be hidden (and viewed) by clicking on the Plot ![]() button.
button.
The plot window has has many options dependent on the Node Type selected. The Node Type references the computational element used in HEC-RAS and includes Rivers, Cross Sections, Bridges/Culverts, Inline Structures, Lateral Structures, Storage Areas, SA/2D Connections, Pump Stations, Reference Points, Reference Lines, Reference Areas, Boundary Condition Lines, Calibration Regions, 2D Flow Areas, 2D Cells, 2D Faces, 2D Facepoints, Pipe Nodes, and Pipe Conduits. The Node Type list will only show the user what nodes are in the current model. The selection of the Node Type will populate a table in the left portion of the window and as a row is selected, the Plot will update to reflect the selection.
The Plot is interactive.
- Pan - left-click in the window to pan.
- Zoom - there are several ways to zoom as described below
- mouse wheel so zoom in/out at the cursor
- right-click on the plot to choose a zoom option
- draw an box outside of either axis to zoom only on that axis
- press the Esc key to zoom full
- Select - select a line in the legend to highlight the line magenta
- Bobber - interactive bobbers will display data values as you hover the plot
Additional output for the hydrograph plot includes statistics about the hydrographs (peak stage and flow, time of peak, and volume).
Plot Types
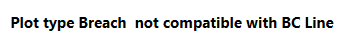
Depending on the selected Node Type, Plot Types will be available. Plot Types include Time Series (which includes Rating Curves and Internal Boundary Curves for bridges), Profiles, Property Tables, and Breach information. Selecting a Plot Type will change the plot. If a new Node Type is selected and the Plot Type is not supported the plot window will provide a message as shown shown below.
Time Series
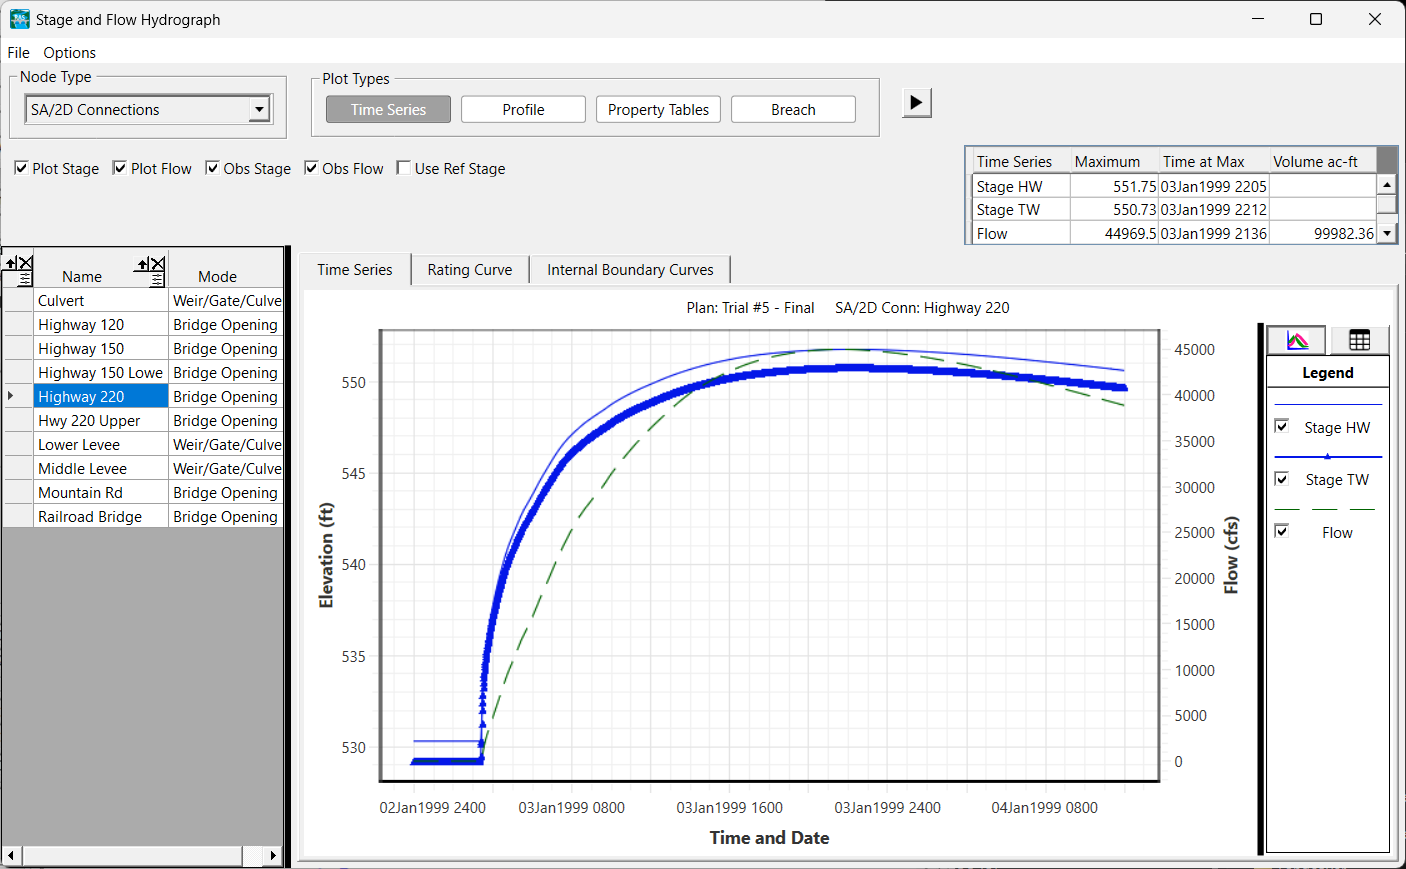
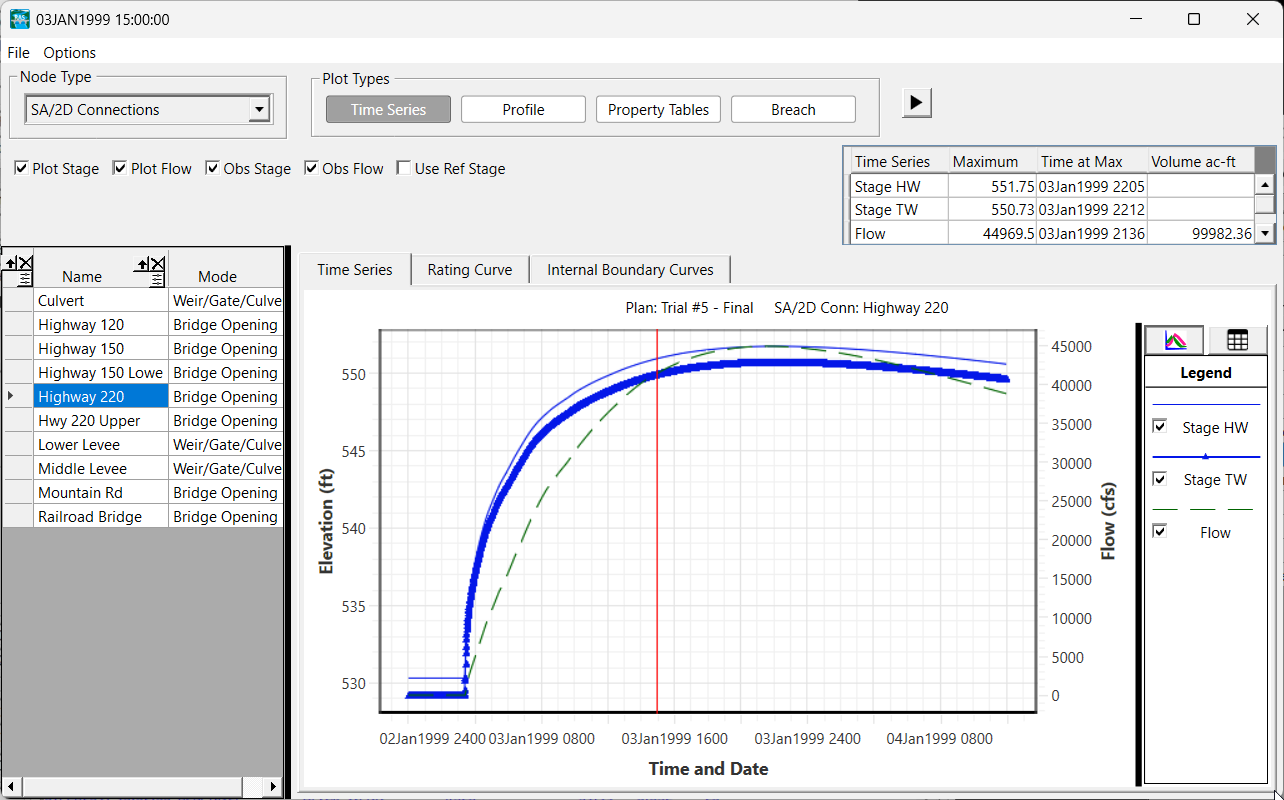
The Time Series plot shows the stage and flow for a given time for the selected node. If observed data are available for the node, they will be plotted. The animation control will sync the water surface in other plots with a red line showing the time.
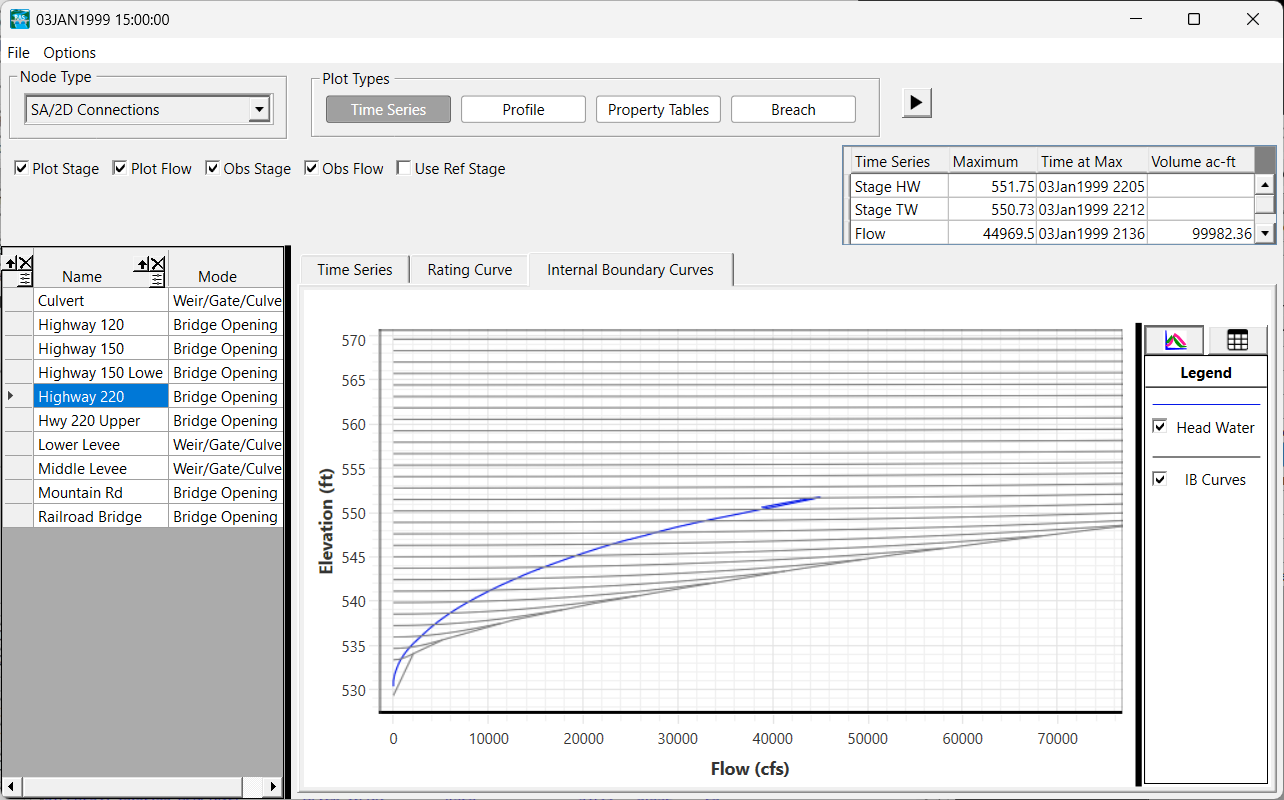
The Time Series plot type will also avail the user to plots for a Rating Curve (Cross Sections or Bridges) or Internal Boundary Curves (Bridges) and show the solution to the simulation (blue line).
Rating Curve

Internal Boundary Curves
Profile
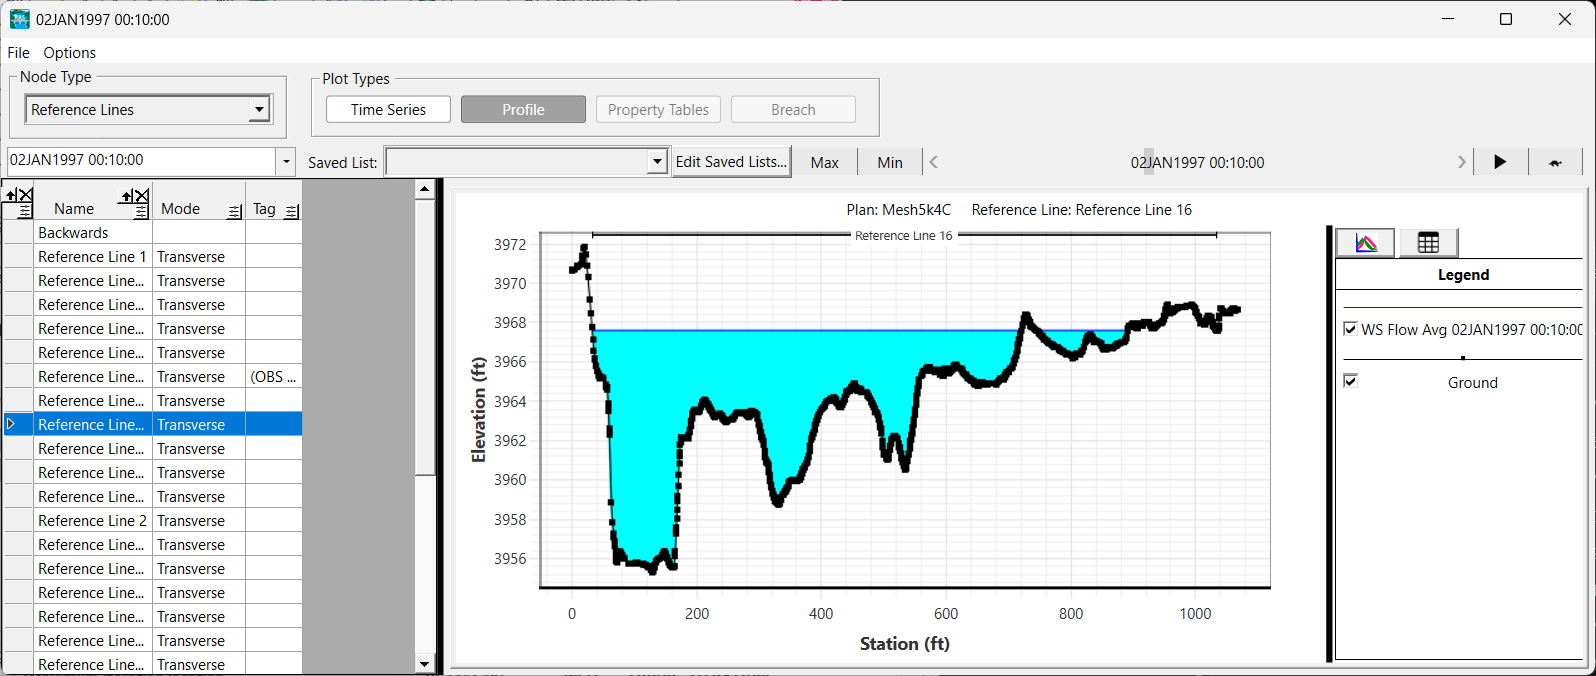
The profile plot will show the ground line for reference with the water surface profile. If observed data area available, they will be plotted. This plot is useful for plotting showing the computed water surface elevation along a River Reach, at a Cross Section, at a Bridge, or at a Reference Line location.
An example profile plot for a transverse Reference Lines is shown below.
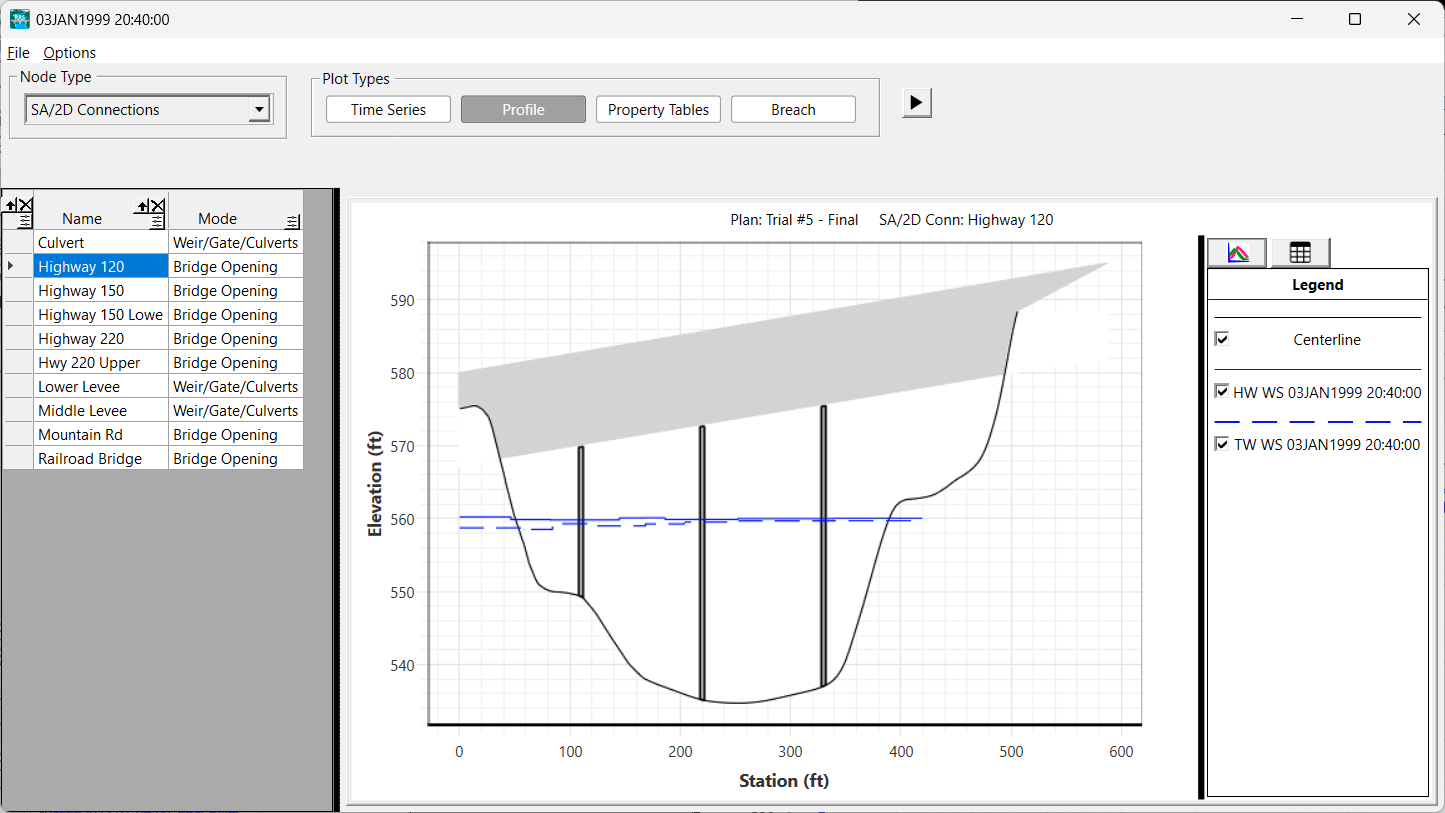
An example profile plot for a hydraulic structure is shown below.
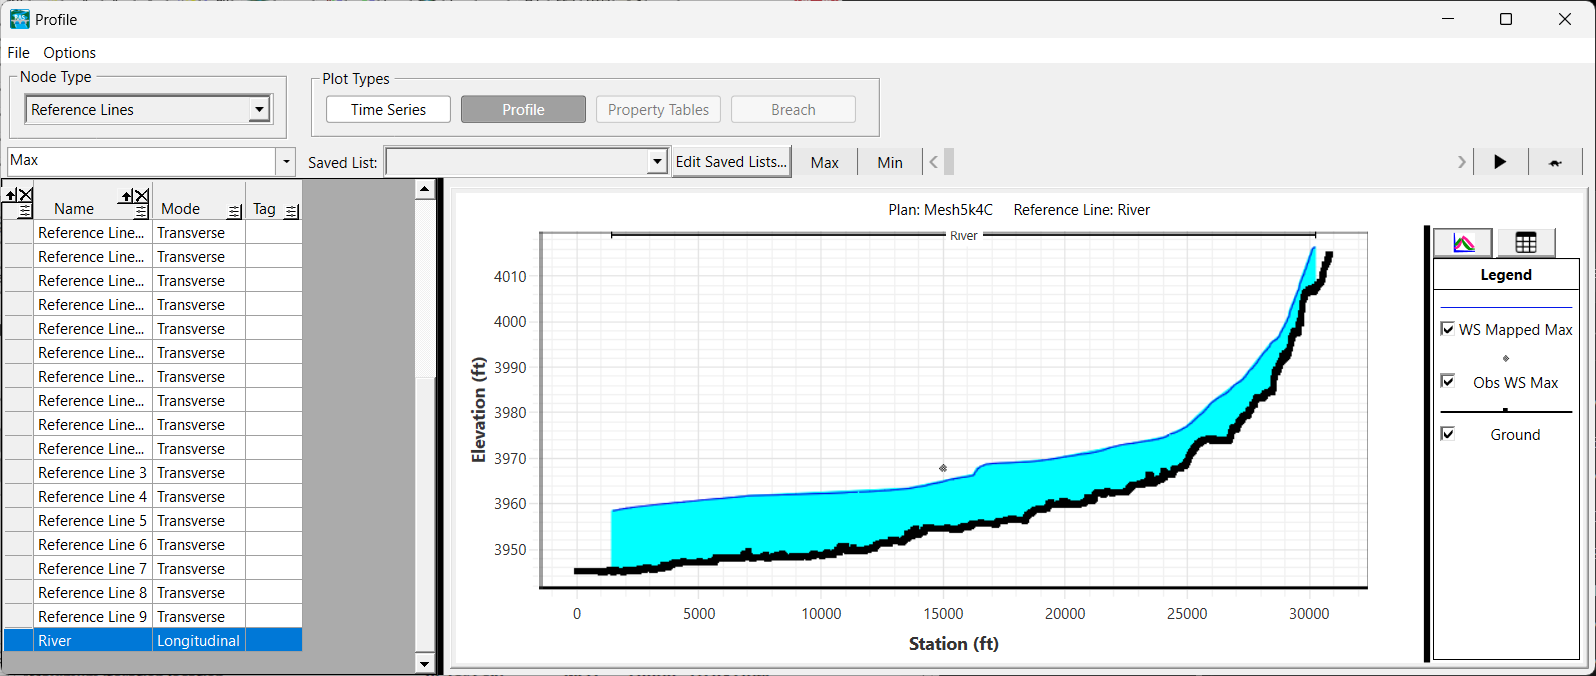
An example profile plot for a longitudinal Reference Line is shown below.
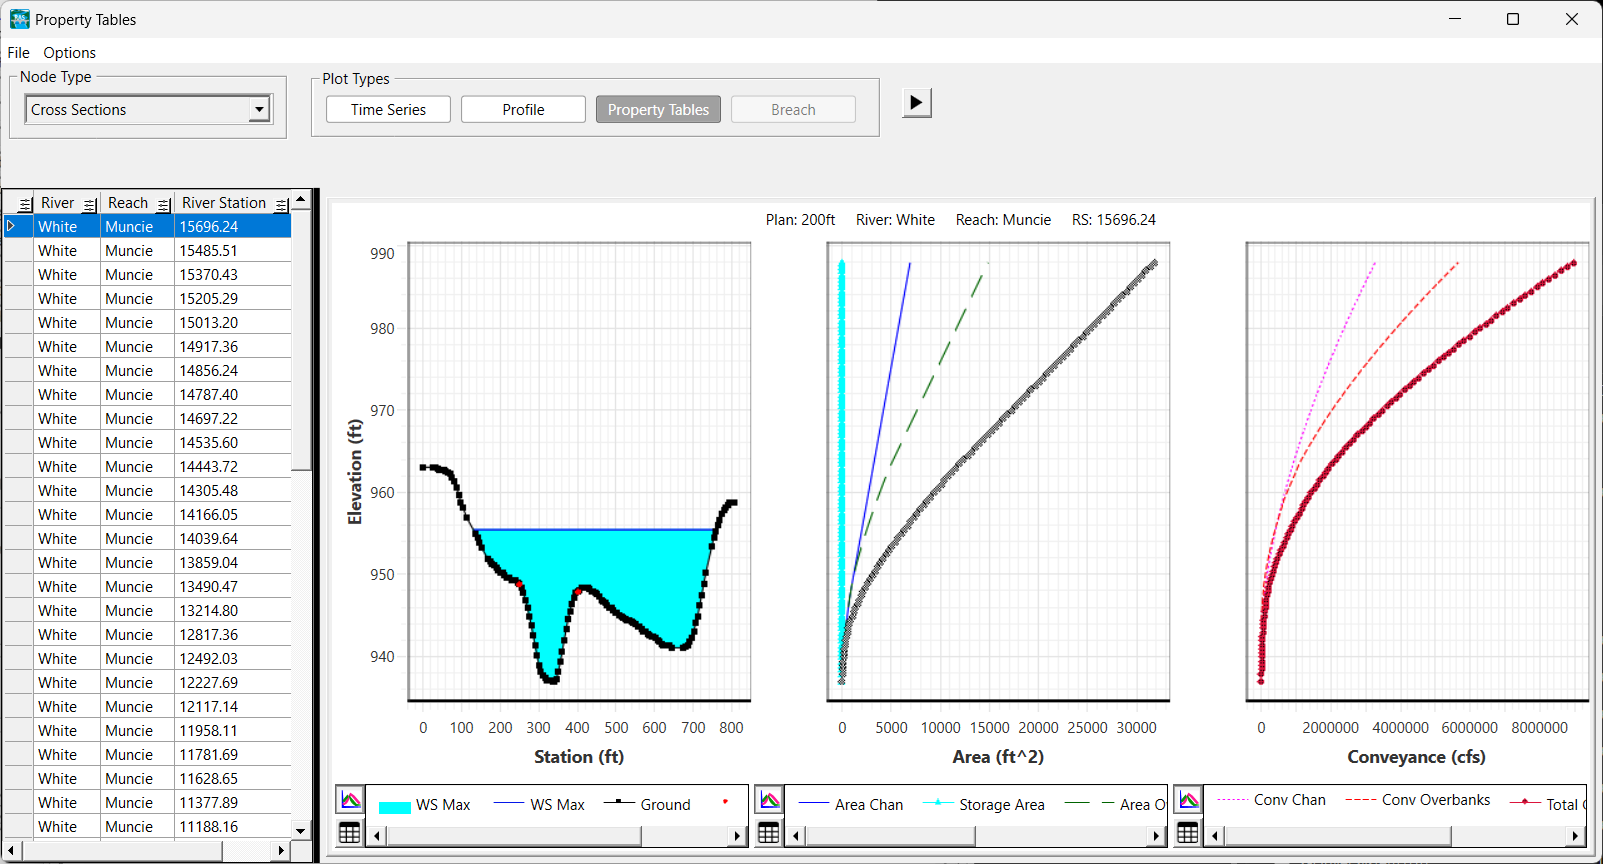
Property Tables
Property Tables show the relationship between water surface elevation and a hydraulic property such as conveyance or area. An example Property Table plot for a cross section is shown below.
For a bridge, the Property Table shows both the Profile and the family of rating curves, as shown below.

An example Property Table for 2D Faces is show below.
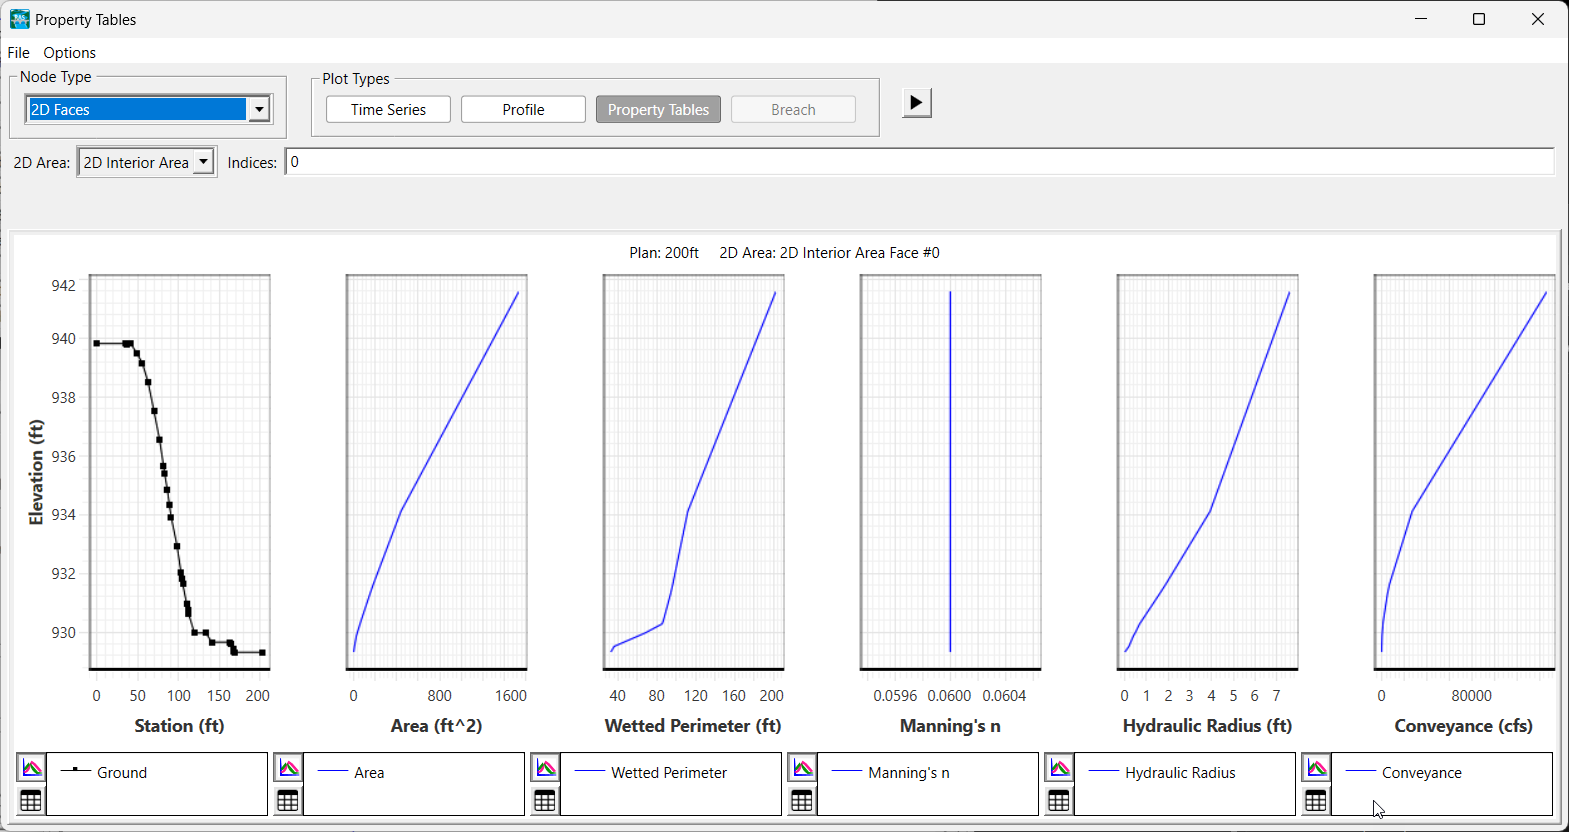
To change a 2D cells, faces, or facepoints, enter the index number. Multiple indices can be entered separated by a comma or a space.
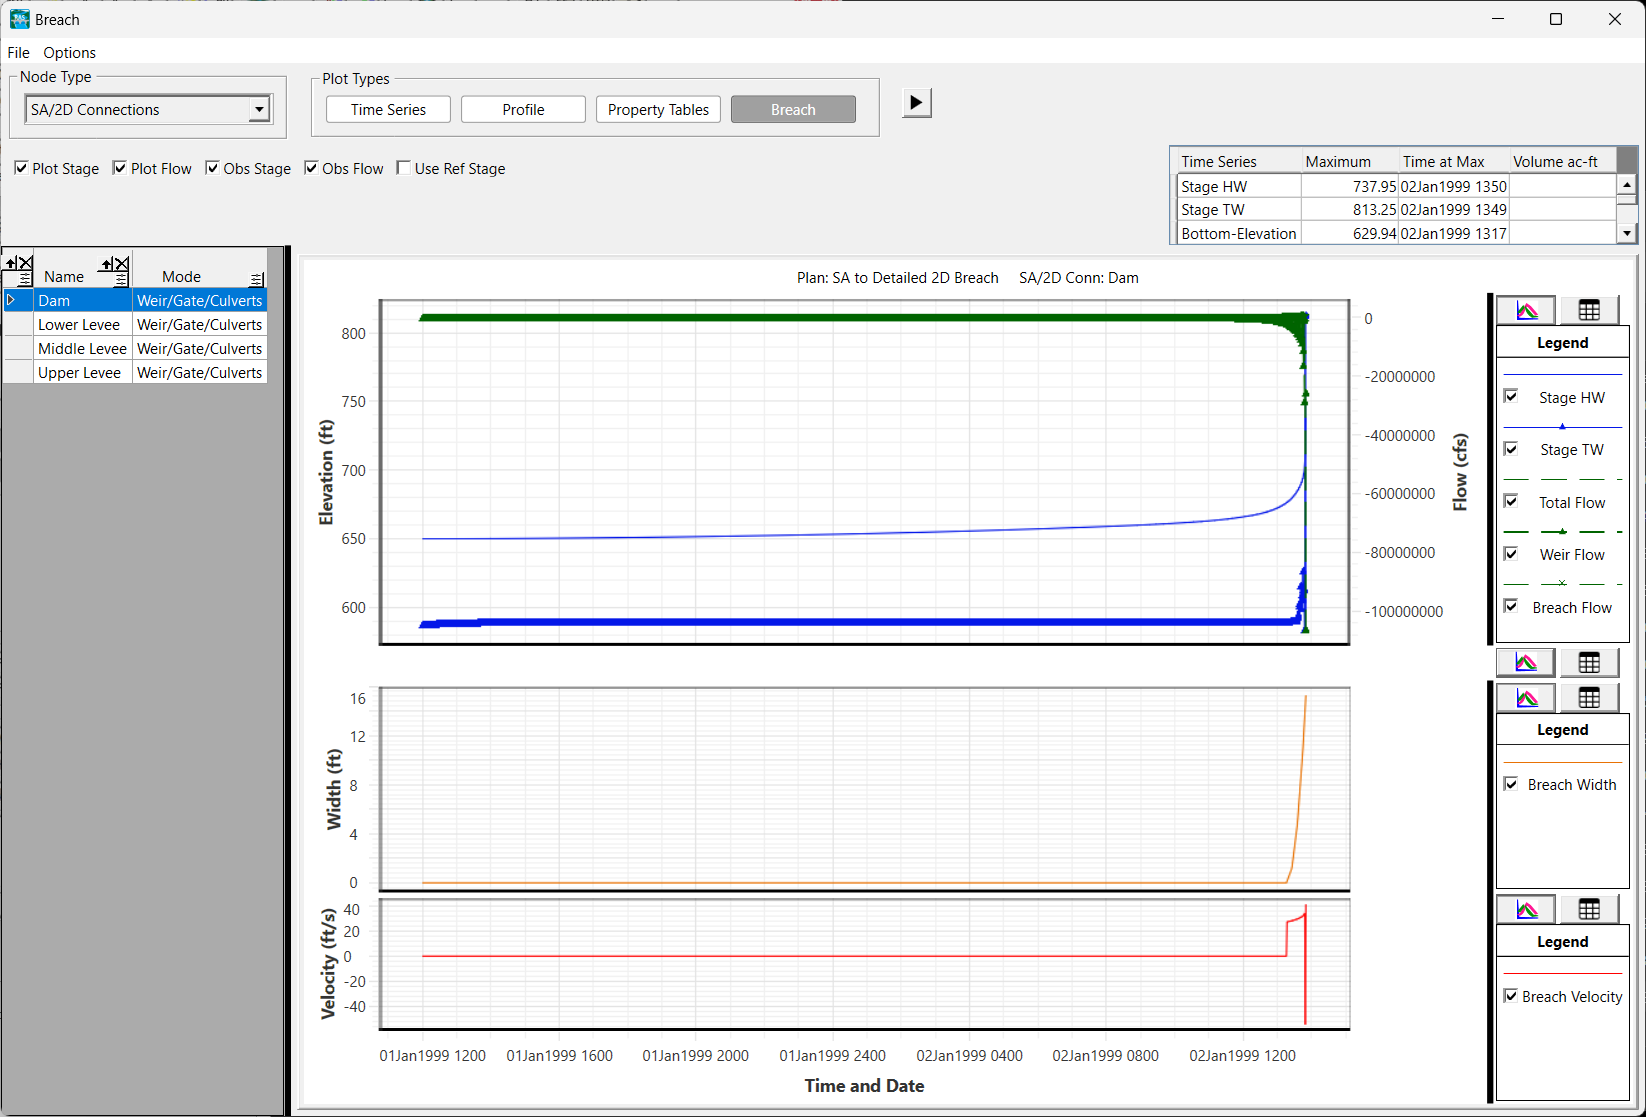
Breach
The breach plot coordinates output from elements that were breached during the simulation. The breach plot contains plots of stage and flow, breach width, and breach velocity.
Options
An options menu is provided at the top of the Stage and Flow Hydrograph plot.
Plans
Comparison of model simulations is performed using the Plans option. Select for the results to compare two or more simulations.

Variables
Plot variables are dependent on the Node Type and Plot Type. For instance there is only one water surface Profile plot options for Cross Sections but Reference Lines have two ways to plot water surface or velocity based on interpolated results from RAS Mapper or flow averaged from the compute engine. Example Reference Line plot options are shown below.

Differences
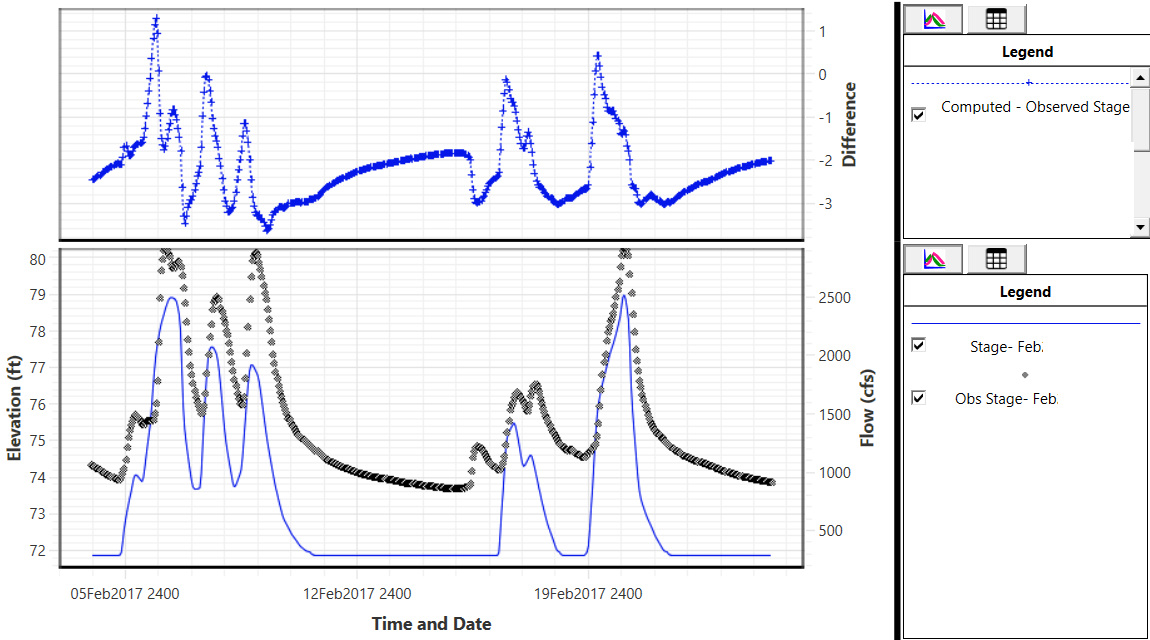
When plotting two different plans, if the user chooses the Show Differences option, the plot will show a Difference plot for the time series data. This is convenient for identifying small differences in results at select locations. When evaluating encroachment results, the Difference plot is shown automatically. The plot will also show the difference between computed and observed data. An example hydrograph plot of observed and computed stage values is shown below with the Difference plot turned on.