Download PDF
Download page Tabular Output.
Tabular Output
Summary tables of the detailed water surface profile computations are often necessary to analyze and document simulation results. Tabular output allows the user to display large amounts of detailed information in a concise format. HEC-RAS has two basic types of tabular output, detailed output tables and profile summary tables.
Detailed Output Tables
Detailed output tables show hydraulic information at a single location, for a single profile. To display a detailed output table on the screen, select Detailed Output Tables from the View menu of the main HEC-RAS window. An example detailed output table is shown in the figure below.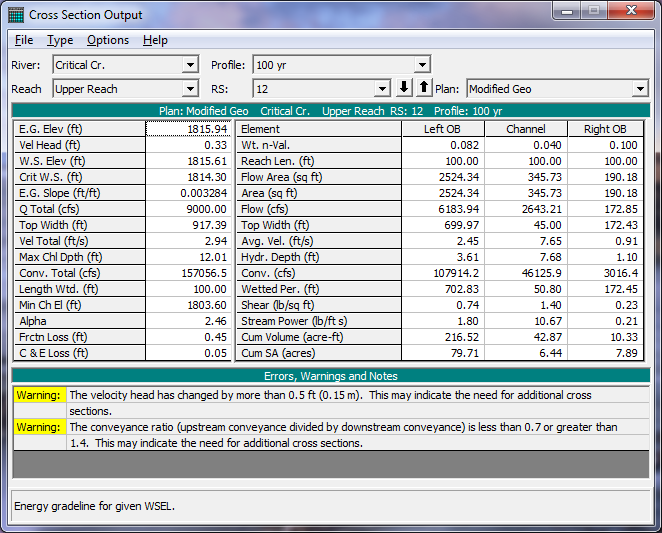
By default, this table comes up displaying detailed output for cross sections. Any cross section can be displayed in the table by selecting the appropriate river, reach and river station from the list boxes at the top of the table. Also, any of the computed profiles can be displayed by selecting the desired profile from the profile list box. Additionally, different plans can be viewed by selecting a plan from the plan list box.
Users can also view detailed hydraulic information for other types of nodes. Other table types are selected from the Type menu on the detailed output table window. The following types are available in addition to the normal cross section table (which is the default):
Culvert. The culvert table type brings up detailed culvert information. This table can be selected for normal culverts, or for culverts that are part of a multiple opening river crossing. An example culvert specific table is shown in in the figure below.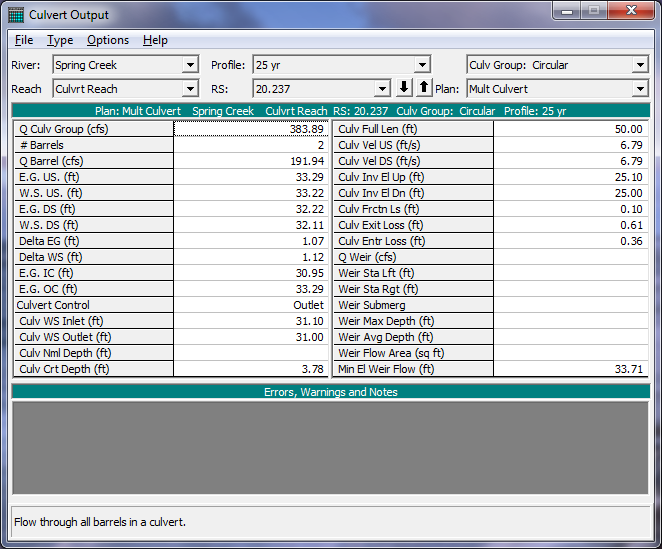
Bridge. The bridge table type brings up detailed output for the cross sections inside the bridge as well as just upstream of the bridge. The bridge table type can be selected for normal bridge crossings, or for bridges that are part of a multiple opening river crossing. An example of the bridge specific cross section table is shown in in the figure below.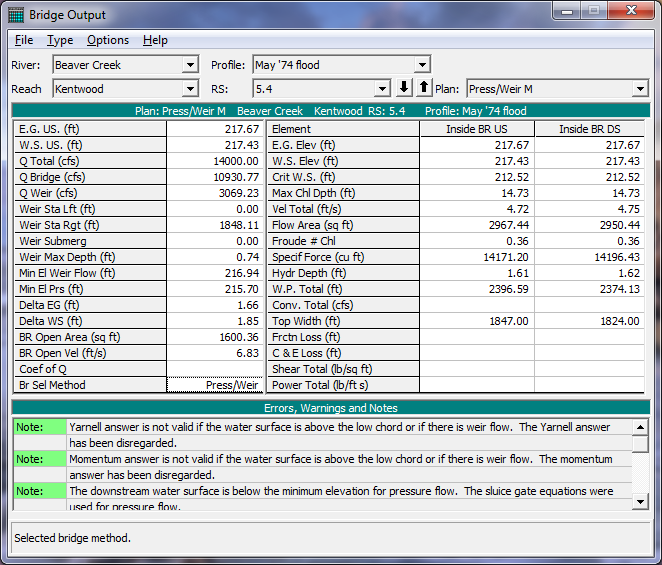
Multiple Opening. The multiple opening type of table is a combination of the cross section table and the bridge and culvert tables. That is, if the user has defined multiple opening (bridges, culverts, and conveyance areas), then this table can be used to view the hydraulic results for each specific opening.
Inline Structure. The Inline Structure type of table can be used to view detailed output for any inline weirs and/or gated spillways that have been entered by the user.
Lateral Structure. The Lateral Structure type of table can be used for viewing detailed output from a lateral weir, gated spillway, culvert, and rating curves.
Storage Area. This table provides output about an individual storage area. Information includes water surface elevation, total inflow, total outflow, and net inflow.
Storage Area Connection. This table provides detailed information about storage area connections. Storage area connections can consist of weirs, gated spillways, and culverts.
Pump Stations. This table provides detailed information about pump stations. Pump station output includes to and from water surface elevations, total flow, flow through each pump group, flow through each pump, head difference, and efficiency.
Flow Distribution In Cross Sections. The Flow Distribution table type can be used to view the computed flow distribution output at any cross section where this type of output was requested. An example of the flow distribution table output is shown in in the figure below.
At the bottom of each of the detailed output tables are two text boxes for displaying messages. The bottom text box is used to display the definition of the variables listed in the table. When the user presses the left mouse button over any data field, the description for that field is displayed in the bottom text box. The other text box is used to display any Errors, Warnings, and Notes that may have occurred during the computations for the displayed cross section.
Detailed Output Table Options
Plans. This option allows the user to select which plan, and therefore output file, they would like to view. This option is available from a list box at the upper right-hand side of the window.
Under the Options menu of the cross-section table window, the user has the following options:
Include Interpolated XS's. This option allows the user to either view interpolated cross-section output or not. Turning the "include interpolated XS's" option on (which is the default), allows interpolated sections to be selected from the river station box. Turning this option off gets rid of all the interpolated sections from the river station selection box, and only the user entered cross-sections are displayed.
Include Errors, Warnings, and Notes in Printout. This option allows the user to have the errors, warnings, and notes information printed below the table, when the option to print the table is selected.
Units System for Viewing. This option allows the user to view the output in either English or Metric units. It does not matter whether the input data is in English or Metric, the output can be viewed in either system.
Profile Summary Tables
Profile summary tables are used to show a limited number of hydraulic variables for several cross sections. To display a profile summary table on the screen, select Profile Summary Table from the View menu of the main HEC-RAS window. An example profile summary table is shown in the figure below.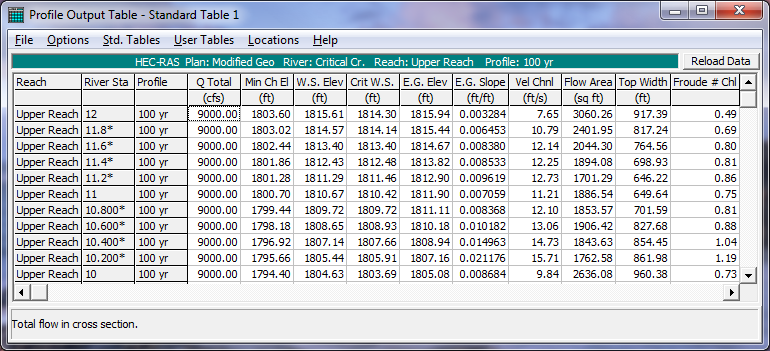
There are several standard table (Std. Tables) types available to the user. Some of the tables are designed to provide specific information at hydraulic structures (e.g., bridges and culverts), while others provide generic information at all cross sections. The standard table types available to the user are:
Standard Table 1. The is the default profile type of table. This table gives you a summary of some of the key output variables.
Standard Table 2. This is the second of the standard summary tables. This table provides information on the distribution of flow between the left overbank, main channel, and right overbank. This table also shows the friction losses, as well as contraction and expansion losses that occurred between each section. Energy losses displayed at a particular cross section are for the losses that occurred between that section and the next section downstream.
Four XS Culvert. This standard table provides summary results for the four cross sections around each of the culverts in the model. The four cross sections are the two immediately downstream and the two immediately upstream of the culvert. This table will list all of the culverts in the model for the selected reaches.
Culvert Only. This standard table provides hydraulic information about the culvert, as well as the inlet control and outlet control computations that were performed.
Six XS Bridge. This table provides summary results for the six cross sections that make up the transition of flow around a bridge. The six cross sections include the two cross sections just downstream of the bridge; the two cross sections inside of the bridge; and the two cross sections just upstream of the bridge. The program will display results for all the bridges in the model within the selected reaches. When viewing this table, on occasion there will be no displayed results for the cross sections inside of the bridge. This occurs only when the user has selected a bridge modeling approach that does not compute results inside of the bridge. This includes: Yarnell's method; both pressure flow equations; and pressure and weir flow solutions.
Bridge Only. The bridge only table shows summary information specifically for bridges.
Bridge Comparison. The bridge comparison table shows the results for all of the user selected bridge modeling approaches that were computed during the computations. For example, the program can calculate low flow bridge hydraulics by four different methods. The resulting upstream energy for the user selected methods will be displayed in this table.
Multiple Opening. This table shows a limited number of output variables for each opening of a multiple opening river crossing.
Four XS Inline Structure. This table displays summary results of the four cross sections immediately around an inline weir and/or gated spillway. The four cross sections are the two immediately upstream and the two immediately downstream of the inline weir and/or gated spillway.
Inline Structure. This table shows the final computed water surface and energy just upstream of each of the inline weir and/or gated spillways. In addition to these elevations, the table displays the total flow, the flow over the weir, and the total flow through all of the gates.
Lateral Structure. This table shows a limited set of output variables for all of the lateral weir/spillway structures within the selected reaches.
Encroachment 1, 2, and 3. These three standard tables provide various types of output for the computations of floodway encroachments.
HEC-FDA. This table provides information that can be exported to the HEC Flood Damage Analysis (FDA) program. The table displays total flow, channel invert elevation, and water surface elevation.
HEC-5Q. This table provides information that can be exported to the HEC-5Q (river and reservoir water quality analysis) program. The table displays only the specific parameters required by the HEC-5Q program.
Ice Cover. This table shows summary output of ice information. This table was designed for performing a study that includes ice cover.
Junctions. This summary table provides a limited set of output for all of the cross sections that bound a junction. This table will show this output for all of the junctions found in the model.
Storage Areas. This table shows a limited amount of output for all of the storage areas in the model. Output includes: water surface elevation; minimum storage area elevation; surface area; and volume.
Conn with Culverts. This table will show summary output for storage area connections that contain culverts.
Pump Stations. This table shows a limited amount of output for any of the pump stations contained within the model.
To view one of the types of tables, select the desired table type from the Std. Tables menu on the profile summary table. In addition to the various types of profile tables, the user can specify which plans, profiles and reaches to include in the table. The plans, profiles and reaches options are available from the Options menu on the profile plot.
The user also has the ability to turn the viewing of interpolated cross sections on or off. The default is to view all cross-sections, including the interpolated ones. To prevent the interpolated sections from showing up in the table, de-select Include Interpolated XS's from the Options menu.
Another feature available to users is the ability to set the number of decimal places that will be displayed for any variable of the pre-defined tables. Once a pre-defined table is selected from the Tables menu, select Standard Table # Dec Places from the Options menu. A window will appear displaying the current number of decimal places for each variable. The user can change the number of decimal places to whatever they wish.
User's also have the ability to view summary output tables in either English or metric units. This is available from the Options menu on the profile tables. It does not matter whether the input data is in English or metric, the output can be viewed in either system.
User Defined Output Tables
A special feature of the profile summary tables is the ability for users to define their own output tables. User defined output tables are available by selecting Define Table from the Options menu of the profile table. When this option is selected, a window will appear, as shown in the figure below. At the top of the window is a table for the user selected variable headings (Table Column Headings), the units, and the number of decimal places to be displayed for each variable. Below this table is a table containing all of the available variables that can be included in your user-defined table. The variables are listed in alphabetical order. In addition to the variable names, to the right of each variable is a description.
To add variables to the column headings, simply double click the left mouse button while the mouse pointer is over the desired variable. The variable will be placed in the active field of the table column headings. To select a specific column to place a variable in, click the left mouse button once while the mouse pointer is over the desired table column field. To delete a variable from the table headings, double click the left mouse button while the mouse pointer is over the variable that you want to delete. The number of decimal places for each variable can be changed by simply typing in a new value.
User defined tables are limited to 15 variables. Once you have selected all of the variables that you want, press the OK button at the bottom of the window. The profile table will automatically be updated to display the new table.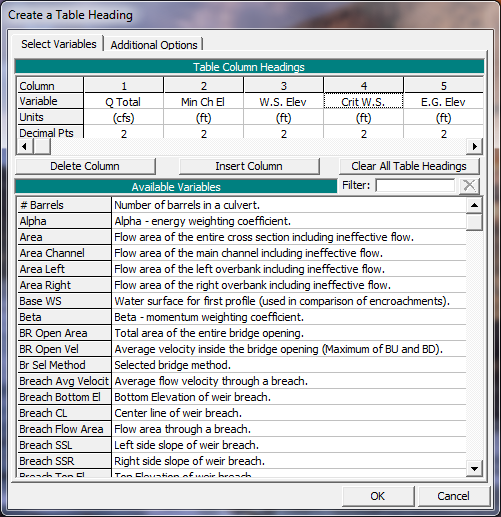
Once you have the table displayed in the profile table window, you can save the table headings for future use. To save a table heading, select Save Table from the Options menu on the profile table window. When this option is selected, a pop-up window will appear, prompting you to enter a name for the table. Once you enter the name, press the OK button at the bottom of the pop-up window. The table name will then be added to a list of tables included under the User Tables menu on the profile table window. To delete a table from the list of user defined tables, select Remove Table from the Options menu of the profile table window. When this option is selected, a pop-up window will appear displaying a list of all the user-defined tables. Click the left mouse button over the tables that you want to delete, then press the OK button. The selected tables will then be deleted from the User Tables menu list.
Sending Tables to the Printer
To send a table to the printer, do the following:
- Bring up the desired table from the tabular output (cross section or profile tables) section of the program.
- Select Print from the File menu of the displayed table. When this option is selected, a pop-up window will appear allowing you to modify the default print options. Once you have set the printer with the desired options, press the Print button. The table will be sent to the Windows Print Manager. The Windows Print Manager will control the printing of the table.
The profile summary type of tables allow you to print a specific portion of the table, rather than the entire table. If you desire to only print a portion of the table, do the following:
- Display the desired profile type table on the screen.
- Using the mouse, press down on the left mouse button and highlight the area of the table that you would like to print. To get an entire row or column, press down on the left mouse button while moving the pointer across the desired row or column headings.
- Select Printer from the File menu of the displayed table. Only the highlighted portion of the table and the row and column headings will be sent to the Windows Print Manager.
Sending Tables to the Clipboard
To pass a table to the Windows Clipboard, and then to another program, do the following:
- Display the desired table on the screen.
- Select Copy to Clipboard from the File menu of the displayed table.
- Bring up the program that you want to pass the table into. Select Paste from the Edit menu of the receiving program.
Portions of the profile tables can be sent to the Clipboard in the same manner as sending them to the printer.