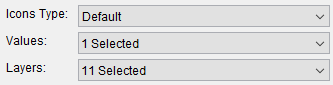
When you are in the Modeling module, at the bottom of the Watershed Pane are the Forecast Tabs. There are six tabs - Actions, Reports, Scripts, Icon Layers, Workflow, and Team. Each tab provides you with different commands that will allow you to compute a forecast; view extract results; run scripts; select the attributes for the time series layers that are displayed within the watershed; view the workflow of the selected forecast runs; and, provides information on team modeling for the selected watershed. For example, click the Icon Layers tab, the Time Series Icon Controls display, which are also available from the Acquisition and Visualization modules.
