HEC-HMS Results
HEC-HMS may be used in HEC-RTS to compute watershed runoff, given initial system states and watershed precipitation. HEC-HMS results available from the HEC-RTS interface include a forecast summary report; a table of time-series parameter data, and a plot of the time-series data. These results are available from the individual watershed elements as defined in the HEC-HMS model alternative.
Graphical Results
To view graphical results for individual HEC-HMS model elements (e.g., reaches, sinks):
- From the Modeling module, to view this report, make sure you have an active forecast and at least one forecast run selected (checkbox) for viewing results. From the Forecast Runs Details section, next to an HEC-HMS model alternative (Daily Forecasting – 15MIN), click
 . The individual model elements for the selected HEC-HMS model alternative will display.
 - Select an HEC-HMS model element (Calpella Gage), from the Forecast tabs, click Reports. Click Graph, a dialog will open (Figure 1), displaying a graph of the selected HEC-HMS model element. The graph provides the name and type of the HEC-HMS model element; you can zoom in/out on graph; make adjustment to the graph's properties; and, print the graph.
")
- From the graphical dialog (Figure 1), click
 , the dialog will close.
Time-Series Results
To view time-series results for individual HEC-HMS model elements (e.g., reaches, sinks):
- From the Modeling module, to view this report, make sure you have an active forecast and at least one forecast run selected (checkbox) for viewing results. From the Forecast Runs Details section, next to an HEC-HMS model alternative (Daily Forecasting – 15MIN), click
 . The individual model elements for the selected HEC-HMS model alternative will display.
 - Select an HEC-HMS model element (Calpella Gage), from the Forecast tabs, click Reports. Click Time-Series Table, the Time-Series Results dialog will open (Figure 2). For the selected HEC-HMS model element, the Time-Series Results dialog, provides information on the watershed; name of the HEC-HMS model alternative; the HEC-HMS model alternative key code (variant); what type of HEC-HMS model element and name; time window information for the compute; HEC-HMS basin model that is used; HEC-HMS meteorologic model that is used; and, a table of time-series results.
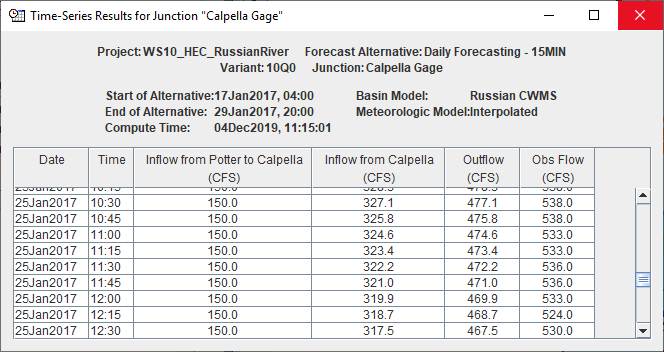
- From the Time-Series Results dialog (Figure 2), click , the dialog will close.
Summary Results
To view a summary of results for individual HEC-HMS model elements (e.g., reaches, sinks):
- From the Modeling module, to view this report, make sure you have an active forecast and at least one forecast run selected (checkbox) for viewing results. From the Forecast Runs Details section, next to an HEC-HMS model alternative (Daily Forecasting – 15MIN), click
 . The individual model elements for the selected HEC-HMS model alternative will display.
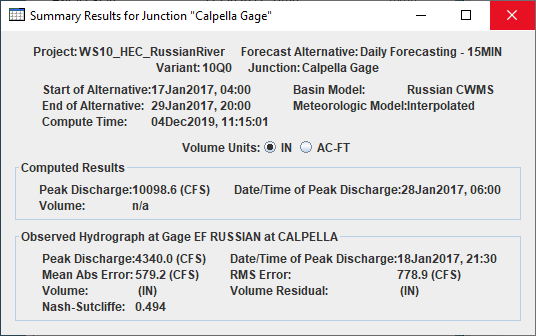
 - Select an HEC-HMS model element (Calpella Gage), right-click on the model element, from the shortcut menu, click Summary Table. The Summary Results dialog will open (Figure 3). For the selected HEC-HMS model element, the Summary Results dialog, provides information on the watershed; name of the HEC-HMS model alternative; the HEC-HMS model alternative key code (variant); what type of HEC-HMS model element and name; time window information for the compute; HEC-HMS basin model that is used; HEC-HMS meteorologic model that is used; volume units; computed results; and, in some cases information about the observed hydrograph at a gage.
- From the Time-Series Results dialog (Figure 3), click , the dialog will close.