HEC-RAS Results
HEC-RAS may be used in HEC-RTS to simulate the behavior of channels in a watershed, given flow rates predicted with HEC-HMS. There are several reports available from HEC-RAS for the HEC-RAS model alternative, and for HEC-RAS model elements. From an HEC-RAS model alternative you have a series of reports, that provide you with results for key variables; distribution of flow (left and right overbank, main channel); steady flow results; unsteady flow results; rating curves; and, much more. There are two HEC-RAS model elements (cross sections, routing reach), you can review plots of cross sections; and, plots from routing reaches (profiles, XYZ).
Standard Table 1
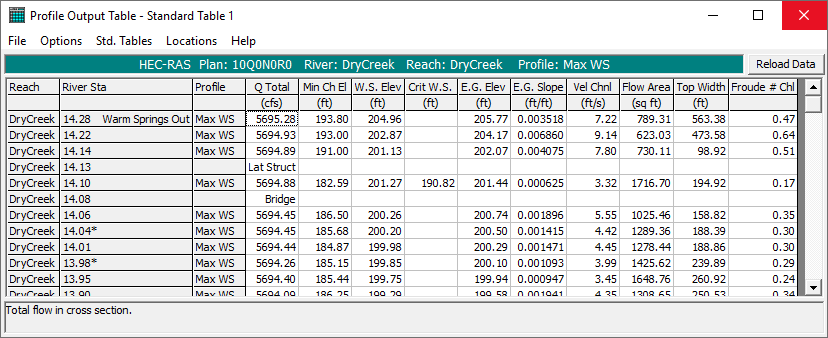
The Standard Table 1 is the default summary table (Figure 1). This table provides you a summary of key HEC-RAS output variables. To view the Standard Table 1:
- From the Modeling module, to view this report, make sure you have an active forecast and at least one forecast run selected (checkbox) for viewing results. From the Forecast Runs Detail section, select an HEC-RAS model alternative (Russian River Real-Time), from the Forecast tabs, click Reports.
- Click Summary Output Table, the Profile Output Table - Standard Table 1 dialog (Figure 1) opens. This report displays several hydraulic variables for stream stations. You can change certain parameters that are displayed, from the Options menu (Figure 1), you can choose which profiles and reaches to display, you can add a column to the report that includes the profile name, and you can choose which system units you wish to view the report in.
- From the File menu, click Exit, and the Profile Output Table - Standard Table 1 dialog (Figure 1) closes.
Standard Table 2
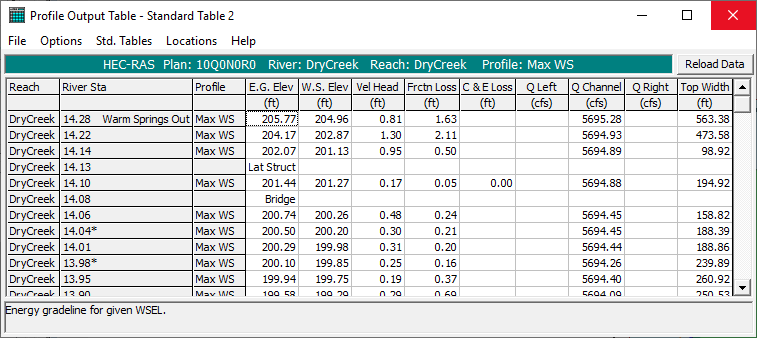
The Standard Table 2 (Figure 2) is the second of the standard summary tables. This table provides information on the distribution of flow between the left overbank, main channel, and right overbank. This table also shows the friction losses, as well as contraction and expansion losses that occurred between each section. Energy losses displayed at a cross section are for the losses that occurred between that section and the next section downstream.
To view the Standard Table 2:
- From the Modeling module, to view this report, make sure you have an active forecast and at least one forecast run selected (checkbox) for viewing results. From the Forecast Runs Detail section, select an HEC-RAS model alternative (Russian River Real-Time), from the Forecast tabs, click Reports.
- Click Summary Output Table, the Profile Output Table - Standard Table 1 dialog (Figure 1) opens. From the Std. Tables menu, click Standard Table 2, the Profile Output Table - Standard Table 2 dialog (Figure 2) will open. The report displays several hydraulic variables for stream stations. You can change certain parameters that are displayed, from the Options menu (Figure 2), you can choose which profiles and reaches to display, you can add a column to the report that includes the profile name, and you can choose which system units you wish to view the report in.
- From the File menu, click Exit, and the Profile Output Table - Standard Table 2 dialog (Figure 2) closes.
Detailed Output Table
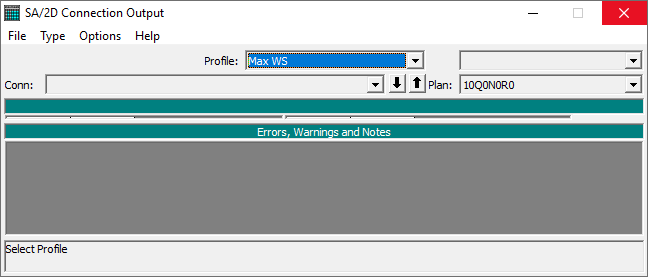
Detailed output tables display hydraulic information at a single location for a single profile, for an HEC-RAS node type (i.e., cross section, culverts, bridges, etc.). For HEC-RTS version 3.1.1, the default node type is SA/2D Connections. For the example, in this User's Manual, for the HEC-RAS model alternative, there are no SA/2D Connections nodes. The user will need to select an appropriate node type to display information in a detailed output table.
To view a Detailed Output Table:
- From the Modeling module, to view this report, make sure you have an active forecast and at least one forecast run selected (checkbox) for viewing results. From the Forecast Runs Detail section, select an HEC-RAS model alternative (Russian River Real-Time), from the Forecast tabs, click Reports.
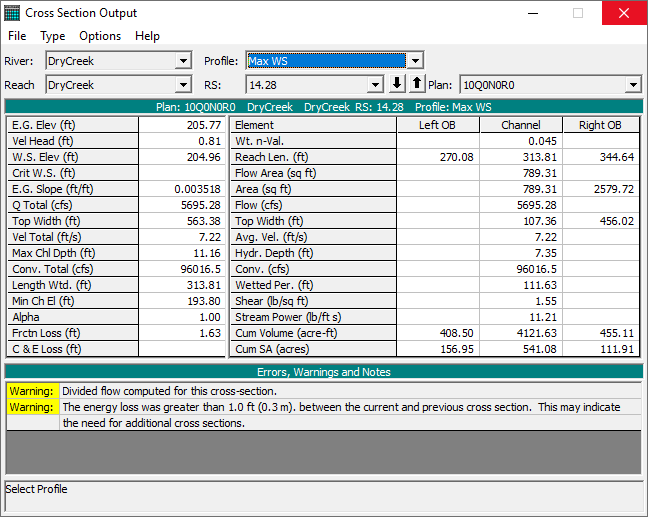
- Click Detailed Output Table, the SA/2D Connection Output dialog (Figure 3) opens. This is the HEC-RAS default node type (storage area connection), which is not used in the example watershed for this User's Manual.
- From the Type menu (Figure 3), click Cross Sections, the Cross Section Output dialog (Figure 4) will open. The report displays detailed hydraulic information about a single cross section (14.28) in the HEC-RAS model alternative. You can view information for other cross sections in the HEC-RAS model alternative, by manipulating the River, Reach, Profile, and RS lists (Figure 4). For further details on this HEC-RAS report, refer to the HEC-RAS User's Manual (Chapter 9).
- There are several other node types available in HEC-RAS - culvert, bridge, multiple opening, inline structure, lateral structure, storage area, storage area connection, pump stations, and flow distribution in cross sections. For further details, refer to the HEC-RAS User's Manual (Chapter 9).
- From the File menu, click Exit, and the Cross Section Output dialog (Figure 4) closes.
Profile Plot
The result of a steady flow HEC-RAS model alternative is the calculation of water surface profiles. To view the water surface profile plot:
- From the Modeling module, to view this report, make sure you have an active forecast and at least one forecast run selected (checkbox) for viewing results. From the Forecast Runs Detail section, select an HEC-RAS model alternative (Russian River Real-Time), from the Forecast tabs, click Reports.
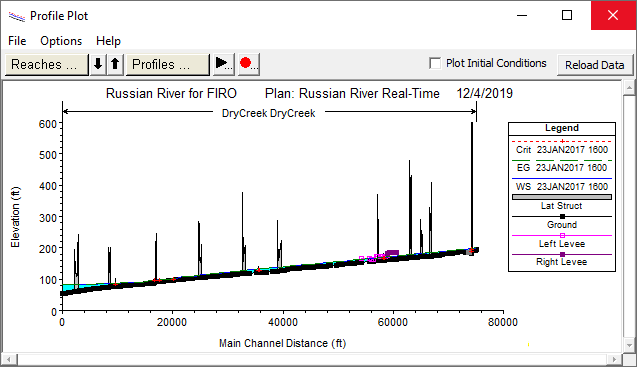
- Click Profile Plot, the Profile Plot dialog (Figure 5) opens. The Profile Plot displays the water surface profile for the first reach (routing) in the river system. To view other water surface profiles, you will need to manipulate the reaches and profiles. This manipulation is done by either clicking on Reaches or Profiles (Figure 5) and selecting what you want changed; change reaches by manipulating the up and down arrow to the right of the Reaches button; view profiles by using the animation controls; and, by changing various parameters that are available from the Options menu (Figure 5). For further details on this HEC-RAS report, refer to the HEC-RAS User's Manual (Chapter 9, Tabular Output section).
- From the File menu, click Exit, and the Profile Plot dialog (Figure 5) closes.
Stage & Flow Hydrograph
During an HEC-RAS unsteady flow compute, stage and flow hydrographs are generated. To view the stage and flow hydrographs for a selected HEC-RAS model:
- From the Modeling module, to view stage and flow hydrographs, make sure you have an active forecast and at least one forecast run selected (checkbox) for viewing results. From the Forecast Runs Detail section, select an HEC-RAS model alternative (Russian River Real-Time), from the Forecast tabs, click Reports.
- Click Stage & Flow Hydrograph, the Stage and Flow Hydrographs dialog (Figure 6) opens. You can plot stage, plot flow, plot observed stage, plot observed flow, and plot stage using a reference stage. By default, as displayed in Figure 6, the node type is cross sections, allowing you to view hydrographs at cross sections only.
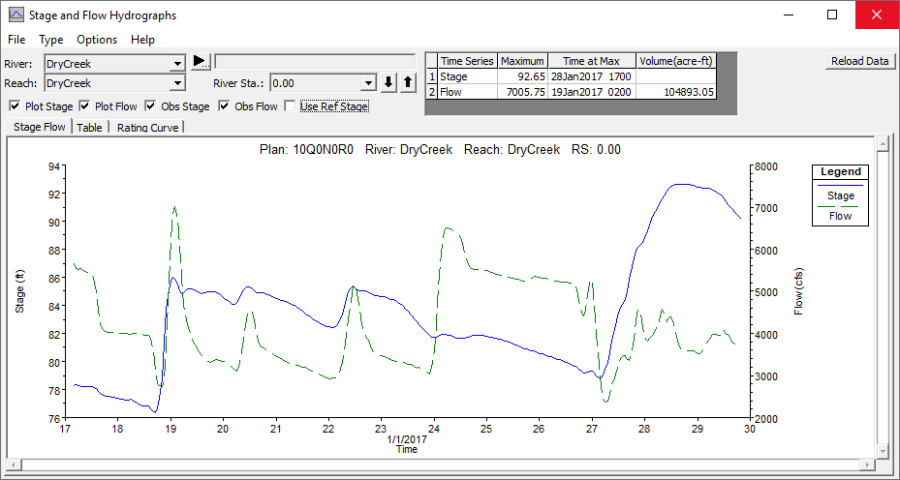
- There are several other node types available in HEC-RAS - bridges/culverts, inline structures, lateral structures, storage areas, storage area connections, pump stations, ground water interactions, and storage area connections flow are with BC lines. You can view information by manipulating the River, Reach, and River Sta. lists (Figure 6). For further details on this HEC-RAS report, refer to the HEC-RAS User's Manual (Chapter 9).
- Additional, from the Stage and Flow Hydrographs dialog (Figure 6), besides viewing data in a plot, from the three available tabs you can also view data in a tabular form (Table), and plot a rating curve of the selected event (Rating Curve). For further details on this HEC-RAS report, refer to the HEC-RAS User's Manual (Chapter 9).
- From the File menu, click Exit, and the Stage and Flow Hydrographs dialog (Figure 6) closes.
Rating Curve Plots
During an HEC-RAS compute, if information for rating curves has been defined, rating curves can be viewed. To view rating curves for a selected HEC-RAS model alternative:
- From the Modeling module, to view rating curves, make sure you have an active forecast and at least one forecast run selected (checkbox) for viewing results. From the Forecast Runs Detail section, select an HEC-RAS model alternative (Russian River Real-Time), from the Forecast tabs, click Reports.
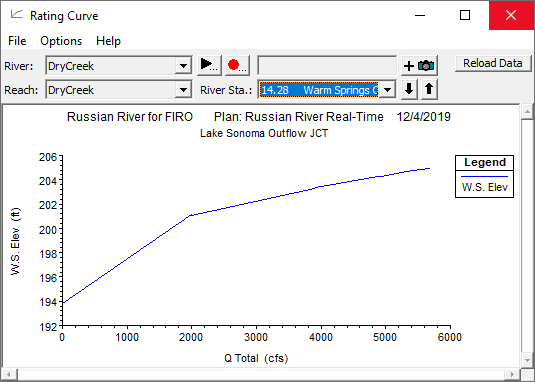
- Click Rating Curve, the Rating Curve dialog (Figure 7) opens. The Rating Curve plot displays the water surface elevation versus flow rate for the water surface profiles that were computed. To view other rating curves, manipulate the River, Reach, and River Sta. lists (Figure 7). For further details on this HEC-RAS report, refer to the HEC-RAS User's Manual (Chapter 9).
- From the File menu, click Exit, and the Rating Curve dialog closes (Figure 7).
Cross Section Plot
During an HEC-RAS compute, at each defined cross section, data is generated. A cross section plot will display results from an HEC-RAS compute. To view cross section information for a selected HEC-RAS model alternative:
- From the Modeling module, to view cross section information, make sure you have an active forecast and at least one forecast run selected (checkbox) for viewing results. From the Forecast Runs Detail section, select an HEC-RAS model alternative (Russian River Real-Time), from the Forecast tabs, click Reports.
- Click Cross Section Plot, the Cross Section dialog (Figure 8) opens. The Cross Section plot displays the computed results (i.e., maximum water surface elevation; energy grade) at the selected cross section (14.28). To view other cross sections, manipulate the River, Reach, and River Sta. lists (Figure 8). For further details on this HEC-RAS report, refer to the HEC-RAS User's Manual (Chapter 9).
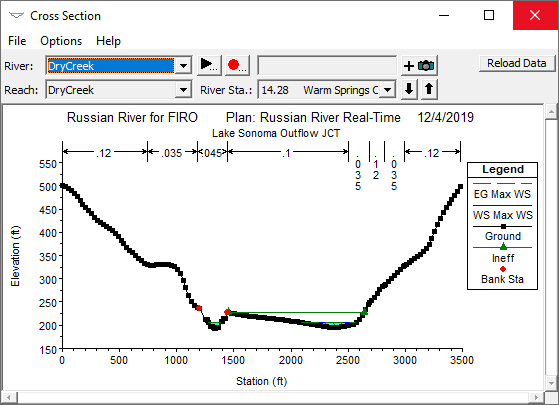
3. From the File menu, click Exit, and the Cross Section dialog closes (Figure 8).
X-Y-Z 3-D Plots
Once an HEC-RAS compute is complete, you can review multiple cross section within a reach from an X-Y-Z 3-D plot for the selected HEC-RAS model alternative. To view an X-Y-Z 3D plot:
- From the Modeling module, to view multiple cross section within a reach, make sure you have an active forecast and at least one forecast run selected (checkbox) for viewing results. From the Forecast Runs Detail section, select an HEC-RAS model alternative (Russian River Real-Time), from the Forecast tabs, click Reports.
- Click X-Y-Z 3-D Plot, the X-Y-Z Perspective Plot dialog (Figure 9) opens. The
X-Y-Z Perspective Plot displays multiple cross section within a reach. You can select which reaches to be plotted; the range of the cross sections (Upstream RS, Downstream RS lists); and, which HEC-RAS pans and profiles will be displayed. For further details on this HEC-RAS report, refer to the HEC-RAS User's Manual (Chapter 9).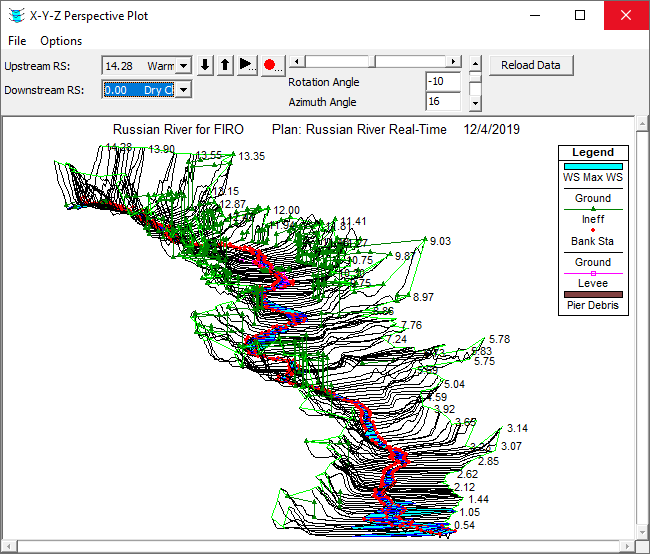
- From the File menu, click Exit, and the X-Y-Z Perspective Plot dialog closes (Figure 9).
General Profile Plot
Once an HEC-RAS compute is complete, for a profile, you might want to plot variables other than water surface profile. Any variable that is computed at a cross section can be displayed in a profile. To view a general profile plot:
- From the Modeling module, to view a general profile plot, make sure you have an active forecast and at least one forecast run selected (checkbox) for viewing results. From the Forecast Runs Detail section, select an HEC-RAS model alternative (Russian River Real-Time), from the Forecast tabs, click Reports.
- Click General Profile Plot, the General Profile Plot - Velocities dialog (Figure 10) opens. The General Profile Plot - Velocities displays velocity versus distance for a profile by default. There are predefined plots from the Standard Plots menu (Figure 10) the you can plot (i.e., flow, area, top width, weighted n, Froude number, hydraulic depth, shear, surface area, volume, steam power). For further details on this HEC-RAS report, refer to the HEC-RAS User's Manual (Chapter 9).
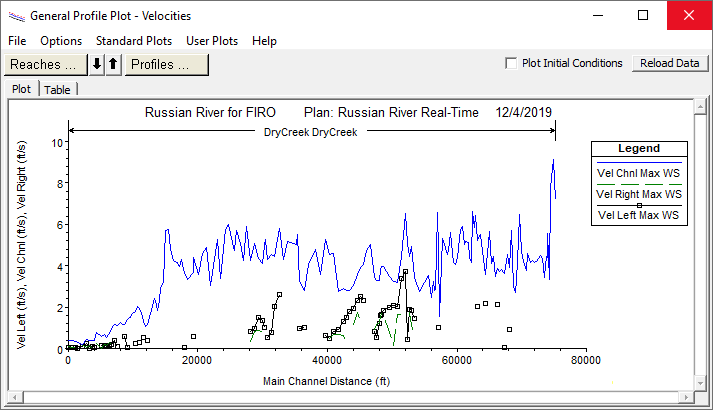
- You can also create your own plots, from the Options menu (Figure 10), click Plot Variables. The Y Axis Variable dialog will open, from the Y Axis Variable dialog you choose which variables to plot and then save the plot (User Plots) for future use. For further details on this HEC-RAS report, refer to the HEC-RAS User's Manual (Chapter 9).
- From the File menu, click Exit, and the General Profile Plot - Velocities dialog closes (Figure 10).
Hydraulic Properties Tables
Once an HEC-RAS compute is complete, you can view the computed curves based on the hydraulic table parameters that have been entered for the cross section and structures, for the selected HEC-RAS model alternative. To view hydraulic table curves:
- From the Modeling module, to view hydraulic table curves, make sure you have an active forecast and at least one forecast run selected (checkbox) for viewing results. From the Forecast Runs Detail section, select an HEC-RAS model alternative (Russian River Real-Time), from the Forecast tabs, click Reports.
- Click Hydraulic Properties Table, the View Hydraulic Property Tables dialog (Figure 11) opens. The View Hydraulic Property Tables default plot displays curves for each variable that you have selected by cross section (14.28). Click Variables (Figure 11), from the available list you can turn on/off what variables to plot. To view other cross sections, manipulate the River, Reach, and Riv Sta lists (Figure 11). For further details on this HEC-RAS report, refer to the HEC-RAS User's Manual.
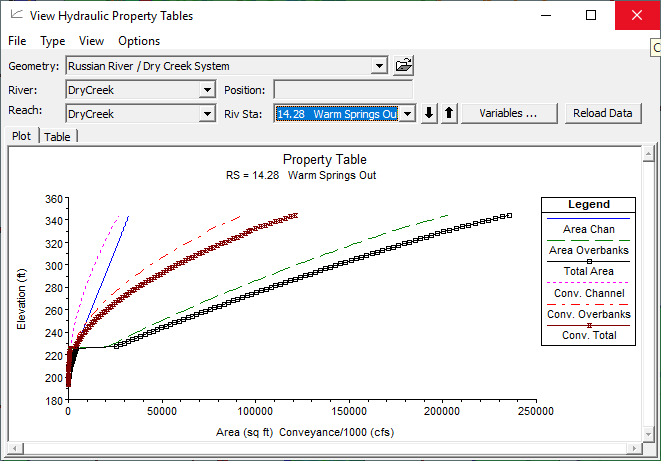
- From the Type menu (Figure 11), you can change the type of values that are displayed. You have a choice between cross sections, internal boundaries, and storage area connections. For further details on this HEC-RAS report, refer to the HEC-RAS User's Manual (Chapter 9). From the File menu, click Exit, and the View Hydraulic Property Tables dialog closes (Figure 11).
RAS Mapper Results
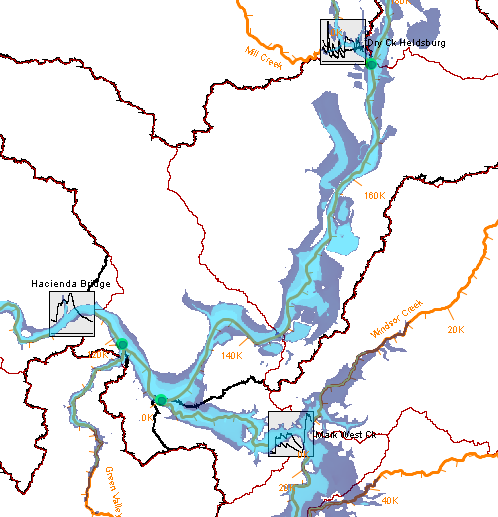
Within the HEC-RAS software application, when performing an unsteady flow analysis, RAS Mapper is a tool that you can use to be build various type of inundation maps (Depth(max), Velocity(max), WSE(max), D*V(max), Arrival Time). If the HEC-RAS model alternative in an HEC-RTS forecast run, includes running RAS Mapper, and an HEC-RTS forecast compute is successfully, then you will have inundation map(s) that you could view in the Map Window. To view RAS Mapper inundation maps:
- From the Modeling module, to view RAS Mapper inundation maps, make sure you have an active forecast and at least one forecast run selected (checkbox) for viewing results. From the Forecast Runs Detail section, select an HEC-RAS model alternative (Russian River Real-Time), from the Forecast tabs, click Reports.
- From the Reports section, there are three buttons – Depth (Max), D_V(Max), and Arrival Time (2ft hrs). These buttons are toggles, which will cause the RAS Mapper inundation maps to display in the Map Window (Figure 12). For example, in Figure 12, you have clicked Arrival Time (2ft hrs), which will cause the associated inundation map to display. If you click Arrival Time (2ft hrs) again, the inundation map will no longer display. For further details on the RAS Mapper tool, refer to the HEC-RAS User's Manual (Chapter 20).
