Customizing Plots
Overview
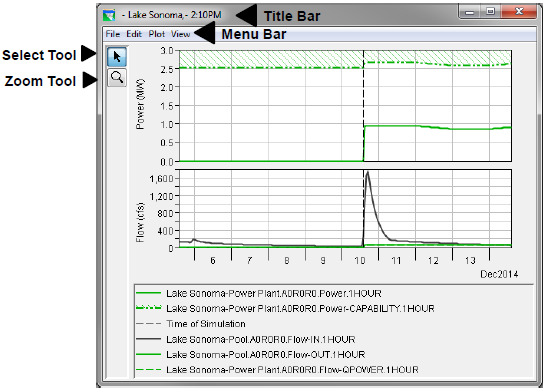
From the Plot window, several editors allow you to configure default properties for all plots, as well as customize individual plots. Figure 1 shows the features plot area that can be configured.

- Title of Plot: You can add a title to all plots or to individual plots.
- Marker: You can add markers on the X- and Y-axes and customize the appearance of these markers.
- Panel Background Color: You can specify the background color of the plot window (light grey is the default) for all plots only.
- Curve/Line Properties: You can choose the line and point styles, add labels, and specify symbols to indicate quality.
- Label: You can add borders and backgrounds to axis and legend labels.
- Spacer: You can specify the distance between viewports, between a viewport and the legend, and the width of side margins.
- Viewport: You can customize the border around the viewport, the background color and pattern, and the appearance of gridlines. You can also specify the number, size, and content of viewports.
- Callout: You can add descriptive callouts at specific points along a line.
- Axis: You can specify either a linear or log axis type, specify the axis scale, and customize tic marks.
- Legend: You can add titles to the plot legend and specify whether the legend appears below or to the right of the plot.
All Plots
You can customize all the plots for an entire watershed. From the Plot window, from the Edit menu, there are two commands - Default Line Styles and Default Plot Properties. These commands will allow you to customize all new plot windows that will be accessed for a watershed.
Default Line Style Options
The Default Line Style Options dialog (Figure 2) is for adjusting the curves (lines) in all of your plots.
It allows you to add curve (line) types, change the color and fill of the curves (lines), and add labels for the curves (lines) for all plots. For more detailed information on Default Line Style Options dialog, refer to the HEC-DSSVue User's Manual. 
From the Line tab (Figure 2) you can set the color, style, and weight for your curves (lines) in all plots. If the curves have points, you can also set the style, color, and fill color for the points on your curves in all plots.
From the Default Line Style Options dialog (Figure 2) you can also add labels to the curves and adjust the position of the label (Label tab) for all plots. You can manually adjust the maximum and minimum values for your X-axis, set viewport weight, and reverse the X-axis (Defaults tab) for certain curve types such as Precip.
Default Plot Properties
The Default Plot Properties dialog (Figure 3) allows you to configure the other properties of your plots. The tabs for this dialog allow you to make adjustment to the viewport, add a title for all plots, adjust grids, labels, axes, marker lines, and legend, change the color of the panel background, change the layout of the legend, and adjust the size of the spacer.

To add a title for all plots:
- Open a Plot window.
- From the Edit menu, click Default Plot Properties.
- The Default Plot Properties dialog (Figure 3) opens.
- Select the Title tab (Figure 4).

- To add a title, click Show Plot Title. In the Text field enter a title that will appear on all of the plots in the watershed. You can align the title, adjust the font size, add a border with color, and add a color background to the title.
- Click Apply, and the title will appear on all plots.
- Click OK, and the Default Plot Properties dialog closes.
To change the panel background color for all plots:
- Open a Plot window.
- From the Edit menu, click Default Plot Properties.
- The Default Plot Properties dialog (Figure 3) opens.
- Select the Layout tab (Figure 5).

- To change the panel background color of the plot, from the Panel Background Color list, select a color.
- Click Apply, and the new color will appear in the background panels for all the plots.
- Click OK, and the Default Plot Properties dialog closes.
Individual Plots
To customize individual plots that you are displaying (Plot window) you can use two dialogs, or you can use shortcut menus to make changes through individual editors. The dialogs include Plot Properties accessible from the Edit menu and Select Plot Variables accessible from the Plot menu.
Individual Plot Properties
The Plot Properties dialog (Figure 6) allows you to configure multiple display properties of an individual plot. This includes the border and background patterns of the viewport; add a title to the plot; adjust the gridlines of the plot; edit the titles, tic marks, and scale of an axis; adjust the style, add points, and add quality symbols for curves; adjust the color, add labels, and position of marker lines; add a title, icon, and move the legend; change the color of the panel background; adjust the layout of the legend; and the size of the spacer.
To change the gridlines of an individual plot:
- Open a Plot window.
- From the Edit menu, click Plot Properties.
- The Plot Properties dialog (Figure 6) opens.
- The Title Bar displays the name of the location that data is being plotted.
- If your plot has multiple viewports, the Select Viewport list displays the viewport where your editing is taking place.
- Choose the Viewport tab (Figure 7).
- From the Major X Grid panel, click Draw Major X Grid. Select from the Color, Style, and Weight drop-down lists to modify the major X-axis gridline properties. Also, you can modify the Minor X Grid by clicking the Draw Minor X Grid and modifying the minor X-axis gridlines properties
- From the Major Y Grid panel, click Draw Major Y Grid. Select from the Color, Style, and Weight drop-down lists to modify the major Y-axis gridline properties. Also, you can modify the Minor Y Grid by clicking the Draw Minor Y Grid and modifying the minor Y-axis gridlines properties.
- Click Apply, and the color, style, and weight changes you made will reflect on the gridlines of your plot.
- Click OK, and the Plot Properties dialog (Figure 7) closes.
Select Plot Variables
The Select Plot Variables dialog (Figure 8) allows you to customize the layout of an individual plot. You can add and remove axes, arrange the order of viewports, add and remove viewports, and set the weight of viewports. The plot components are displayed in a tree structure.
To add a viewport to an individual plot:
- Open a Plot window.
- From the Plot menu, click Select Variables.
- The Select Plot Variables dialog (Figure 8) opens.
- From Edit menu, click Add Plot Region, and a new plot region (viewport) is added to the bottom of the Selected
- You now need to add data from the Available Variables tree to your new plot region. Select a curve from Available Variables tree and click Add.
- In this example (Figure 9), Zone Storage is added to the Reservoir tree from the Available Variables by selecting Plot Region 3 in the Selected tree and clicking Add.
- Click Apply, and the plot region displays the curve that was added.
- Click OK, and the Select Plot Variables dialog (Figure 9) closes, and your plot will display the changes that were made.
Shortcut Menus
When you want to edit a specific property of a plot without using the Individual Plot Properties dialog (Figure 6), you can use individual plot property dialogs instead. To access these dialogs, select the Pointer/Select tool, right-click the element of the Plot window (Figure 1) that you want to edit, and from the shortcut menu that appears, click Edit Properties.
Edit Title Properties
To add a title to an individual plot:
- Right-click the Plot window where the title is (or will be) displayed (Figure 10).
- From the shortcut menu, click Edit Properties.
- The Edit Title Properties dialog (Figure 11) opens.
- Check Show Plot Title, and in the Text field, enter the title for the individual plot. From this dialog you can also set the alignment, the size of the font, and add a border and background colors to the title.
- Click Apply, and the title is displayed on the plot.
- Click OK, and the Edit Title Properties dialog (Figure 11) closes.
Edit Marker Lines Properties
To edit the marker lines of an individual plot:
- Right-click the Plot window where the marker line is (or will be) displayed (Figure 12).
- From the shortcut menu, click Edit Properties.
- The Edit Marker Line Properties dialog (Figure 13) opens.
- To change the style of the marker line, you need to click the Draw Line You can change the color, style, and weight of the marker line. You can also add fill if you wish.
- If you want to add a label to the marker line, click the Draw Label You can add a label, the alignment of the label, and the placement of the label along the marker line.
- If your plot has more than one viewport, you will have to set marker line properties for each viewport.
- Click Apply, and the changes to the marker line are displayed on the plot.
- Click OK, and the Edit Marker Line Properties dialog (Figure 13) closes.
Edit Curve Properties
To edit the curves of an individual plot:
- Right-click on the curve in the Plot window (Figure 14).
- From the shortcut menu, click Edit Properties.
- The Edit Curve Properties dialog (Figure 15) opens.
- To change the style of the curve, select the Style You can change the color, style, and weight of the curve. You can also add fill below or above the curve if you wish.
- If you want to display the quality of the data that the curve represents, select the Quality Symbols tab, and click the Draw Quality Symbols Then, set the symbol color and size for each type of quality.
- If your plot has more than one curve, you will need to edit properties for each curve individually.
- If your plot has more than one viewport, you will have to set curve properties for each viewport.
- Click Apply, and the changes to the marker line are displayed on the plot.
- Click OK, and the Edit Curve Properties dialog (Figure 15) closes.
To add a callout to a curve of an individual plot:
- Right-click the Plot window where a curve is displayed (Figure 14).
- From the shortcut menu, click Add Callout.
- The Add Callout dialog (Figure 16) opens.
- Enter the callout you want in the Callout Text
- Click Apply, and the changes to the marker line are displayed on the plot.
- Click OK, the new callout is displayed on the plot, and the Add Callout Dialog (Figure 16) closes.
Edit Axis Title Properties
To edit the appearance of axis titles for an individual plot:
- Right-click the Plot window where the axis title is displayed (Figure 17).
- From the shortcut menu, click Edit Properties.
- The Edit Axis Properties dialog (Figure 18) opens.
- To give an axis title a border, click the Axis Label In the Border panel, click Draw Border. You can set the color, style, and weight of the border around the axis title.
- To give an axis title a background color, in the Background panel, click Draw Background. You can set the color and the pattern of the background for the axis title.
- Click Apply, and the axis title is displayed with your changes.
- Click OK, and the Edit Axis Properties dialog (Figure 18) closes.
Edit Spacer Properties
To edit the spacer properties for an individual plot:
- Right-click the Plot window where the spacer is (Figure 19) located on the plot. Spacers are between viewports, on either side of each viewport, and at the top of the plot.
- From the shortcut menu, click Edit Properties.
- The Edit Spacer Properties dialog will open (Figure 20).
- Enter the size of the spacer in pixels in the Size in Pixels
- Click Apply, and the changes you made to the spacer will appear on the plot.
- Click OK, and the Edit Spacer Properties dialog (Figure 20) will close.
Edit Viewport Properties
To edit the viewports of an individual plot:
- Right-click in the Plot window where a viewport is displayed (Figure 21).
- From the shortcut menu, click Edit Properties.
- The Edit Viewport Properties dialog (Figure 22) opens.
- To change the viewport border’s color, pattern or transparency click Draw Border under the Border
- To change the viewport background’s color, pattern or transparency click Draw Background under the Background
- If you want to change the color, style, or weight of the gridlines of the viewport, click the Draw Major X Grid, Draw Major Y Grid, Draw Minor X Grid, or Minor Y Grid checkboxes under the grid section.
- If your plot has more than one viewport, you will have to set curve properties for each viewport.
- Click Apply, and the changes to the viewport are displayed on the plot.
- Click OK, and the Edit Viewport Properties dialog (Figure 22) closes.
Edit Axis Tics Properties
To edit the X-axis scale of an individual plot:
- Right-click in the Plot window where the X-axis is displayed (Figure 23).
- From the shortcut menu, click Edit Properties.
- The Edit Axis Properties dialog (Figure 24) opens.
- Select the Scale In the select table you can choose to automatically set the maximum, minimum, view maximum, view minimum, and view range. Also, you can set the number of label levels and reverse the X-axis.
- To change the tic marks of the X-axis, select the Tics You can add minor tic marks, do minor tic marks only, and change the color of the tic mark and tic mark label.
- If your plot has more than one viewport, you will have to set axis tics properties for each viewport.
- Click Apply, and the changes to the X-axis are displayed on the plot.
- Click OK, and the Edit Axis Properties dialog (Figure 24) closes.
Edit Legend Panel Properties
To edit the legend panel of an individual plot:
- Right-click the Plot window where the legend panel is displayed (Figure 25).
- From the shortcut menu, click Edit Properties.
- The Edit Legend Properties dialog (Figure 26) opens.
- You can give the legend panel a title by checking the Draw Legend Title and entering information in the Text
- You can also add icon information to the left and right areas of the legend bock from the Left Block and Right Block For example, if you want a description to display on the left side of the legend panel, click the Left Block tab and enter the description in the Text field.
- To add an icon, you need to enter the path and filename of icon to be display in the Icon panel for either the left or right sides of the Legend
- Click Apply, and the changes to the legend panel are displayed on the plot.
- Click OK, and the Edit Legend Properties dialog (Figure 26) closes.