Working with Plots
Plots provide a graphical representation of your data. From the Plot window (Figure 1) you can view the plot, as well as print, save as a graphics file, and save the properties of the plot to a template to be used by other plots. Following is an overview of the menu bar of the Plot window. The commands available from the menus are:
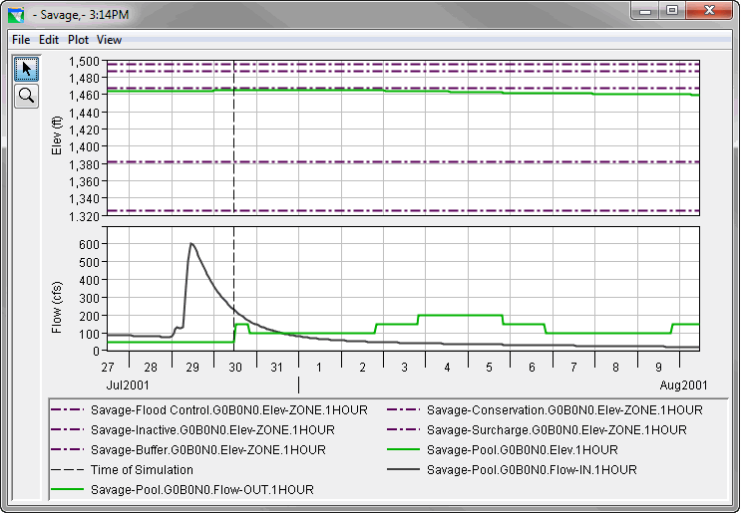
- File: From this menu you can view the plotted data in a tabular format, save the plot as a graphics file, save a template, use a template, and print the plot. Available commands are: Tabulate, Save As, Save Template, Apply Template, Save Specification, Print, Page Setup, Print Preview, Print Multiple, and Close.
- Edit: From this menu you can customize the plot. Available commands are: Plot Properties, Default Line Styles, and Default Plot Properties.
- Plot: From this menu you can select variable to plot, open and save plot type. Available commands are: Select Variables, Open Plot Type, and Save Plot Type.
- View: From this menu you can have the plot window always on top of your desktop, and you can choose to use line styles. Available commands are: Always On Top, Use Line Styles, Zoom to all, Legend Placement, Hide Legend, Refresh, and Live Display.
The Tools appear in a toolbar on the left side of the Plot window (Figure 1). The tools change the appearance of the mouse, as well as the functionality of the mouse:
![]() Pointer/Select Tool. With the Pointer/Select Tool, you can access shortcut menus that allow you to customize features of your plots using the plot editing tools.
Pointer/Select Tool. With the Pointer/Select Tool, you can access shortcut menus that allow you to customize features of your plots using the plot editing tools. ![]() Zoom Tool. The Zoom Tool allows you to view data closely at a specific time. To zoom in, hold the mouse button down and outline the area you want to enlarge. To zoom out, click the right mouse button (right-click). The zoom out is done by a factor of two and positions the clicked location at the center of the display area.
Zoom Tool. The Zoom Tool allows you to view data closely at a specific time. To zoom in, hold the mouse button down and outline the area you want to enlarge. To zoom out, click the right mouse button (right-click). The zoom out is done by a factor of two and positions the clicked location at the center of the display area.
Save As
The Save As command allows you to save your plot to a graphics file. HEC-RTS has four possible formats: Windows Metafile (.wmf), *Postscript (.ps), *JPEG (.jpg, .jpeg), and Portable Network Graphics (*.png).
To create a graphics file:
- On the File menu, click Save As, and the Save browser (Figure 2) opens.
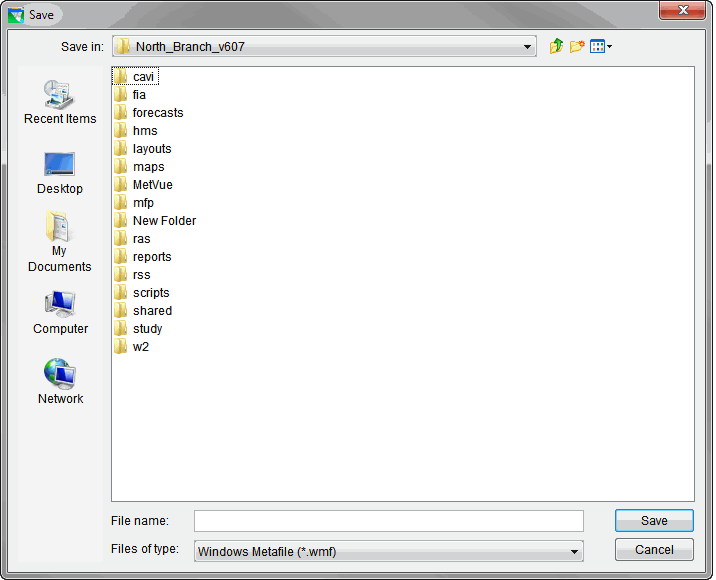
- Select the location you will save your file from the Save in drop-down list.
- Enter a name for the file in the File name field.
- From the Files of type list, select the type of graphics file you wish to create.
- Click Save, and the Save browser closes, and your plot is saved as the selected graphics file type.
Print Commands
The Plot window (Figure 1) provides the user with several different commands to setup the printing process and to print.
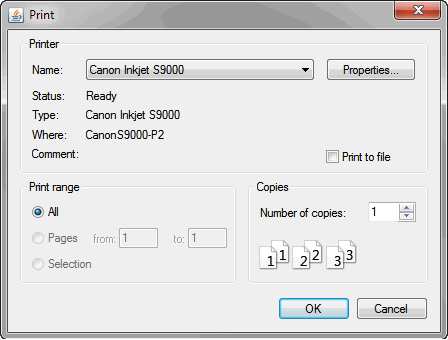
The Print command opens a standard system Print dialog (Figure 3). From the Print dialog you can select the printer, choose to print to a file, and the number of copies to print. Click OK, and the Print dialog closes and the plot will print to the selected printer.
Page Setup
The Page Setup command opens the Page Setup dialog (Figure 4). When using this Page Setup dialog, you can setup the format of the printed page. Following is a list of the available options:
- Orientation: To set the orientation, select Portrait or Landscape from the Orientation panel. By default, the pages are printed in Portrait.
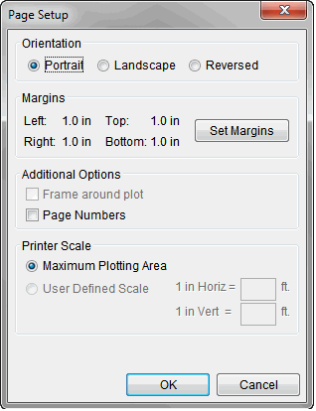
- Margins: The default margin settings are displayed in the Margins panel of the Page Setup dialog. To set the margins, click Set Margins, and the Printer Margins dialog (Figure 5) opens. From the Printer Margins dialog, you can adjust the top, left, bottom, and right margins.
- Additional Options: If you would like page numbers included on your printed page, select the Page Numbers checkbox (Figure 4).
- Printer Scale: The default option is Maximum Plotting Area.
Print Preview
The Print Preview command opens the Print Preview dialog (Figure 6). From the Print Preview dialog, you can view the plot, adjust the scaling of the plot, and print the plot. The Print command automatically prints the plot to the default system printer.

Print Multiple
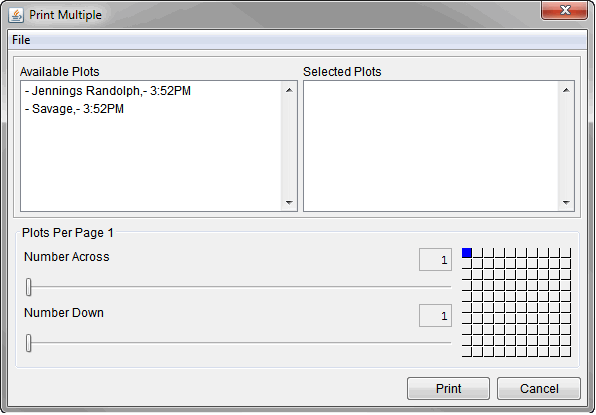
The Print Multiple command opens the Print Multiple dialog (Figure 7). To be able to print multiples plots you must have opened multiple individual plot windows. The opened plots are listed in the Available Plots list of the Print Multiple dialog.
To select plots to be printed on one page, double-click on a plot name in the Available Plots list. The plot name will move to the Selected Plots list. You can adjust the way the plots are arranged on a page, horizontally or vertically. Use the Number Across or Number Down sliders. The grid to the right of the sliders reflects your choices. From the File menu, the Page Setup and Print Preview commands are available.
