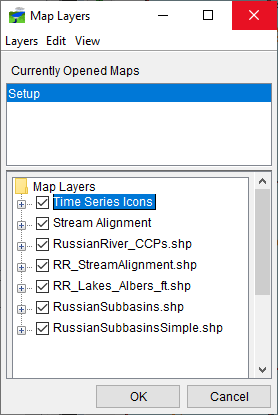
This chapter describes the creation, configuration, and management of time series icons layers. When you create a new watershed, a default layer called Time Series Icons (Figure 1) is created. This layer includes all time series icons that you define for your watershed.

You can create additional time series icons layers to separate time series icons by data type. For example, a gage may report stage and precipitation (and compute flow from stage). You can create layers for each of these data types and name them, for example, Stage, Flow, and Precip. Creating additional layers allows you to focus on the specific data type you wish to see.