HEC-ResSim Results
HEC-ResSim may be used in HEC-RTS to simulate operation of a watershed, given inflow and local flow forecasts from HEC-HMS. There are several reports available from HEC-ResSim for the HEC-ResSim model alternative, and for HEC-ResSim model elements. From an HEC-ResSim model alternative you have a series of summary results reports (i.e., reservoir, flow, power, etc.). At HEC-ResSim model elements (i.e., reach, junctions, reservoirs), you can review plots of gage information; plots of inflow/outflow information; plots that provide information on power, releases, and operations at reservoir model elements; and a release decision report.
Release Decision Report
The Release Decision Report provides the decision information that HEC- ResSim reached which are decisions based on operational rules and physical constraints defined in the HEC-ResSim watershed model. In addition, the report displays the forecast run name, forecast run name and the time window information.
To view the Release Decision Report:
- You must be in the Modeling tab in the Watershed Pane.
- To view this report make sure you have an active forecast, and at least one forecast run selected (checkbox) for viewing results (Figure 2).

- On the Forecast panel, select the HEC-ResSim alternative you want to see data for and choose Release Decision Report from the Reports tab (Figure 2) and the Release Decision Report (Figure 1) opens.
- You can view a different reservoir's report or change the time window for the information being displayed. On the Options menu, choose Edit Options, and the Release Decision Report Options dialog (Figure 3) opens. You can change the reservoir by using the Reservoir drop-down list. You can also specify a different time window by selecting the Specify option and enter the start and end dates.

- From the File menu, you can print the report.
- From the File menu, click Close, and the Release Decision Report closes.
Release Summary Reports
The results summary reports provide information for reservoirs, flow locations, hydropower facilities, and gates. Each report displays the average, maximum, and minimum values.
Reservoir Summary Report
This report summarizes the reservoirs for the active forecast run. These results include the storage, elevation, controlled release, and uncontrolled spill parameters for each reservoir. Reported are the average, maximum, minimum values for each parameter.
To view the Reservoir Summary Report:
- You must be in the Modeling tab in the Watershed Pane.
- To view this report make sure you have an active forecast, and at least one forecast run selected (checkbox) for viewing results (Figure 2).
- On the Forecast panel, select the HEC-ResSim alternative you want to see data for. From the Reports tab, click Reservoir Summary and the Reservoir Summary Report (Figure 4) opens.
- From the File menu, you can print the report.
- From the File menu, click Close, and the Reservoir Summary Report (Figure 4) closes.

Flow Summary Report
This report summarizes the flow at reservoirs and non-reservoir locations for the active forecast run. These results include the regulated flow, unregulated flow, and cumulative local flow for each location. Reported are the average, maximum, minimum values for each parameter.
To view the Flow Summary Report:
- You must be in the Modeling tab in the Watershed Pane.
- To view this report make sure you have an active forecast, and at least one forecast run selected (checkbox) for viewing results (Figure 2).
- On the Forecast panel, select the HEC-ResSim alternative you want to see data for. From the Reports tab, click Flow Summary and the Flow Summary Report (Figure 5) opens.
- From the File menu, you can print the report. From the File menu, click Close, and the Flow Summary Report (Figure 5) closes.

Stage Summary Report
This report summarizes the stage at reservoirs and non-reservoir locations for the active forecast run. These results include the regulated stage, unregulated stage, and cumulative local stage for each location. Reported are the average, maximum, minimum values for each parameter. If the appropriate data has not been entered (rating curves) this report will be blank.
- You must be in the Modeling tab in the Watershed Pane.
- To view this report make sure you have an active forecast, and at least one forecast run selected (checkbox) for viewing results (Figure 2).
- On the Forecast panel, select the HEC-ResSim alternative you want to see data for. From the Reports tab, click Stage Summary, and the Stage Summary Report (Figure 6) opens.

- From the File menu, you can print the report. From the File menu, click Close, and the Stage Summary Report (Figure 6) closes.
Power Summary Report
This report summarizes the hydropower information at a reservoir for the active forecast run. These results include generation efficiency, power head, hydraulic losses, energy generated per time step, power generated, plant factor, and flow power for each power plant. Reported are the average, maximum, minimum values for each parameter. If the appropriate data (hydropower plant) has not been entered this report will be blank:
- You must be in the Modeling tab in the Watershed Pane.
- To view this report make sure you have an active forecast, and at least one forecast run selected (checkbox) for viewing results (Figure 2).
- On the Forecast panel, select the HEC-ResSim alternative you want to see data for. From the Reports tab, click Power Summary, and the Power Summary Report (Figure 7) opens.

- From the File Menu, you can print the report. From the File menu, click Close, and the Power Summary Report (Figure 7) closes.
Gate Summary Report
This report summarizes the gates defined for the reservoirs in the active forecast run. Reported is the average, maximum, minimum value for the gate opening at each reservoir where a gate has been defined. To view the Gate Summary Report (if the appropriate data has not been entered this report will be blank):
- You must be in the Modeling tab in the Watershed Pane.
- To view this report make sure you have an active forecast, and at least one forecast run selected (checkbox) for viewing results (Figure 2).
- On the Forecast panel, select the HEC-ResSim alternative you want to see data for. From the Reports tab, click Gate Summary, and the Gate Summary Report (Figure 8) opens.

- From the File menu, you can print. On the File menu, click Close, and the Gate Summary Report (Figure 8) closes.
Recomputing Forecast Runs
From the Modeling Module, the graphical results for HEC-ResSim are available from the network components for the active forecast run that includes a HEC- ResSim model alternative. These network components are reservoirs, diverted outlets, routing reaches, junctions, and diversions.
Reservoirs
To view the graphical results from a HEC-ResSim reservoir:
- You must be in the Modeling tab in the Watershed Pane.
- To view this report make sure you have an active forecast, and at least one forecast run selected (checkbox) for viewing results (Figure 2).
- On the Map window, select the Zoom Tool and zoom-in on an area where there is a HEC-ResSim reservoir, an example is shown in Figure 9.

- Then select the Pointer Tool, right-click the HEC-ResSim reservoir, the polygon and storage reach which will now be highlighted in yellow. From the shortcut menu (Figure 9), click one of the available options.
- If the active forecast run contains HEC-RAS and/or HEC-FIA model alternatives and their results overlap the HEC-ResSim results, the shortcut menu will reflect this. Therefore, the shortcut menu could contain items for HEC-RAS and HEC-FIA.
- Depending on which command you clicked on from the short cut menu (Figure 9) the appropriate Plot dialog will open. In Figure 10, you can see the different Dialogs associated with the appropriate shortcut menu item.
- You can print, save as a graphic file, and view tabular data of the plot from the File menu. See Plots for details on how you can manipulate plots available in CWMS.
- Also, from the shortcut menu (Figure 9) you can view the Release Decision Report (Figure 1).
- User Plots are available from the shortcut menu, but these plots are defined beforehand. User Plots are discussed further in this section below, and more detail is provided in the HEC-ResSim User's Manual.

Routing Reaches
To view the graphical results from a HEC-ResSim routing reach:
- You must be in the Modeling tab in the Watershed Pane.
- To view this plot make sure you have an active forecast, and at least one forecast run selected (checkbox) for viewing results (Figure 2).
- In the Map window, select the Zoom Tool and zoom-in on an area where there is a HEC-ResSim routing reach (blue line).
- Then select the Pointer Tool, right-click on the HEC-ResSim routing reach, it will now be highlighted in yellow. From the Routing Reach Shortcut (Figure 11), click Plot.

- If the active forecast run contains HEC-RAS and/or HEC-FIA model alternatives and their results overlap the HEC-ResSim results, the shortcut menu will reflect this. Therefore, the shortcut menu could contain items for HEC-RAS and HEC-FIA.
- The Plot dialog window (Figure 12) opens, displaying the graphical results for the routing reach.
- You can print, save as a graphic file, and view tabular data of the plot from the File menu. See Plots for details on how you can manipulate plots available in CWMS.
- User Plots are available from the shortcut menu, but these plots are defined beforehand. User Plots are discussed further in this section below, and more detail is provided in the HEC-ResSim User's Manual.
Diverted Outlets
To view the graphical results from a HEC-ResSim diverted outlet:
- You must be in the Modeling tab in the Watershed Pane.
- To view this plot make sure you have an active forecast, and at least one forecast run selected (checkbox) for viewing results (Figure 2).
- On the Map window, select the Zoom Tool and zoom-in on an area where there is a HEC-ResSim diverted outlet (line leaving a reservoir pool with an arrowhead); an example is shown in Figure 13.
- Then select the Pointer Tool, right-click on the HEC-ResSim diverted outlet, it will now be highlighted in yellow. From the shortcut menu (Figure 13), click Plot.
- If the active forecast run contains HEC-RAS and/or HEC-FIA model alternatives and their results overlap the HEC-ResSim results, the shortcut menu will reflect this. Therefore, the shortcut menu could contain items for HEC-RAS and HEC-FIA.
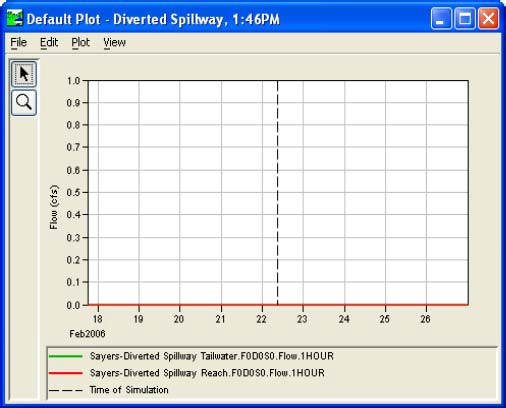
- The Default Plot dialog window (Figure 14) will open, displaying the graphical results for the diverted outlet.
- You can print, save as a graphic file, and view tabular data of the plot from the File menu. See Plots for details on how you can manipulate plots available in CWMS.
 \
\ - User Plots are available from the shortcut menu, but these plots are defined beforehand. User Plots are discussed further in this below, and more detail is provided in the HEC-ResSim User's Manual.
Junctions
To view the graphical results from a HEC-ResSim junction:
- You must be in the Modeling tab in the Watershed Pane.
- To view the available junction plots, make sure you have an active forecast, and at least one forecast run selected (checkbox) for viewing results (Figure 2).
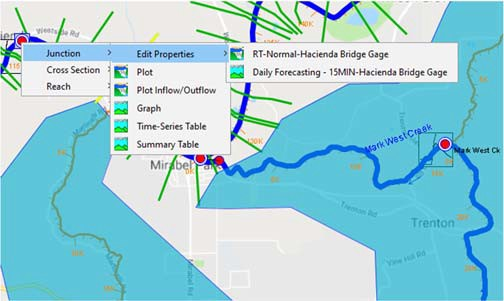
- On the Map window, select the Zoom Tool and zoom-in on an area where there is a HEC-ResSim junction, an example is shown in Figure 15.
- Then select the Pointer Tool, right-click on the HEC-ResSim junction, it will now be highlighted in yellow. From the shortcut menu (Figure 15), click Plot or Plot Inflow/Outflow.
- If the active forecast run contains HEC-RAS and/or HEC-FIA model alternatives and their results overlap the HEC-ResSim results, the shortcut menu will reflect this. Therefore, the shortcut menu could contain items for HEC-RAS and HEC-FIA.
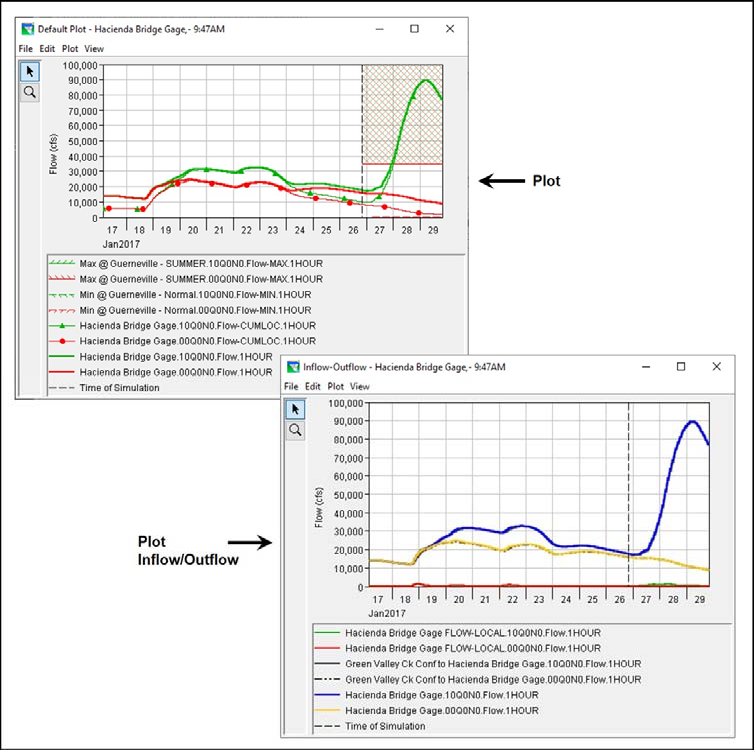
- Click a menu item shortcut menu (Figure 15) and the appropriate Plot dialog (Figure 16) opens. In Figure 16, you can see the different Plot Dialogs associated with the appropriate shortcut menu item.
- You can print, save as a graphic file, and view tabular data of the plot from the File menu. See Plots for details on how you can manipulate plots available in CWMS.
- User Plots are available from the shortcut menu, but these plots are defined beforehand. User Plots are discussed further in section below, and more detail is provided in the HEC-ResSim User's Manual.
Plots
User-defined plots are only available from a HEC-ResSim model alternative, and therefore are only for HEC-ResSim results. User-defined plots are created from any default HEC-ResSim plot.
To create a user-define plot:
- From the Plot Properties dialog (Figure 17) for a junction, remove the Flow-CUMLOC curve. The plot now only contains the Flow for a junction (Figure 18).


- From the File menu, click Save Template. The Export Plot Template dialog (Figure 19) opens.
- You have the choice of making this user-defined plot available to all applications, this watershed only, all user watersheds, or all users. In Figure 18, this user-defined plot will only be available to the watershed that is currently open because This Watershed only has been clicked. Type a name for the user-defined plot in the Name field. In Figure 19 RegulatedFlow has been entered for the name. Click OK, and the Export Plot Template dialog closes.

- To apply a user plot, point to File and click Apply Template.
- For more information about user-defined plots, see the HEC-ResSim User's Manual.
From the Modeling Module, the graphical results for HEC-ResSim are available from the network components for the active forecast run that includes a HEC- ResSim model alternative. These network components are reservoirs, diverted outlets, routing reaches, junctions, and diversions.
Live Display
Enabling the Live Display option causes HEC-ResSim results plots to update automatically when a HEC-ResSim alternative is recomputed. To enable live plots open a HEC-ResSim graphical results plot, and select the Live Display… option from the View menu as shown in Figure 20.
