Customizing Plots
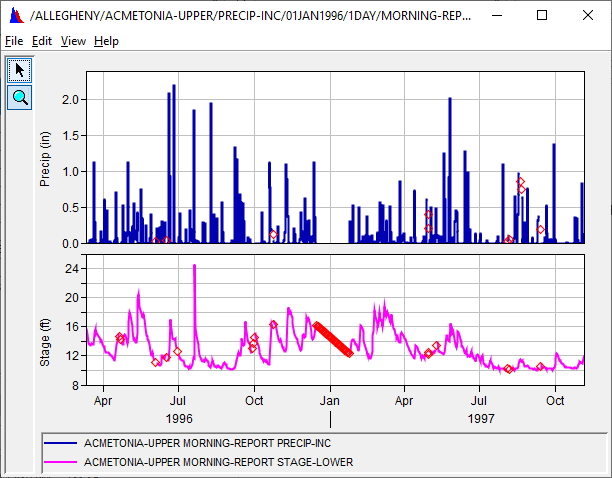
Plots are highly customizable and offer an array of information that will assist you with reviewing your data. A sample plot is shown below.

With the Pointer Tool , you can access shortcut menus that allow you to customize features of your plots using the plot window's editing tools. The following sections discuss these tools in detail.

The Zoom Tool allows you to "zoom in" and view data more precisely at smaller time intervals. To zoom in, first select the Zoom Tool, then hold the left mouse button down and pull down to the right forming a square around the area you wish to zoom in to. The plot will redraw, magnifying the area in the square when the mouse key is released. Right-click to zoom out or from the View menu, click Zoom to all.
If you wish to keep the plot window on top of all open windows on your desktop, from the View menu, click Always on Top, a check mark indicates this option is active.