Entering Data Manually
Time series data, paired data and text data can be manually entered using the Manual Data Entry Editors available from the Data Entry menu. The following sections discuss all options in detail.
Entering Time Series Data Manually
To enter time series data manually:
1. From the Data Entry menu, click Manual Time Series. The Time Series Data Entry dialog box will open:
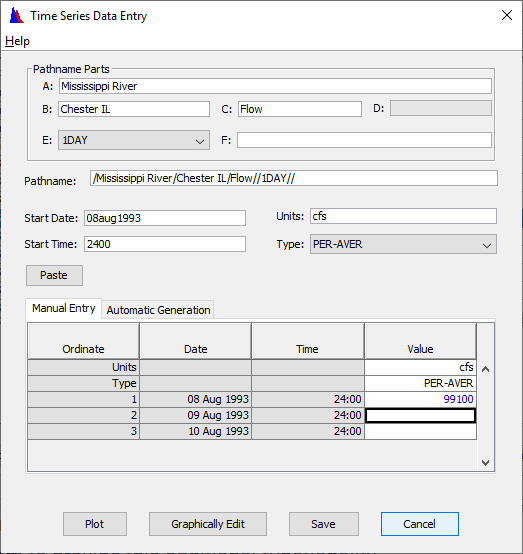
2. Type the Pathname Parts into the A, B, C, and F boxes, then select the appropriate time interval for the E box. The complete pathname will automatically appear in the Pathname box. Alternatively, you can enter the pathname into the Pathname box
and the parts will appear in the Pathname Parts boxes. You cannot enter the "D" (date) part, as this is set according to your Start Date.
3. Enter the Start Date (e.g., 25Mar2002) and Start Time (e.g., 1400).
4. Enter the Units (e.g., CFS).
5. From the Type list, select a data type. Options are PER-AVER, PER-CUM, INST-VAL, and INST-CUM.
6. For regular interval time series data, the Date/Time cells in the table will fill automatically, starting with the start date and time you entered. For irregular interval data, you will need to enter a date and time for each data value.
7. Type the data values into the Value column.
8. To view the data in plot form, click Plot.
9. To graphically edit the data you have entered, click Graphically Edit.
10. To save the new time series record, click Save.
You can paste data on the clipboard from another application by clicking Paste. This allows you to copy data from various applications like Microsoft Excel into HEC-DSS. When you paste data into HEC-DSS, the tab characters and carriage return characters in the program that you are copying from must match the data entry table. Tab characters move to the next column to the right, while carriage return characters move to the next row down. These are the default characters used in Excel.
For regular interval time series data, the data must be in a columnar format (e.g., a column from Microsoft Excel) and should contain data values only. For irregular interval data, the date and time must precede each data value, with tab characters separating them. For paired data, all values for each ordinate must be separated by a tab character.
To enter data using the paste capability:
1.Complete steps 1 through 5 above.
2.Select your data set from the other applications and Copy it to the clipboard.
3.Click Paste, you should see the data from the clipboard appear in the table.
You can also automatically generate regular-interval time series data. This will fill in a single number for a time window. To generate this data:
1.Complete steps 1 through 5 above.
2. Select the Automatic Generation tab.
3. Enter the End Date and End Time for the data.
4. Enter the Fill Value, which is the single value for the specified time window.
5.Click Generate, this will return you to the Manual Entry tab, where you can plot, save, or further edit the data.
Entering Paired Data Manually
To enter paired data manually:
1. From the Data Entry menu, click Manual Paired Data. The Manual Paired Data Entry dialog box dialog box will open:
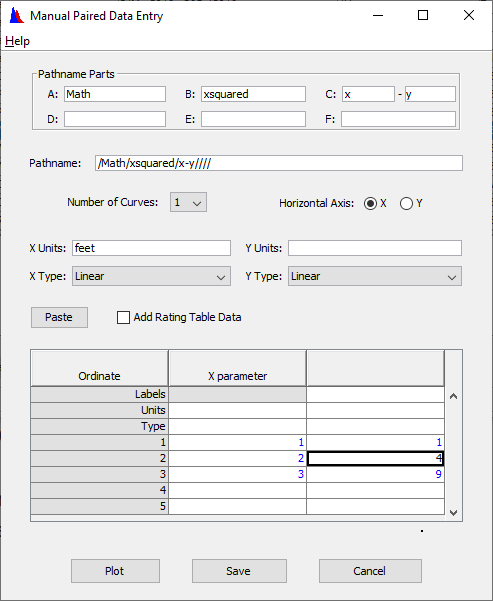
2. Type the Pathname Parts into the A, B, C, D, E, and F boxes. The complete pathname will automatically appear in the Pathname box. You can also enter the pathname into the Pathname box; the parts will appear in the Pathname Parts boxes. Be sure the "C" part contains both an X parameter and a Y parameter, separated by a hyphen (e.g., STAGE-FLOW or ELEV-DAMAGE).
3. From the Number of Curves list select the number of curves to be entered. Also, from Horizontal Axis, select X or Y.
4. In the X Units box, enter the units for X (belonging to the first parameter) and in the Y Units box, enter the units for Y (belonging to the second parameter).
5. From the X Type and Y Type lists, select the type for the respective parameters. Available options are Linear, Log, and Probability.
6. In the table, the Y parameter columns will split into individual columns according to the number of curves you specified.
7. Enter the data values into the X parameter and Y parameter columns.
8. To view the data in plot form, click Plot.
9. To save the new time series record, click Save.
You can paste data on the clipboard from another application by clicking Paste. This allows you to copy data from various applications like Microsoft Excel into HEC-DSS. When you paste data into HEC-DSS, the tab characters and carriage return characters in the program that you are copying from must match the data entry table. Tab characters move to the next column to the right, while carriage return characters move to the next row down. These are the default characters used in Excel. For paired data, all values for each ordinate must be separated by a tab character with a carriage return character at the end of each row. To enter data using the paste capability:
1.Complete steps 1 through 6 above.
2.Select your data set from the other applications and Copy it to the clipboard.
3.Click Paste, you should see the data from the clipboard appear in the table.
Manual Text Entry
HEC-DSS has a text convention format. You can enter data by manual text data entry and type or paste text into the text editor, or you can import a text file. You cannot import text files into the HEC-DSS text format by dragging and dropping a .txt file; this will save a .txt file in the generic file format.
To enter text data manually:
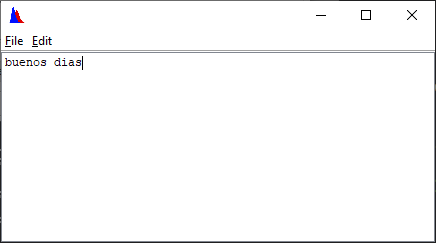
1. From the Data Entry menu, click Manual Text. A dialog box will open.
2. Type or paste the text data into the text dialog box. You can change the font, but the font will not be stored with the text.
3. After the text has been entered, click Save As to save the data to a DSS file.
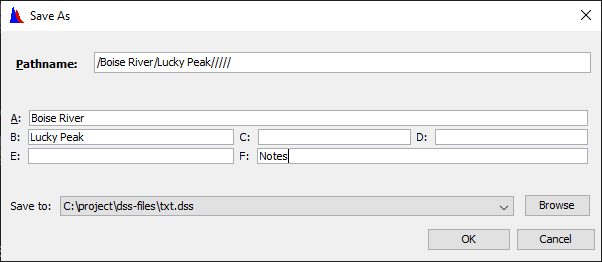
4. Enter the Pathname Parts into the A, B, C, D, E, and F boxes. The complete pathname will automatically appear in the Pathname box. You can also enter the pathname into the Pathname box; the parts will appear in the Pathname Parts boxes
5.To save the record, click OK.