Viewing Tabular Data
An example table produced using HEC-DSSVue is shown below. Tables allow you to view and edit HEC-DSS data in a vertical scrolling window that shows the ordinate (starting from the start date/time), the date and time stamp, and the values for the selected data sets. From the File menu of a table dialog box. You can view the tabular data in plot format by clicking Plot. Respectively, you can tabulate data displayed in a plot dialog box, from the File menu, click Tabulate.

Accessing Tables
To access tables, first select the pathnames of the records you wish to view. There are several ways to select pathnames:
- Double-click on an individual pathname in the HEC-DSS Pathname list.
- Highlight a pathname in the HEC-DSS Pathname list then click Select. Until you select a pathname, the Select button remains inactive.
- Click and drag your mouse to select a series of pathnames, and then click Select. You can also use Ctrl+click to select multiple, non-consecutive pathnames.
- If you wish to select all of the pathnames, click Select All from the Edit menu.
- If no pathnames are in the selection list, individual pathnames can just be highlighted for quick selection.
- Drag additional datasets from the main screen onto the table to add them to the table.
Once you have selected the pathnames you want to visualize, you can open a table by clicking the Tabulate button from the Tool Bar, or from the Display menu click Tabulate. 
Customizing the Display of Tabular Data
From a tabular data dialog box, from the View menu, you can choose to display commas in numbers by clicking Commas. You can reverse the order of the table by clicking Reverse Order. For time series data, this option will show the latest values first. The date and time of the data can be tabulated in separate columns by clicking Date and Time Separately. To have the dates display the years with four digits, click Date With 4 Digit Years. You can set the precision of decimal places for your data by pointing to Show Decimal Places and then clicking the number of decimal places you wish to display (see below).

You can also change how missing values are displayed by selecting Show Missing As and then by clicking blanks (the default), 901.0, M, or -M.
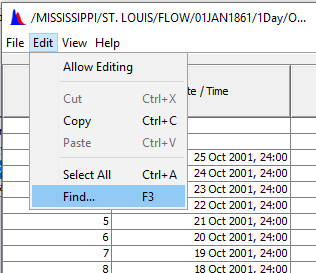
Searching for Values
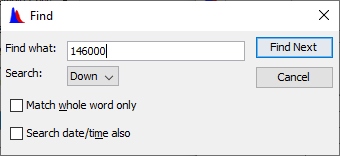
You can search for specific values in your dataset, from a tabulate dialog box, by using the Edit -->Find menu or press the F3 key. Using either option will open the Find dialog box (see below).
In the Find what box (see below, enter the item that you are searching for in your dataset. When you click Find Next, the next value that matches will be highlighted. You can search up from where your cursor is, or search down. You have the option of searching for the exact number or part of that number. You can also search for a date or time.
Comparing Datasets
If you tabulate two or more similar time series data sets, you can compare values from both sets from the table. From a tabulate dialog box (see below), use the Edit menu, and click Compare data sets.

A message will appear displaying the number of values that differ in the selected data sets.

The differences between the two data sets will be highlighted in red, as show below.
