Once the Selected Pathnames List contains all the pathnames you wish to display, you can generate plots and tables.
To create a plot or table from the Display menu, click Plot or Tabulate. You can also click the Plot button or the Tabulate button.


From a plot window, you can also tabulate data using the Tabulate command in the plot's File menu. Likewise, to open a plot from a table, you can use the Plot command in the table's File menu.
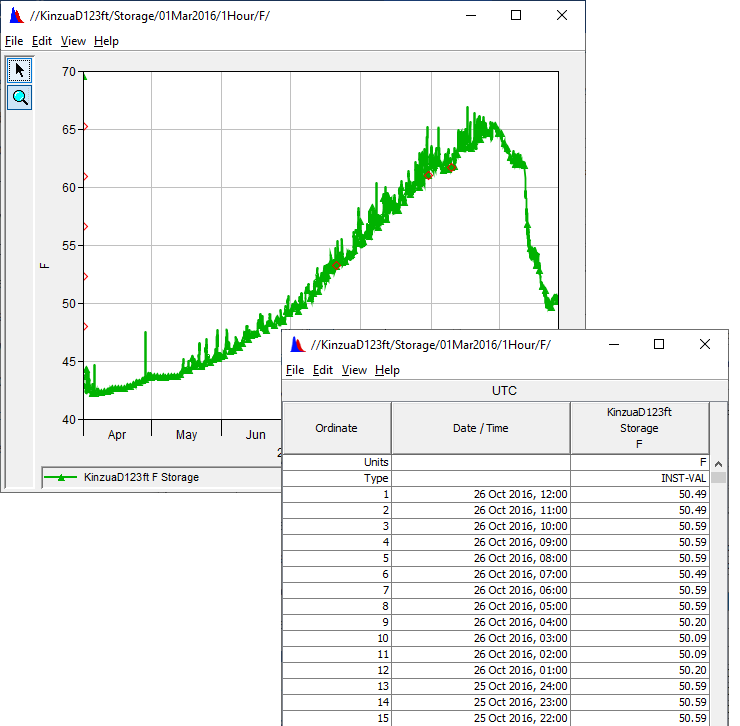
Examples of the plots and tables HEC-DSSVue can produce are shown below:
HEC-DSSVue plots are highly customizable. You can add titles, specify colors and patterns of backgrounds and lines, change line styles, add markers and callouts, add borders to labels, and customize legends, axes, and tic marks. For more information refer to Chapter 6.