Download PDF
Download page New Features (EFM).
New Features (EFM)
| Version | New Features |
|---|---|
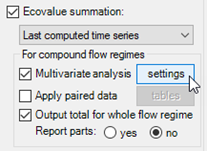
| 6.0.026 | Multivariate Analyses. Inclusion of multivariate analyses is the main new feature in HEC-EFM 6.0. It is an advanced feature that required significant additions to EFM’s computations, data storage, and output visualizations. Multivariate analyses are especially important for EFM applications that map habitat characterized by more than one variable. For example, if an aquatic habitat has criteria for both depth and velocity conditions, EFM 6.0 can be used to apply criteria for both variables independently and to combine those results into a single measure of suitability, which is useful for habitat mapping and when tallying habitat provided. Previous versions of EFM accommodated independent assessments only. In EFM 6.0, multivariate analyses are applied only for compound flow regimes (2-dimensional input). Computations for multivariate analyses are done last during an EFM run because input to multivariate analyses are generated while computing results for individual flow regime-relationship pairings. Multivariate analyses are set up via the EFM Relationships Tab as an option associated with ecovalue summations (Figure 1).
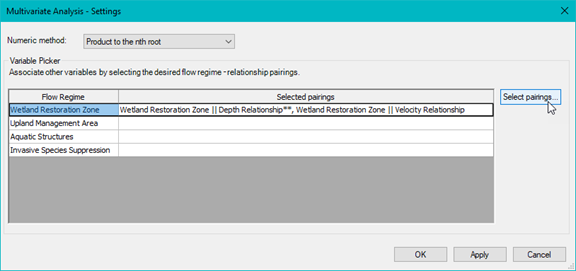
Figure 1. Multivariate analyses are created via the Ecovalue summation feature. Clicking the “settings” button opens an interface that allows users to select the numeric method and flow regime-relationship pairings for the multivariate analyses (Figure 2).
Figure 2. Multivariate analysis entitled “Wetland Restoration Area || Depth Relationship”. Four multivariate analyses could be created for the host “Depth Relationship”, one for each flow regime. Clicking the “Select pairings…” button opens an interface that allows users to select the pairings relevant for the multivariate analysis (Figure 3). Pairings are offered for each combination of (compound) flow regime and relationship (i.e., flow regime || relationship) in the EFM project.
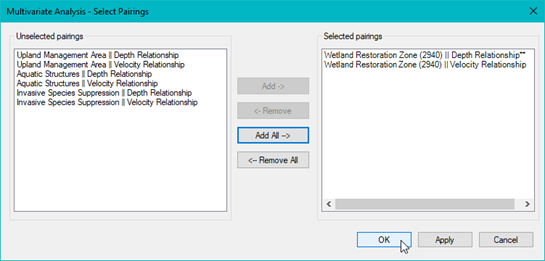
Figure 3. The “Select Pairings” interface allows users to pick which pairings to use in the multivariate analysis. EFM 6.0 offers four numeric methods for multivariate analyses: “Product to the nth root”, “Product”, “Mean”, and “Minimum” (Figure 4). Please note that multivariate analyses in EFM and the associated numeric methods are intended to work with ecovalue time series based on suitabilities between 0 and 1.
Figure 4. Numeric methods for multivariate analyses. For each time step:
Several validations are done to help users create and manage viable multivariate analyses. There are a total of nine. All are applied at run time. The first seven are also applied as multivariate analyses are created to help preempt issues. When an invalid combination is detected, EFM notifies the user and identifies the failed validation. Failed validations for the first seven checks are reported via the “Multivariate Analyses - Select Pairings” interface and at run time. For example, Figure 5 shows a selected pairing that failed validation “6”. The number of parts for the Aquatic Structures flow regime (20,380) is different than the number of parts for the Wetland Restoration Zone flow regime (2,940). Validation 6 checks that the number of parts for selected pairings are equal, which is a simple check intended to flag spatial discrepancies. Invalid selections can be saved, allowing users to continue working with their EFM projects, but will fail at run time.
Figure 5. Failed validations are reported in the Select Pairings interface. Red text is used to highlight problems and includes the failed validation identifier (in this image, “6”). Messages about run time validation fails (for all validations) are provided in EFM output tables and via pop-up windows that can be left open as a reference for users troubleshooting multivariate analyses (Figure 6).
Figure 6. Validations failed at run time are reported in EFM output tables (left) and warning message windows (right). During compute, ecovalue time series for each selected pairing are combined based on the numeric method chosen by the user. Combined ecovalue time series are then tallied in the same progression (see section 3.6.3) as done for other ecovalue summations: 1) daily combined ecovalue series, 2) tally for flow regime, 3) tally status at the end of each season, 4) tally total for flow regime, 5) tally for each season, 6) tally total for each season, and 7) a ranked set of seasonal totals from #6. There is an Apply paired data option that allows the combined ecovalue series to be multiplied by a paired data set prior to tallying. For multivariate analyses, paired data associated with the host flow regime are applied via this option. The most common application of paired data in multivariate analyses is to multiply the combined ecovalue time series (in terms of suitabilities) by area per flow regime part (paired data) to compute time series of suitable habitat (in terms of area). Results of multivariate analyses are stored in HDF and DSS and reported in EFM results tables. All DSS outputs for multivariate analyses are labeled with a c-part that includes “multivariate”. Two style sheets are provided for rendering output tables of multivariate results, “Basic, multivariate only” and “Basic, multivariate only inverted”, the latter of which has flow regimes in rows and relationships in columns and is recommended when rendering multivariate results for numerous flow regimes or flow regime parts. |