Download PDF
Download page Sensitivities.
Sensitivities
Sensitivity Variables work with existing rules in a study. With a sensitivity variable configured for a rule, a replacement value is used in place of a variable for each rule. The replacement value is determined using a cumulative distribution function configured in each sensitivity variable.
Multiple sensitivity variables can be configured for the same rule. But in this case, only the first configured sensitivity variable affects the rule.
Rules that Work with Sensitivity Variables
Sensitivity variables can be configured for the following rules:
- Growth Rules
- Instinctual Rules
- Kill Boost Rules
- Recruitment Rules
- Succession Rules
In future development, sensitivity variables may be configured for additional rules. Control for which variables are affected for each rule may also be developed.
Growth Rules
When sensitivity variables are configured for a growth rule, the random variable is applied to the growth factor for each size class and for each season configured in a growth rule. If the growth factor is an equation, the sensitivity variable does not apply.
Instinctual Rules
Sensitivity variables may be configured for instinctual rules. The random variable is applied to each factor value of the instinctual rule.
Kill Boost Rules
When sensitivity variables are configured for a kill boost rule, the random value replaces the value configured for the Kill Boost Value in the Stress table. The random variable is applied for the Kill Boost values for each size class and for each season.
Recruitment Rules
When sensitivity variables are configured for a recruitment rule, the random value is applied to the condition value configured for the recruitment rule.
Succession Rules
When sensitivity variables are configured for a succession rule, the random value is applied to the conditional value configured for the succession rule.
Sensitivity Variables Tab
Sensitivity variables are configured in the Sensitivity Variables tab in the Logic workspace (Figure).

Figure. The Instinctual Rules interface.
Add: this button loads the Random Variable Wizard to configure sensitivity variables for a rule.
Remove: this button removes a selected sensitivity variable from the study.
Save Variables: this button saves new and edited sensitivity variables in a study.
Active: this column has checkboxes that control whether a sensitivity variable is computed for a rule.
Variable Type: this column details the variable type configured for a sensitivity variable. This column is not editable.
Community: this column details the community of the selected rule for a sensitivity variable. This column is not editable.
Parameter: this column details the rule that the sensitivity variable was configured for. This field displays the combination of the variable type, community, and rule that the sensitivity was configured for following the format of “<Variable Type> - <Community>: <Rule Name>”. This column is not editable.
Distribution: this column details the distribution configured for a sensitivity variable. This column is not editable.
Edit: this column has Edit buttons for each sensitivity variable. Clicking on a button loads the Random Variable Wizard to edit a sensitivity variable.
Random Variable Wizard
The Random Variable Wizard walks through the process of configuring sensitivity variables for rules. This dialog is also loaded when editing an existing sensitivity variable.
There are 3 screens in the Random Variable Wizard.
- Step 1 – Select Variable Type
- Step 2 – Select Rule Parameter
- Step 3 – Select Distribution Parameters
The Variable field is displayed at the top of each screen in the Random Variable Wizard. As a sensitivity variable is configured, more information is added to the Variable field. At the end of the configuration of a sensitivity, this field displays the selected variable type and rule parameter following the format of “<Variable Type>- <Rule Parameter>”. The content of this field is the same as what is displayed under the Parameter column in the Sensitivity Variables tab.
Step 1 is Select Variable Type.
In this screen, the variable type for a sensitivity variable is selected. By default, the Rule Parameter option is selected. This is displayed in the Variable field at the top of the dialog.
Although there are options for Input Time Series and Lookback Value, these are disabled and cannot be selected (Figure).
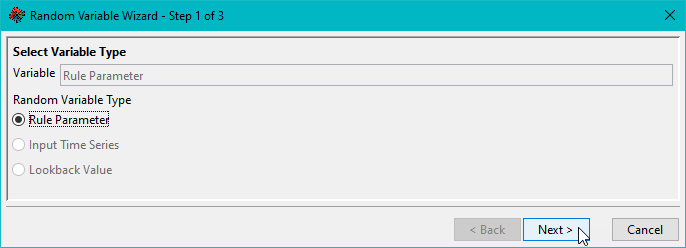
Figure. Rule parameters are the only variables currently available for sensitivity analyses.
Step 2 is Select Rule Parameter.
In this screen, the Rule Parameter is selected from a table of available rules. This table is filtered to rules that a sensitivity variable can be configured for. Other rules are not available in this table.
The Community column lists the community that the corresponding Rule is configured for.
A selected row in the Rule Parameters table is highlighted in blue. This is also appended to the content in the Variable field at the top of the screen. Only one rule may be selected (Figure).
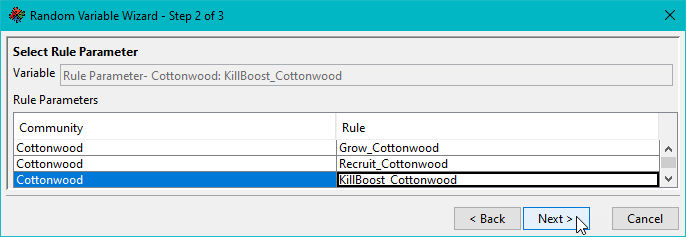
Figure. Rule parameters can be selected for use in sensitivity analyses.
Step 3 is Select Distribution Parameters.
In this screen, the Distribution Type and values for the distribution are configured. Each distribution has unique values that need to be configured.
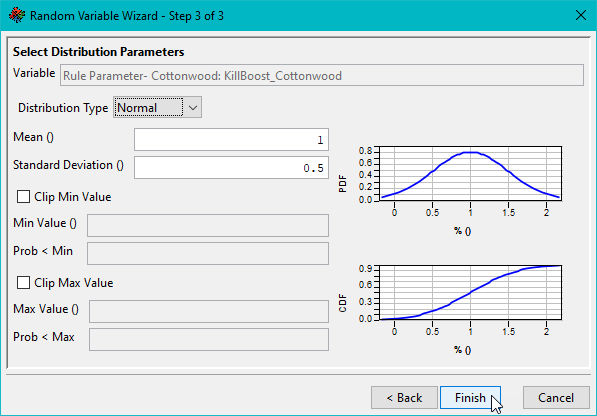
Figure. Selected parameters are assigned distributions for sampling during sensitivity analyses.
- Normal Distribution requires a Mean and a Standard Deviation This is also the distribution type selected by default when adding a new sensitivity variable for a rule.
- Uniform Distribution requires a Left and a Right
- Triangular Distribution requires a Left, a Peak, and a Right
- Log Normal Distribution requires a Mean of Log and a Standard Deviation of Log
The Probability Distribution Function (PDF) and Cumulative Distribution Function (CDF) curves are plotted given the values for a distribution type’s variables.
Controls for clipping the distribution functions are also available in this screen. Checkboxes must be checked to use a minimum or maximum clipping value.
Adding a Sensitivity Variable
To add a sensitivity variable for a rule in the Sensitivity Variables tab:
- Click the Add button in the Sensitivity Variables This loads the Random Variable Wizard.
- In the first screen, confirm that the Rule Parameter option is selected.
- Click the Next This switches to the screen for step 2.
- Select a rule and community to create the sensitivity variable for.
- Click the Next This switches to the screen for step 3.
- Select the Distribution Type.
- Configure the values needed for the selected distribution type.
- Configure whether clipping is applied. If clipping is applied, configure the values for clipping.
- Click the Finish This closes the Random Variable Wizard. A new row is added to the Sensitivity Variables tab.
- Click the Save Variables button to save the updates to the Sensitivity Variables
Editing Sensitivity Variables
The distribution parameters of an existing sensitivity variable can be edited. The selected variable type and rule cannot be edited after creating a sensitivity variable.
Editing a sensitivity variable can be done by clicking the Edit button in the Sensitivity Variables tab. Clicking the Edit button loads Step 3 of the Random Variable Wizard. The Back button is disabled.
To edit an existing sensitivity variable:
- Select the sensitivity variable to edit.
- Click the Edit button for the selected sensitivity variable. This loads the Random Variable Wizard’s Step 3 screen.
- Edit the Distribution Type, if necessary.
- Edit the values for the distribution as needed.
- Edit the clipping values as needed.
- Click the Finish This closes the Random Variable Wizard.
- Click the Save Variables button to save the updates in the Sensitivity Variables
Deleting Sensitivity Variables
An existing sensitivity variable may be deleted from the Sensitivity Variable tab. Because the rule that a sensitivity variable is configured for cannot be edited after creation, this option helps when an existing sensitivity variable was created for a rule but may need to be updated for a different rule.
To delete a sensitivity variable:
- Select a sensitivity variable in the Sensitivity Variable
- Click the Remove This removes the selected sensitivity variable from the Sensitivity Variables tab.
- Click the Save Variables button to save the updates in the Sensitivity Variables
Simulation
Computing Sensitivity Runs
For each sensitivity run, a configured sensitivity variable replaces a variable used in computing the rule that the sensitivity variable is configured for. Identifying which variable is affected per rule was discussed in Rules that Work with Sensitivity Variables.
Each sensitivity variable configured for a rule in the Sensitivity Variable tab of the Logic section has a configured distribution. A cumulative distribution function (CDF) is produced based on the selected distribution type and the values configured for the distribution.
Each run has a sample value, which is between 0 and 1, that is used to compute the inverse value of the cumulative distribution function (CDF). Graphically, the sample value falls on the Y-axis of the CDF curve. The inverse value is the corresponding value on the X-axis given the sample value. The replacement value is computed by multiplying the inverse value to the original value of a variable in the rule that the sensitivity variable is configured for.
The sample value can be determined Evenly or Randomly. This is configured in the Sensitivity Bundle Configuration before computing the sensitivity runs.
When the sample values are determined Evenly, an increment is computed by dividing 1 by the number of runs. Each sample value is an increasing increment. As an example, 5 runs will result in 0.1667. This results in the following sample values (Table).
Table. Assigned sample values based on 5 runs with Evenly spaced samples.
Sensitivity Run Number | Sample Value |
1 | 0.1667 |
2 | 0.3333 |
3 | 0.5000 |
4 | 0.6667 |
5 | 0.8333 |
When the sample values are determined Randomly, the sample values are determined randomly. Unless a Seed value is configured, each computation results in a different set of sample values.
When a Seed value is configured, the same set of randomly determined sample values are used at computation. For example, when the seed value is configured as 5 and there are 5 runs, this always produces the following set of sample values (Table).
Table. Assigned sample values based on 5 runs with Randomly spaced samples.
Sensitivity Run Number | Sample Value |
1 | 0.7305 |
2 | 0.1766 |
3 | 0.0883 |
4 | 0.6118 |
5 | 0.4889 |
Sensitivity Bundle Configuration
Sensitivity variables are not automatically computed when running a compute. To compute the rules with sensitivity variables, the Compute Sensitivity Simulation must be selected from an alternative’s context menu.
When the Compute Sensitivity Simulation is selected from the context menu of an alternative, the Sensitivity Bundle dialog is loaded. In this dialog, a user determines whether to choose sample values evenly or randomly for computing the sensitivity variables. This dialog also controls how many sensitivity runs are computed.
Simulation Output
Output for sensitivity runs is generated similarly to its related standard simulation, except the values are computed using the configured sensitivity variables. The results of the sensitivity runs can be observed in the simulation HDF files and in the Simulation Map.
Specific to sensitivity runs, the sensitivity.xml file is also generated.
Sensitivity XML
After computing sensitivity runs for an alternative, a sensitivity.xml file is generated in the alternative’s folder for the simulation results. The sensitivity.xml file details the configured sensitivity variable, sample values, and which rules are affected.
Each sensitivity.xml file has elements for each sensitivity run. For each run, there is a rule element that details a rule name and separate elements for the values in the rule, the rule type, the sensitivity variable that affects the rule, and a sample value for that run. The following shows the organization of the elements for a run, rules under the run, and elements under each rule.
<Simulation>
<Run>
[Run Number]
<Rule>
[Rule Name]
<Value />
<Type> [Rule type] </Type>
<SensitivityVariable> [Variable] </SensitivityVariable>
<Sample> [Sample value] </Sample>
</Rule>
</Run>
</Simulation>
The element for the Type tag details what type of rule is in the rule element. The following table summarizes the information displayed depending on the rule type (Table).
Table. Rules that can be involved in sensitivity analyses.
Rule Type | Displayed Information |
Growth | Growth |
Instinctual | Instinctual |
Kill Boost | Kill_Boost |
Recruitment | Recruit |
Succession | Succession |
For the elements with the SensitivityVariable tag, there are attributes for the distribution type and values pertinent to that distribution type. This element also details the variable configured in the Sensitivity Variable tab.
The elements with the Sample tag displays the sample value used for the run.
The elements with tags of either Rate, Value, or Condition have attributes for the original and replacement values. The attributes also vary by rule (Table).
Table. Rules and attributes that can be involved in sensitivity analyses.
Rule Type | Element Tag | Attributes |
Growth | Rate | factor, replacement, original |
Instinctual | Not Applied | Not Applied |
Kill Boost | Value | replacement, original |
Recruitment | Condition | factor, replacement, original |
Succession | Condition | replacement, original |
Simulation HDF File
When sensitivity runs are computed, a “sensitivity” folder is generated in the same directory as the “results” folder of a standard run. Under the sensitivity folder, a folder is generated for each sensitivity run. These are labeled by the run number. Under each run’s folder, the simulation HDF file is generated for the sensitivity run. The simulation HDF contains the same tables as a standard run except the values are computed using the sensitivity variables.
Simulation Map
In the Simulation Map, the sensitivity runs can be animated by configuring the Animation Properties to use a sensitivity run instead of a standard run. This allows for multiple simulation maps to display the results for each sensitivity run. While a sensitivity run is displayed in a simulation map, the count, density, and size can be plotted for that run from the map.