Download PDF
Download page Example Study Data.
Example Study Data
The example study data used throughout this manual is from Muncie, Indiana. The hydrologic and hydraulic modeling were built around the White River in Muncie, Indiana in order to make use of a the HEC-RAS Muncie example model. The modeling is not detailed, nor calibrated. The structure inventory was sourced from the National Structure Inventory. The modeling and all example data are not meant to be used in any decision making. A downloadable package of the example data is provided here. The data can be downloaded by clicking the link below. All spatial data sets are in the EPSG: 2965 (NAD83 / Indiana East) coordinate reference system.
Terrain
The Muncie terrain is the same file used by the hydraulic engineers in modeling the existing condition hydraulics. The units of measurement are in feet. The terrain data is used in combination with the hydraulic data to determine flood depths throughout the study area.

Impact Area Set
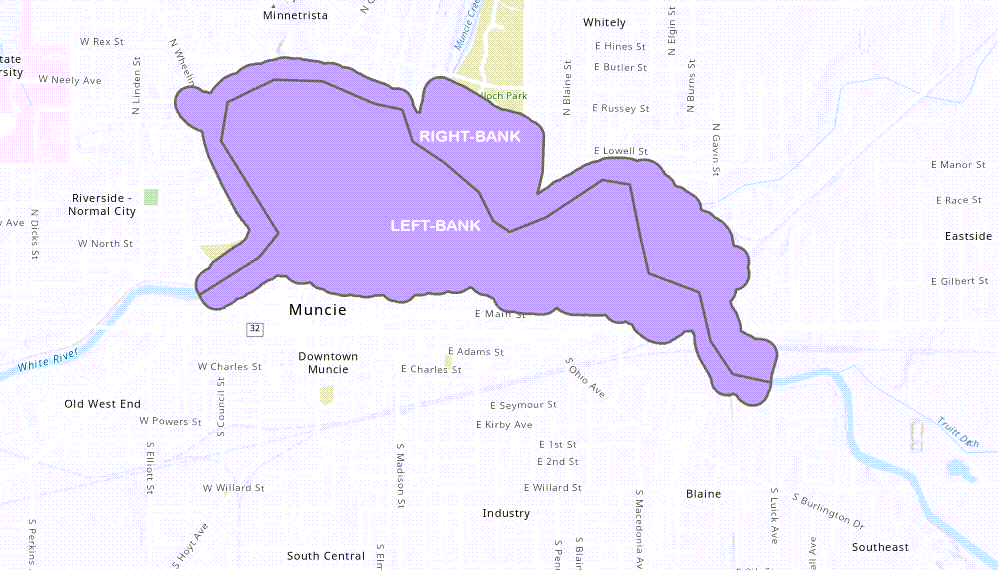
The impact area set consists of two impact areas: Left Bank and Right Bank. HEC-FDA requires the the entire study area to be covered by the impact areas and will not compute damages to structures outside the impact areas.

Hydraulics
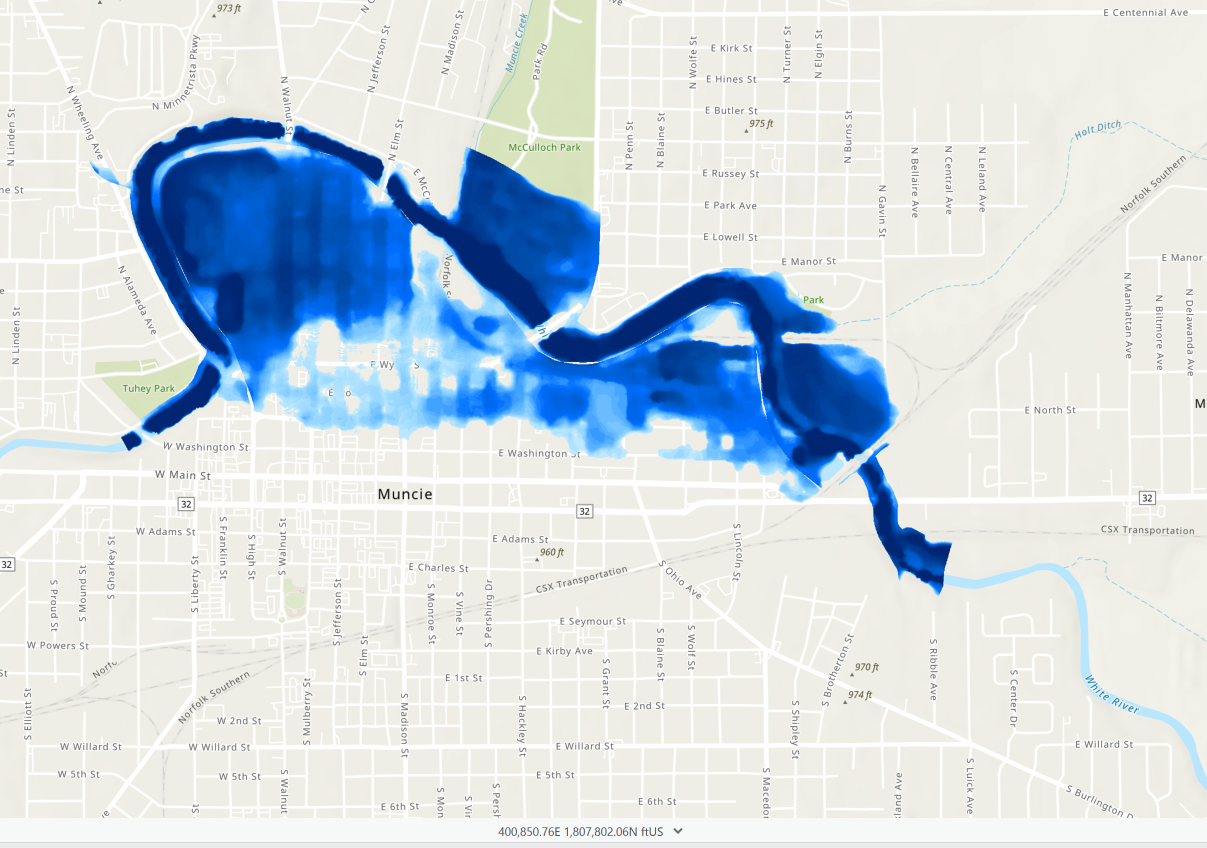
The hydraulic modeling was developed in unsteady-state condition. The native output files have been provided for use within HEC-FDA. The HEC-RAS modeling for the existing conditions (without-project) 2% annual exceedance probability (AEP) event is illustrated in the image below. The hydraulic data is used to determine estimates of flood depths on structures, and therefore the estimates of economic damages.

Hydraulic modeling was also completed for two lateral structures. The first lateral structure is a low levee (top of levee 946 ft) and the second was for a high levee (top of levee 947.5 ft). The steady-state model output files for these two hypothetical levees have also been included in the example study data.
Flow-Frequency
The log-Pearson type 3 (LPIII or LP3) distribution parameters are below for the existing (without-project) conditions and the two with-project conditions (low levee and high levee). The period of record is 48 years. These parameters determine the discharge-frequency relationships, and when combined with the stage-discharge function, can be used to associate stage with AEP.
| Mean | Standard Deviation | Skew |
|---|---|---|
| 3.707 | 0.24 | -0.475 |
Stage-Discharge
Existing (Without-project) Conditions
This stage-discharge function represents the relationship (triangular distribution) between stage and discharge for the without-project condition. This data will be provided by the hydraulic engineer. In combination with the discharge-frequency relationship, this data allows for association of stage with AEP which is ultimately used to calculate damage-frequency.
Loading
Low Levee With-Project Conditions
The stage-discharge function below represents the relationship (triangular distribution) between stage and discharge for the with-levee condition for the low levee (top of levee 946 ft). Observe that some stages are lower for a given discharge than in the without-project condition.
Loading
High Levee With-Project Conditions
The stage-discharge function below represents the relationship (triangular distribution) between stage and discharge for the with-levee condition for the high levee (top of levee 947.5 ft). Observe that some stages are higher for a given discharge than in the without-project condition.
Loading
Regulated-Unregulated
This regulated-unregulated transform function represents the attenuation (reduction in force) of flashy flows provided by the modeled detention basin in the with-project condition that would be located just upstream of the impact area set. For some levels of inflow, outflow will be transformed to reflect the impact of the detention basin and ultimately change the estimates of economic damages from that of the without-project condition.
Loading
Lateral Structures
The system response function is tied two different modeled levees that are proposed for the left-bank. The system response function, sometimes called a fragility curve in the context of levees, assigns an estimate of probability of failure for various stages of loading on the levee. From the toe of the levee to the top of levee, the probability of failure is between 0 and 1.
Low Levee (Top of Levee 946 ft)
Fragility curve modeled with Armor
Loading
Fragility curve modeled without Armor
Loading
High Levee (Top of Levee 947.5 ft)
Loading
Occupancy Types
The Muncie occupancy types are the typical occupancy types referenced in the National Structure Inventory, and are provided with the study data as a tab-delimited file. The occupancy types include the range of structure uses, such as residential or commercial, and the associated relationships between depth of flooding resulting from the H&H relationships and expected percent damage to the structure and its contents.
Structure Inventories
Four structure inventories are provided: the base year without-project inventory, the future year without-project inventory, the base year with-project inventory, and the future year with-project inventory. In the with-project condition, nonstructural measures have been applied to 26 of the residential structures which have been elevated by 8 feet by increasing the foundation height by 8. In the future year, the number of commercial structures has been doubled to reflect an economic forecast suggesting significant growth in the concentration of commercial activity in Muncie, in between the base and most likely future years. The structures and their contents are the primary drivers of economic damages in the study area.

Compute Data Requirements
This section details the data required to compute stage-damage functions and scenarios for various project conditions and analysis years.
Stage-Damage Functions
Four sets of stage-damage functions can be computed - two sets (base and future year) for the without-project condition and two sets for the with-project conditions.
| Function Name | Floodplain Condition | Structure Inventory | Hydraulics | Frequency Functions | Stage-Discharge | Analysis Years |
|---|---|---|---|---|---|---|
| Existing Condition | No action | Existing Condition | Existing Condition Steady HDF | Existing Condition LP3s | Existing Condition Stage-Discharge | 2031 |
| Existing Future | No action | Future Without | Existing Condition Steady HDF | Existing Condition LP3s | Existing Condition Stage-Discharge | 2080 |
| Nonstructural | Nonstructural | With-Project Inventory | Existing Condition Steady HDF | Existing Condition LP3s | Existing Condition Stage-Discharge | 2031 |
| Nonstructural Future | Nonstructural | Future With-Project Inventory | Existing Condition Steady HDF | Existing Condition LP3s | Existing Condition Stage-Discharge | 2080 |
Scenarios
There are multiple scenarios with different combinations of flood risk management measures. Notice that for several with-project plans, existing conditions modeling is being used. We'll use without-project conditions for some of the summary relationships for with-project conditions when the with-project conditions do not affect the parametrization of those summary relationships. For example, a detention basin alone does not change the level of damage for a given stage as compared to the without-project condition and so we can use the without-project stage-damage functions for the with-detention plan.
| Scenario | Analysis Year | Frequency Functions | Regulated-Unregulated Functions | Stage-Discharge Functions | Lateral Structures | Stage-Damage Functions |
|---|---|---|---|---|---|---|
| Without Base Year | 2031 | Existing Condition LP3s | None | Existing Condition Stage-Discharge | None | Existing Condition |
| Without Future | 2080 | Existing Condition LP3 | None | Existing Condition Stage-Discharge | None | Existing Future |
| Levee Plan Base Year | 2031 | Existing Condition LP3 | None | With-Project Condition Stage-Discharge | 948ft, Left Bank Impact Area | Existing Condition |
| Levee Plan Future Year | 2080 | Existing Condition LP3 | None | With-Project Condition Stage-Discharge | 948ft, Left Bank Impact Area | Existing Future |
| Detention Plan Base Year | 2031 | Existing Condition LP3 | With-Project Transform, Both Impact Areas | Existing Condition Stage-Discharge | None | Existing Condition |
| Detention Plan Future Year | 2080 | Existing Condition LP3 | With-Project Transform, Both Impact Areas | Existing Condition Stage-Discharge | None | Existing Future |
| Nonstructural Plan Base Year | 2031 | Existing Condition LP3 | None | Existing Condition Stage-Discharge | None | Nonstructural |
| Nonstructural Plan Future Year | 2080 | Existing Condition LP3 | None | Existing Condition Stage-Discharge | None | Nonstructural Future |
| Levee & Detention Plan Base Year | 2031 | Existing Condition LP3 | With-Project Transform, Both Impact Areas | With-Project Condition Stage-Discharge | 948ft, Left Bank Impact Area | Existing Condition |
| Levee & Detention Plan Future Year | 2080 | Existing Condition LP3 | With-Project Transform, Both Impact Areas | With-Project Condition Stage-Discharge | 948ft, Left Bank Impact Area | Existing Future |
| Levee & Nonstructural Plan Base Year | 2031 | Existing Condition LP3 | None | With-Project Condition Stage-Discharge | 948ft, Left Bank Impact Area | Nonstructural |
| Levee & Nonstructural Plan Future Year | 2080 | Existing Condition LP3 | None | With-Project Condition Stage-Discharge | 948ft, Left Bank Impact Area | Nonstructural Future |
| Detention & Nonstructural Plan Base Year | 2031 | Existing Condition LP3 | With-Project Transform, Both Impact Areas | Existing Condition Stage-Discharge | None | Nonstructural |
| Detention & Nonstructural Plan Future Year | 2080 | Existing Condition LP3 | With-Project Transform, Both Impact Areas | Existing Condition Stage-Discharge | None | Nonstructural Future |

