Create New Study from Scratch
2.0 Data Requirements for a New HEC-FDA Study
Study data requirements vary widely. The requirements depend on the purpose of the study, the size of the study area, the hydrologic and hydraulic conditions of the study area, and the types of alternative plans considered, just to name a few. In general, the data required to build a new study must contain:
- Impact areas in the form of a polygon shapefile. The file must have a string or integer field that identifies a unique name. Only one set of impact areas can be imported.
- Analysis year(s).
Further, for a given alternative, analysis year, and impact area, a study must contain at a minimum the following data:
- Frequency functions - either (a) or (b) below:
- Analytical flow-frequency: (1) equivalent record length, mean, standard deviation, and skew, or (2) series of peak flows.
- Graphical frequency relationship: at least 8 (preferably 9) flow-frequency coordinates and equivalent record length. Stage-frequency is an option of the hydraulic conditions warrant.
- Stage-discharge functions consisting of flows and distributions of stages, if frequency function reflects discharge. If frequency function reflects stage, a stage-discharge function is not required.
- Aggregated stage-damage functions consisting of stages and distributions of damage, which can be manually entered or internally computed.
If you're using HEC-FDA 2.0 to compute the aggregated stage-damage functions, you will also need:
- Terrain, for one or both of the following: (1) using HDF results for hydraulics, in which case the terrain should be in HDF format, or (2) using terrain data for ground elevation at structure, in which case the terrain can be imported as a raster data set or HDF. Only one terrain file can be imported.
- Hydraulics data set should reflect water surface elevations (not depth) with three data format options: (1) steady or unsteady: 8 subdirectories with raster datasets (2) steady: 1 HDF; or (3) unsteady: 8 HDFs.
- Discharge-frequency function and stage-discharge function, or stage-frequency function only (same functions mentioned above).
- Occupancy types with damage categories, depth-percent damage functions with uncertainty, first floor elevation uncertainty, and either: (1) structure/content/other value uncertainty, or (2) content-to-structure value ratios with uncertainty and other-to-structure value ratios with uncertainty. Content, vehicle, and other configuration is optional.
- Structure inventory in the form of a point shapefile with at least a structure ID, structure value, first floor elevation (or ground elevation and foundation height) and occupancy type. Optionally: content value, other value, beginning damage depth, among others.
Stage-Damage H&H Data
- There are three types of engineering data required for a stage-damage compute: a frequency function, a stage-discharge function if frequency reflects flows, and a hydraulics data set. Double-check that the project conditions are the same across the three items. The computed stage-damage function will not make sense if: (1) with-project conditions are unique from without-project conditions, and (2) with-project data is used along with without-project data for the without-project set of stage damage functions.
- Ensure that the coordinate reference system is either set to be the same across all geospatial data sets, and/or that the study coordinate reference system is set by selecting the study projection from the study properties editor under the File menu (best practice). The coordinate reference system should match that of the hydraulics modeling.
Optional items include:
- Index points in the form of a point shapefile, if retrieving graphical stage-frequency from water surface elevations in hydraulics. Index points are not explicitly used for anything else within HEC-FDA, but remain an important concept.
- Regulated-unregulated transform function with unregulated flows and distribution of regulated flows.
- Exterior-interior function with exterior stages and distributions of interior stages.
- Levee (top of levee elevation) and optionally system response curve involving stages and distributions of breach probabilities.
Here's what you'll need from engineering
For each alternative-analysis year-impact area combination, you will need from engineering:
- Frequency functions - either (1) or (2) below:
- Analytical flow-frequency: equivalent record length, mean, standard deviation, and skew.
- Graphical frequency relationship: at least 8 (preferably 9) flow-frequency coordinates and equivalent record length. Stage-frequency is an option of the hydraulic conditions warrant.
- Stage-discharge functions consisting of flows and distributions of stages, if frequency function reflects discharge. If frequency function reflects stage, a stage-discharge function is not required.
The frequency function and stage-discharge function should reflect the same place in the channel, i.e. the same index point. You will also need a data set of hydraulic modeling for each alternative-analysis year combination. The modeling should reflect water surface elevations (not depth) with three data format options: (1) steady or unsteady: 8 subdirectories with raster datasets (2) steady: 1 HDF; or (3) unsteady: 8 HDFs
Create New Study and Compute Workflow
This section walks you through creating a new study and computing all results. This section assumes that you will use HEC-FDA Version 2.0 to compute aggregated stage-damage functions.
First: Create Study then Import or Specify Study Data
Create New Study
- To create a new HEC-FDA study. From the File menu, click New to open the Create New Study tab.

- Enter the Study Name and for the study.
- From the Study Path box, click the browser ellipse button to open a Select Folder browser window. Navigate to the desired location for saving the study and click, Select Folder.
- Entering a description is optional, but recommended for tracking important study information.
- Click OK to create the new study.

Set Study Properties
- Set the study properties, including the discount rate, period of analysis, and study projection. Open the Study Properties tab from the File menu.

Review and update the Discounting Information, which includes the Discount Rate and Period of Analysis.
Review and update the Price Information, which includes the Surveyed Year, Updated Year and Updated Price Index.
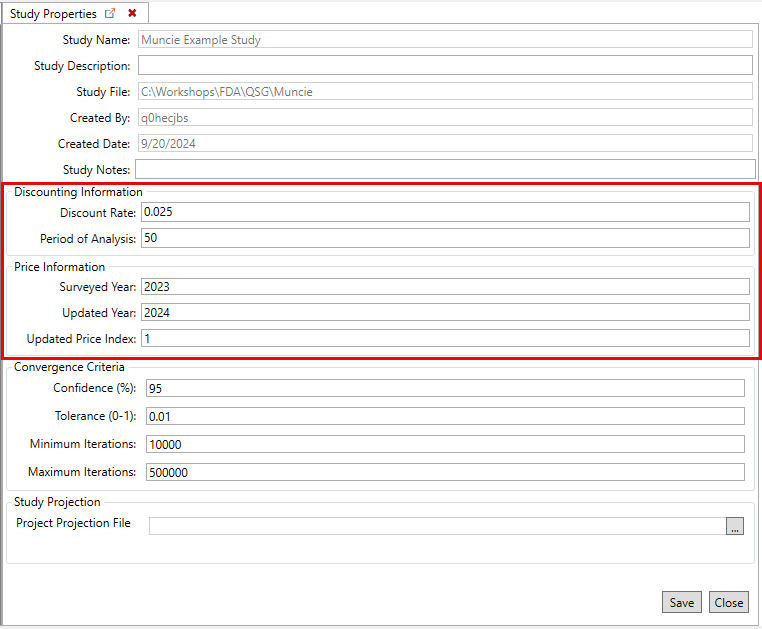
- Click Save and Close to save the study properties and close the tab.
Import Terrain (Optional)
The terrain is used to identify the ground surface elevation across an area of interest.
![]() Please note that only 1 terrain file may be imported. Import terrain as a HEC-RAS terrain. A RAS Terrain is a .hdf file paired with one or more .tif files. Select the .hdf file when importing your terrain and ensure the accompanying files are included in the same subdirectory. A terrain file is required if you're relying on hydraulic data in HDFs or if you do not have elevation data in your structure inventory (e.g., only foundation heights but no ground elevations).
Please note that only 1 terrain file may be imported. Import terrain as a HEC-RAS terrain. A RAS Terrain is a .hdf file paired with one or more .tif files. Select the .hdf file when importing your terrain and ensure the accompanying files are included in the same subdirectory. A terrain file is required if you're relying on hydraulic data in HDFs or if you do not have elevation data in your structure inventory (e.g., only foundation heights but no ground elevations).
- Import terrain if using terrain to identify ground elevation at structures or if using hydraulics from HEC-RAS in HDF file. From the Study Tree, right-click on Terrain and select the Import Terrain command.

A name and path to the terrain file are required for import, as in the image below. Click the browser ellipse button to navigate to the appropriate file (e.g., HEC-RAS Terrain, HDF file) and click Open. Click OK to import the terrain file.

Import Impact Areas
The impact area (formerly known as damage reaches in HEC-FDA Version 1) is the smallest geographical unit at which we calculate risk (at which we apply the risk equation).
- To import impact area set, from the Study Tree, right-click on Impact Area Set and select the import command.

From the Import Impact Area Set dialog, enter a name and description. Click the browser ellipse button to navigate to the appropriate file and click Open to set the shapefile path. Then select the unique impact area name (a field of the attribute table). Click OK to import the dataset.
 Only one set of impact areas may be imported into an HEC-FDA file. This means that all impact areas must be included in one polygon shapefile to be used in a study that contains a field for a unique impact area ID.
Import Index Points (Optional)
![]() Index points are only required when imported water surface elevations in hydraulics will be used to retrieve graphical stage-frequency functions. In other words, index points are not explicitly used for anything else within HEC-FDA, but remain an important concept. Import index points in the form of a point shapefile (only one index points dataset can be imported into a study).
Index points are only required when imported water surface elevations in hydraulics will be used to retrieve graphical stage-frequency functions. In other words, index points are not explicitly used for anything else within HEC-FDA, but remain an important concept. Import index points in the form of a point shapefile (only one index points dataset can be imported into a study).
- If desired, create index points for the study. Index points should be created when retrieving graphical stage-frequency from water surface elevations in hydraulics. From the Study Tree, right-click on Index Points and select the create new command.

- From the Create New Index Points dialog, enter the name and description for the data. Click the browser ellipse button to navigate to the appropriate file and click Open to set the shapefile path. Then select the unique name (a field of the attribute table). Click OK to import the dataset.

Import Hydraulic Data
Import set of eight hydraulic profiles for the without-project condition, and for each with-project condition if the hydraulics are different than the without-project condition. The hydraulics data may be one of the three below imported from grids (.tif), or hierarchical data format (.hdf).
- Unsteady HDF
- Steady HDF
- Gridded Data
To import the hydraulics:
- From the Study Tree, right-click on desired hydraulic dataset (e.g., Steady HDF) and select the import command.

For a given hydraulics data set, one HDF is required for steady hydraulics modeling, eight HDFs are required for unsteady hydraulics modeling. Gridded water surface elevation data is accommodated, see Hydraulics for more information. Specify a name, description, source file (or folder for unsteady), and be sure to identify either the correct Annual Exceedance Probabilities or correct Return Intervals.
- For the Steady HDF example importer, entering the Return Interval values updates the annual exceedance probability value.
- Users also have the option to set the study projection. Select the Set Study Projection button to open the Study Properties dialog for importing the study projection file.

Specify Frequency Relationships
Frequency relationships should be entered for each project condition-analysis year-impact area combination. To access the options for creating, retrieving or importing frequency functions, from the Study Tree, right-click on Frequency Functions and select the desired shortcut command.

The frequency relationships may be one of the three below.
- Analytical flow-frequency function.
- Graphical flow-frequency function.
- Graphical stage-frequency function.
![]() Please see EM 1110-2-1619, HEC-FDA on Discourse, or speak with HEC about choosing one of the three. Recall that uncertainty in EAD is most sensitive to uncertainty in flow, so we want to include flow in our models if the hydrologic and hydraulic conditions permit.
Please see EM 1110-2-1619, HEC-FDA on Discourse, or speak with HEC about choosing one of the three. Recall that uncertainty in EAD is most sensitive to uncertainty in flow, so we want to include flow in our models if the hydrologic and hydraulic conditions permit.
Users can edit, rename or remove frequency functions. To access the options, from the Study Tree, right-click on the function (e.g., Muncie Example LP3) and select the desired command from the shortcut menu.

Analytical Frequency Function
To create an analytical frequency function, from the Study Tree right-click on Frequency Functions and select the create new option. Enter the name for the function and a description (optional, but recommended). Select Analytical, and provide the mean, standard deviation, skew, and equivalent record length. Click Save and Close to create the new function.

To edit the created frequency function, from the Study Tree right-click on the created function and click Edit Frequency Function.
Graphical Frequency Function
To create an graphical frequency function, from the Study Tree right-click on Frequency Functions and select the create new option. Enter the name for the function and a description (optional, but recommended). Select Graphical, select either Flow or Stage. Provide at least eight coordinates of exceedance probability and flow (or stage), and an equivalent record length. Click on Compute Confidence Limits to view the 0.025 and 0.975 confidence limits. Click Save and Close to create the new function.
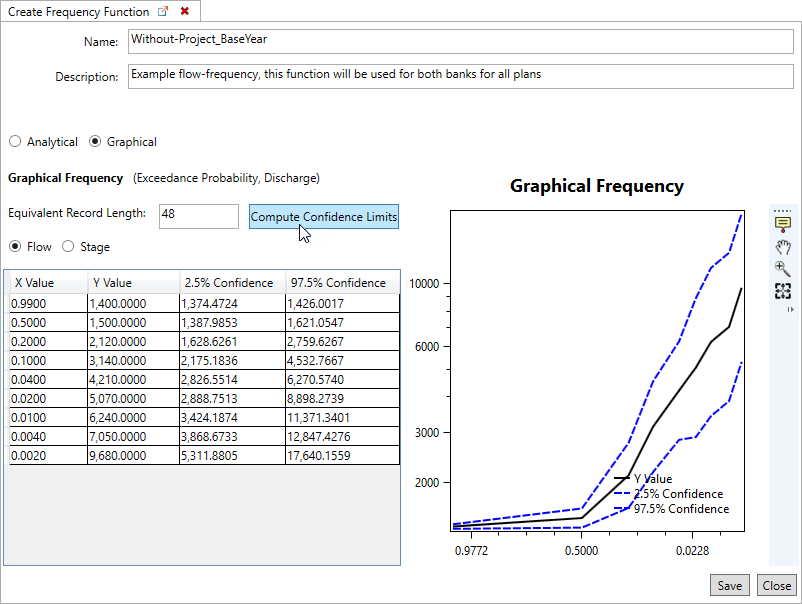
To edit the created frequency function, from the Study Tree right-click on the created function and click Edit Frequency Function.
![]() Computed confidence limits are for viewing purposes only, there is no need to compute confidence limits to use the frequency function in an expected annual damage compute. The computational engine calculates the uncertainty when the entered frequency function is used in a compute. Once created, users will need to re-compute the confidence limits if opened in the Editor.
Computed confidence limits are for viewing purposes only, there is no need to compute confidence limits to use the frequency function in an expected annual damage compute. The computational engine calculates the uncertainty when the entered frequency function is used in a compute. Once created, users will need to re-compute the confidence limits if opened in the Editor.
Retrieve Graphical Frequency Function
Users may retrieve graphical stage-frequency curves from the imported hydraulic data (review the Add Graphical Frequency Function section for instructions). Recall that index points must also be imported in the FDA study to use this option (review the Index Points section for import instructions). Don't forget to edit the equivalent record length for each function after generation.
- To create an graphical stage-frequency function, from the Study Tree right-click on Frequency Functions and select the Retrieve Graphical Frequency Function option.
- Select the appropriate Hydraulic Dataset and Index Point Set to retrieve from, and click the GenerateFrequencyCurves button.

- The generated frequency curves are added to the Study Tree under the Frequency Functions element and is automatically named based on the name of the imported index point(s) (e.g., 3347000) and hydraulic dataset (e.g., WOP-BaseYear).

- Provide the correct equivalent record length for each generated stage-frequency function. To edit the generated frequency function, from the Study Tree right-click on the created function and click Edit Frequency Function.
Regulated-Unregulated Relationship (Optional)
Optionally, specify regulated-unregulated transform flow relationships. Specify with a series of coordinates of unregulated flow and distribution of regulated flow.
To create a regulated-unregulated transform relationship:
- From the Study Tree right-click on Regulated-Unregulated Transform Functions and select the create new option.

- Enter the name for the function and a description (optional, but recommended).
- Select the Distribution Type from the options:
- Deterministic
- Uniform
- Normal
- Triangular (default selection)
- LogNormal
- Enter the inflows and specify the distribution of outflows.
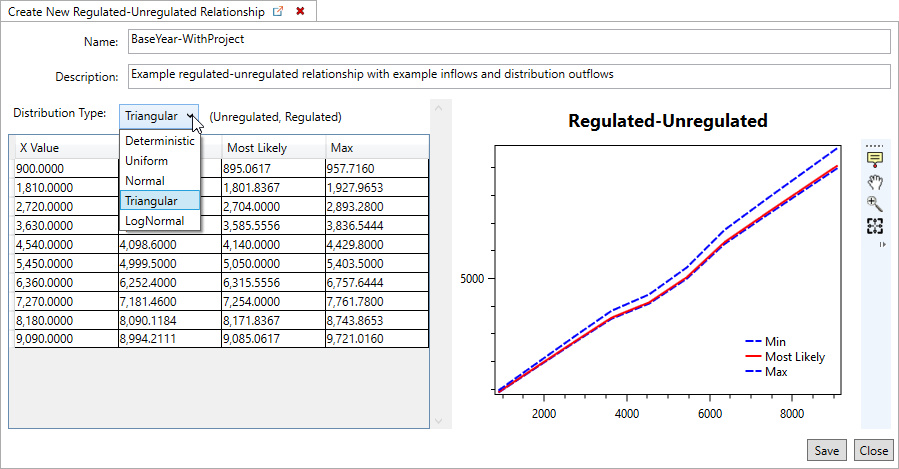
- Click Save and Close to create the new relationship.
Stage Transform Functions
The stage-discharge function is required unless a stage-frequency function is used as the defining frequency relationship. Exterior-interior stage-transform functions are optional.
Stage-Discharge Relationship (Conditional)
If using discharge-frequency, specify a stage-discharge relationship. You'll need to specify a stage-discharge function to accompany each flow-frequency function. Specify with a series of coordinates of flow and distribution of stage. To create a new stage-discharge relationship:
- From the Study Tree, under Stage Transform Functions, right-click on Stage-Discharge Functions and select the create new option.

- Enter the name for the function and a description (optional, but recommended).
- Select the Distribution Type from the options:
- Deterministic (default selection)
- Uniform
- Normal
- Triangular
- LogNormal
- Enter the stage-discharge function coordinates with the specification of the distribution of stages for a given flow. Be sure to include the zero flow-invert stage coordinate.
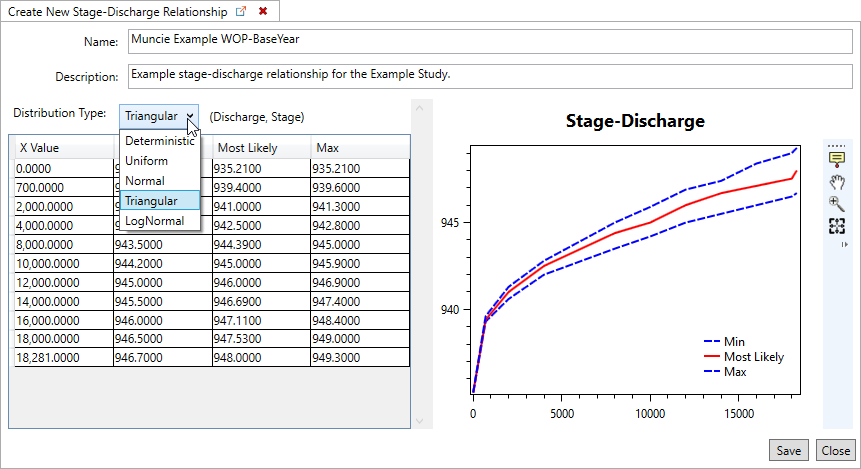
- Click Save and Close to create the stage transform function.
Specify Exterior-Interior Relationships (Optional)
An exterior-interior stage transform function relates the water surface elevation in the channel (exterior) to the water surface elevation in the floodplain (interior). To create an exterior-interior stage transform function:
- From the Study Tree, under Stage Transform Functions, right-click on Exterior-Interior Functions and select the create new option.

- Enter the name for the function and a description (optional, but recommended).
- Select the Distribution Type from the options:
- Deterministic (default selection)
- Uniform
- Normal
- Triangular
- LogNormal
- Enter the paired data with or without uncertainty. The X Value column should have external stages and Y Value column(s) should specify the corresponding interior stage.

- Click Save and Close to create the transform function.
Lateral Structures
Optionally, specify levees with a top of levee elevation minimally. Ideally, select user-defined and enter a system response curve in stages and failure probabilities. To create new lateral structure:
- From the Study Tree, right-click Lateral Structures and select the create new option.

- Give the levee a useful Name and Description (optional, but recommended).

 When naming lateral structures it is recommended to include the impact area in the name. For example, "Left-bank" is included in the name for the levee in the example below because the levee in the Example Study Data is in the left-bank impact area.
 - Specify the Top of Levee Elevation.
- The System Response Curve is set to Default. Alternatively, select User Defined and enter the failure function to specify the probability of breach for each stage.

- Click Save and Close to add the lateral structure.
Import Occupancy Types
The recommended workflow is to import occupancy types using the same flat-file format as that which was used for HEC-FDA Version 1.4.3. See Appendix D of the Version 1.4.1 User's Manual for more information. Optionally, occupancy types may be entered manually. The occupancy types editor is the most complicated editor. See the page on the HEC-FDA User Interface for more information.

Occupancy types can be imported from a text file or created within the FDA occupancy types editor. To import occupancy types from a tab-delimited text file:
- From the Study Tree, right-click on Occupancy Types under Economics and select the import option. To view the requirements for the tab-delimited text file review the HEC-FDA Version 1.4.1 User's Manual, Appendix D (available here).

- From the import dialog enter the Base Name and Base Description.
- From the Tab Delimited File box, click the browser ellipse button to navigate to the appropriate text file and click Open. Then select the unique name (a field of the attribute table). Click OK to import the dataset.

Alternatively, to create new occupancy types, from the Study Tree, right-click on Occupancy Types under Economics and select the create new option to open a blank editor for creating new occupancy types.
Import Structure Inventories
A structure inventory is imported using a point shapefile, where the attribute table must have the following attributes: unique ID, dollar-denominated structure value, occupancy type, and either both foundation height and ground elevation or just the first floor elevation. Identify whether first floor elevation or foundation height will be used, and if foundation height, identify whether the ground elevations will come from the structure inventory or a terrain file. Select optional attributes and identify what occupancy type names in the structure inventory correspond to which occupancy types in the study database.
To import a structure inventory:
- Right-click on Structure Inventories under Economics in the Study Tree and select Import From Shapefile.

- Give the imported inventory a useful Name and Description (optional, but recommended).
- Identify the path of the shapefile. From the Structure Inventory Shapefile box, click the browser ellipse button to navigate to the appropriate point shapefile and click Open.
- From the Required Attributes panel, select the first floor elevation source:
- First Floor Elevation – Select this option if the shapefile contains an attribute with the structure first floor elevation. When selected a First Floor Elevation required attribute dropdown list will be provided below the Structure ID and Occupancy Type dropdown lists.
- Ground Elevation and Foundation Height – Select this option to have the first floor elevation calculated from the structure ground elevation and foundation height. Selecting this option requires users to select the Ground Elevation Source either from an imported terrain file or from the selected structure inventory shapefile.
 HEC-FDA will notify users if the required attributes have not been selected in the import wizard (e.g., Structure ID was left blank), or if a terrain file has not been imported and the From Terrain File is selected.
- Identify required attributes and any optional attributes.

- Click Next.
- The next window requires users to identify the occupancy types for the structures. Select source of occupancy types (e.g., NSIOccTypes MuncieOccTypes), and match imported occupancy types to occupancy types in the structure inventory.

- Click Finish.
Duplicates Not Needed
- If a given study data item is the same for multiple project conditions, then that study data item need not be duplicated. For example, assume that you have a flow-frequency function for the existing condition of a given impact area, but the flow-frequency function is also representative of the hydrologic conditions of the future-without project condition, and all with-project conditions. In that case, create one frequency function, and select the same frequency function for each of the Scenarios.
- Except for terrain and the set of impact areas, many items can be created for a given study data element. For example, multiple structure inventories can be imported.
Second: Compute Aggregated Stage-Damage Functions
The following items must be selected for configuration of an aggregated stage-damage compute:
- Discharge-frequency function and discharge-stage function or just a stage-frequency function
- Hydraulic data set
- Structure inventory
- Occupancy types
To create a new aggregated stage-damage function:
- Right-click on Aggregated Stage-Damage Functions under Economics within the Study Tree and select the create new option.

- Define a useful Name and Description.
- Select Computed.
- Enter the Analysis Year (e.g., base year is 2024 in the example).
- In the Configure and Compute panel, select the the appropriate hydraulic dataset (e.g., Steady-State_RASdata) and structure inventory (e.g., BaseWO). Then for each impact area select the appropriate Frequency and Stage Discharge functions.
- Optionally, select Write Details to CSV to obtain structure-level stage-damage details (selected by default). The CSV file for the created function will be saved to you study directory in a new folder named StuctureStageDamageDetails.
- Click Compute Curves.
 An aggregated stage-damage function is computed for each impact area, damage category, asset category combination.
- Click Save, and Close.
Third: Specify and Compute Scenarios
Typical Scenarios
Specify a scenario for each project condition-analysis year combination. The following must be selected for each impact area for a given scenario to compute EAD:
- Discharge-frequency function
- Stage-discharge function
- Stage-frequency function if not able to use discharge-frequency function and stage-discharge function
- Stage-damage functions, one for each damage category - asset category combination (optional if performance is the only metric of interest)
The following may optionally be selected for any impact area for a given scenario:
- Regulated-unregulated flow transform function
- Interior-exterior stage transform function
- Levee elevation, system response curve optionally
- Additional thresholds
To create a new typical scenario:
- From the Study Tree, right-click on Scenarios and select Create New Scenario.

- Give the scenario a useful name, description, and specify the analysis year.
- If the scenario is a typical scenario move to top impact area tab (e.g., Left-Bank). If the scenario is for calculating total risk, move to the Total Risk Scenarios section.
- For each impact area, select:
- Frequency function (if using flow-frequency, specify rating curve).
- Set of aggregated stage-damage functions (optional if performance is the only metric of interest).
- Regulated-unregulated function (optional).
- Lateral structure (if the impact area contains a levee).
- Exterior-interior function (optional).
- For each impact area, specify the threshold stage by which system performance statistics will be calculated. This step requires configuration for those impact areas of a scenario that will not be assigned a lateral structure.
- For impact areas with lateral structures, the software automatically identifies the threshold.
- For impact areas with a lateral structure but without a system response curve, the threshold is the stage equal to the top elevation of the levee.
- For impact areas with lateral structures and with system response curves, performance does not reflect a fixed threshold. Instead, performance considers the joint probability of hazard loading (e.g. stage) and levee breach for the entire range of stages for which there is a non-zero probability of breach.
- For impact areas without lateral structures and if the scenario reflects the without-project condition, choose Calculate Default Threshold. The default threshold is the stage at which 5% of the damage of the 1% event occurs. This is considered to be the stage at which significant damage begins.
- For impact areas without lateral structures and if the scenario reflects the with-project condition, use without-project condition scenario performance results to identify the threshold stage. Obtain the without-project condition threshold stage calculated for the same impact area and analysis year. Using the same threshold for both the without- and with-project conditions of the same analysis year where no levees are present correctly results in changes to system performance metrics through modifications to hydrology or hydraulics. System performance changes are not modeled for nonstructural alternatives. To view the target threshold value, from the Study Tree, right-click on the without project scenario (for the correct analysis year), and select Compute Scenario if results have not yet been computed, otherwise right-click on the scenario and view results. The Compute Log opens to display the compute progress. Once complete, click Yes to view the results. Select the appropriate impact area, and the Performance outcomes. Note that the calculated Threshold value is displayed for the selected impact area. Return to the Create New Scenario dialog and enter the identified threshold stage for the corresponding impact area.
Important Note:
If the scenario is a with-project scenario then you must manually enter the Threshold Stage for all impact areas that do not have a lateral structure. This threshold stage is the "Target Stage" (or project performance threshold value) that is calculated for the without-project scenario for the corresponding analysis year and impact area.
- For impact areas with lateral structures, the software automatically identifies the threshold.
- Once all the required (noted with a red * asterisk) summary relationships and parameters have been selected for each impact area the impact area tab displays a green
 checkmark.
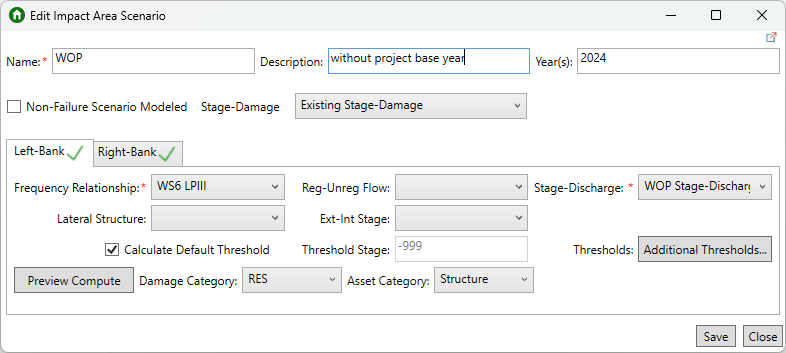
- Another option in the scenario editor is the ability to add additional thresholds. Additional thresholds could be handy for nonstructural alternatives to be able to report performance for differentially elevated structures. To add thresholds, click the Additional Thresholds button and from the System Performance Thresholds dialog click Add to add new rows to the thresholds table and enter a stage value. Repeat this process to add more thresholds. To remove an entered threshold, select the row you want to delete and click Remove. Once finished, click OK.
- Click the Preview Compute button to view damage frequency function and deterministic calculations of EAD and AEP. Spend time inspecting the overlap across the summary relationships. Lack of overlap is a significant problem that means that modeling conditions and assumptions are inconsistent between hydrology, hydraulics, or economics and the resulting risk compute will produce bad results.

- When finished, click Save and Close to create the new scenario.
Total Risk Scenarios
In addition to the normal FDA study requirements, when creating total risk scenarios the following must also be added to your study:
- A second hydraulic dataset for the non-failure situation for the interior flooding that would occur in the floodplain if the levee does not fail (e.g., is overtopped or outflanked).
- A second set of aggregated stage-damage functions calculated using the non-failure hydraulic dataset.
To create a scenario that calculates total risk:
- From the Study Tree, right-click on Scenarios and select Create New Scenario.
- Enter the name, description and analysis year for the scenario.
- Enable the Non-Failure Scenario Modeled option, by checking the checkbox. Note, the Create New Scenario dialog updates to include two stage-damage lists. One list for the Failure Stage-Damage function and one for the Non-Failure Stage-Damage function.
- Next, complete the scenario as you normally would by making sure you select the correct summary relationships and parameters required for each impact area (see the Typical Scenarios section for detailed steps). Users must remember to include the lateral structure for the appropriate impact area as HEC-FDA does not check that a lateral structure is selected when the non-failure scenario modeled option is enabled.
- Once all the required (noted with a red * asterisk) summary relationships and parameters have been selected for each impact area the impact area tab displays a green
 checkmark.
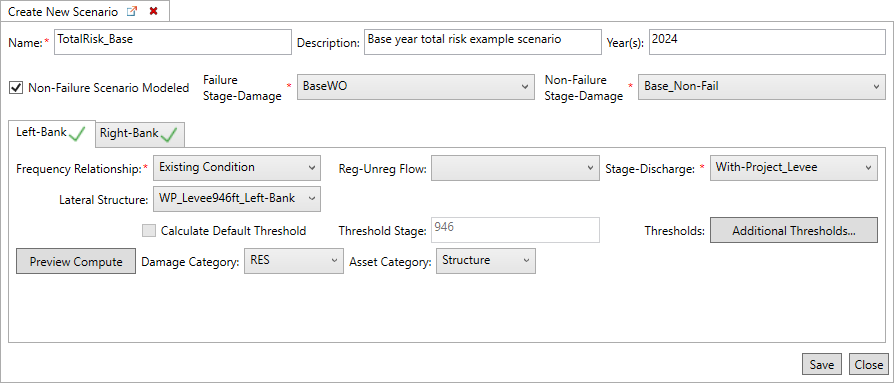
- Click the Preview Compute to view damage frequency function and deterministic calculations of EAD and AEP.
- If desired, use the Additional Thresholds button to add thresholds to the scenario.
- When finished, click Save and Close to create the new scenario.
Compute and View Scenario Results
- To compute a specific scenario, from the Study Tree, right-click on the scenario and select Compute Scenario. For example, to view the target threshold value, from the Study Tree, right-click on the without project scenario (for the correct analysis year), and select Compute Scenario. The Compute Log opens to display the compute progress.

Alternatively, users can compute multiple scenarios at once by right-clicking on Scenarios from the Study Tree and selecting Compute Scenarios. A dialog opens that provides checkboxes to select specific scenarios to compute, or use the Select All option to compute all the scenarios at once.

- Once the compute is complete, click Yes to view the results.
- Select the type of report - Expected Annual Damage or Project Performance, and select result of interest. For example, to identify the target stage for a with-project scenario, select the appropriate impact area, and the Performance outcomes. Note that the calculated Threshold value is displayed for the selected impact area.
- Then, return to the Scenario dialog and enter the identified threshold stage for the corresponding impact area.
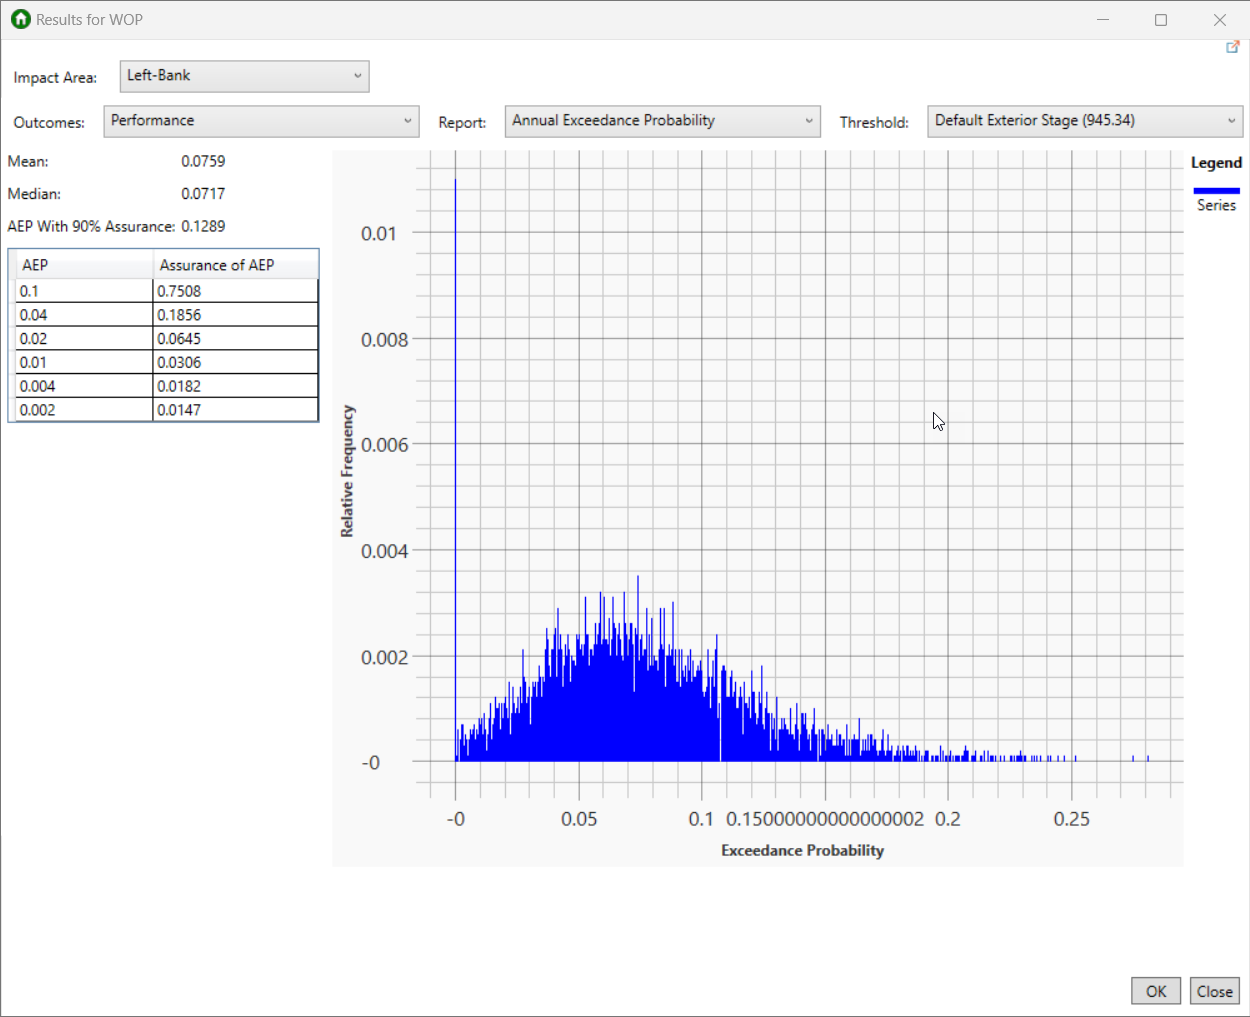
See Scenario Results for more information.
Fourth: Specify Alternatives and an Alternative Comparison Report
Create Alternatives
To create a new alternative:
- First, set the study properties, including the discount rate and period of analysis. Open the Study Properties tab from the File menu.

- Enter the discount rate and period of analysis from the Properties dialog. Click Save and Close to close the dialog and set the discount rate and period of analysis.
Please note that the discount rate should be in decimal form, not percentage.
- Next, from the Study Tree, right-click on Alternatives and select Create New Alternative.

- Give the alternative a useful name (e.g., Without Project) and description.

- From the Base Year Scenario, select the appropriate created scenario (e.g., WOP_Base) and enter the correct base year (e.g., 2024).
- From the Future Year Scenario, select the appropriate corresponding future year scenario (e.g., WOP_Future) and enter the correct future year (e.g., 2054).
 Note: you must be sure that the period of analysis in the Study Properties is consistent with the base and future years you select.
 - Click, Save and Close.
- Either compute and view the alternative results, or continue creating additional project alternatives and view the summary results.
- To view the results for a specific alternative, from the Study Tree, right-click on the alternative and select View Results to compute.

- From the Alternative Results dialog, select the desired Report from the list which includes: Damage with Uncertainty, Damage by Impact Area, or Damage by Damage Category.

- Alternatively, compute and view the results summary table. To view the summary results, from the Study Tree, right-click on Alternatives and select View Alternative Summary Results.

- From the View Alternative Results dialog, select desired alternatives to include in the summary results, or click Select All and include all alternatives. Click View to open the summary results.

Review Alternative Results for more information.
Create an Alternative Comparison Report
- Right-click on Alternative Comparison Reports in the Study Tree and select the create new option.

- Specify a useful Name and Description (optional, but recommended).
- For the Without Project, select the appropriate alternative (e.g., Without Project).
- Select a with-project condition alternative.
- Click Add Comparison to include additional with-project condition alternatives, if applicable. By default the alternative comparison report dialog contains one With Project condition. Select the appropriate with-project condition alternatives to include in the comparison report.
- To remove an added comparison, select the comparison (e.g., Levee and Nonstructural) and click Remove Comparison.

- When the desired without and with project comparison(s) have been added and selected, click Save and Close.
- Right-click on the created alternative comparison report and select View Results.

- View the results for the desired With-Project Alternative (e.g., Levee Only Plan), and desired measurement of damage: expected annual damage (EAD) or average annual equivalent damage (AAEQ).
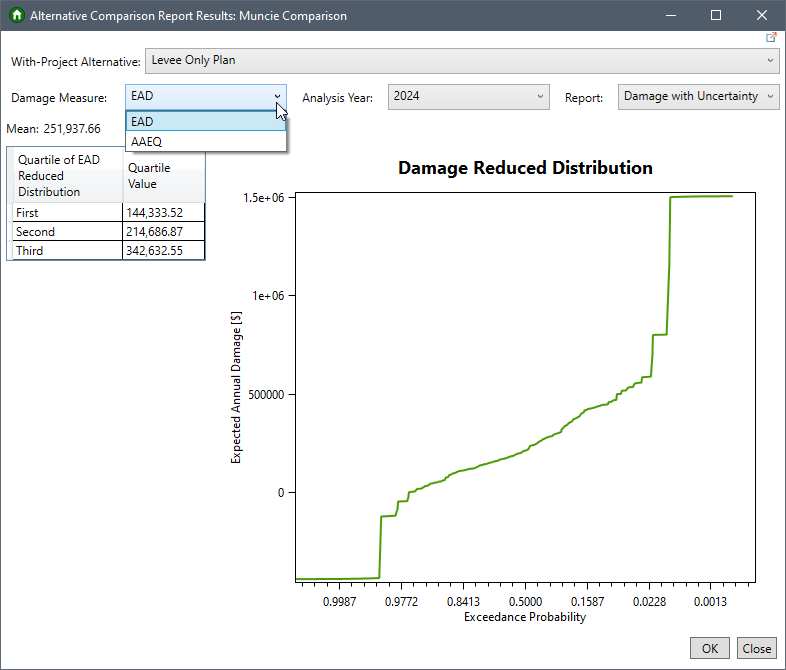
- If EAD is selected, review the results by Analysis Year and report options.
- For either damage measure, the Report options include: Damage with Uncertainty, Damage by Impact Area, or Damage by Damage Category.

Review the Alternative Comparison Report Results page for more information.
Helpful Hints About Study Data
Tips and Tricks
- Keep track of the units of measurement. Units of measurement will not be tracked nor handled within HEC-FDA Version 2.0. For example, if terrain elevation is measured in meters but the first floor elevation is measured in feet, HEC-FDA will not know about the discrepancy - this will have to be handled outside of HEC-FDA.
- Generally, there are five distributional assumptions available for input relationships and uncertainty parameters: Normal, Log Normal, triangular, uniform, and deterministic (no uncertainty). These distributions are specified in their usual way.
Related Topics
Review the HEC-FDA Quick Start Guides Create New Study from Scratch page for instructional videos for creating a new study from scratch.