Graphical Frequency Function
Flows or Stages
![]() Graphical frequency functions may be used for flows or for stages.
Graphical frequency functions may be used for flows or for stages.
Where Can I Find Data for Graphical Frequency Functions?
The data required for a graphical frequency function can be obtained from statistical analysis of annual peak flows or annual peak stages in HEC-SSP, or using hydrologic and hydraulic modeling in HEC-HMS and HEC-RAS, respectively.
Working with Graphical Frequency Functions in HEC-FDA
Graphical frequency functions should be provided as paired data with an equivalent record length. The paired data consists of a column of standard frequencies and a column of stages or flows. If retrieving a stage-frequency relationship from the hydraulics modeling, be sure to enter a 9th coordinate for the 0.99 AEP event.
Differences Between HEC-FDA Versions 1 and 2
Graphical flow- and stage- frequency functions are entered and used the same way in both versions.
Steps to Configure a Graphical Frequency Function
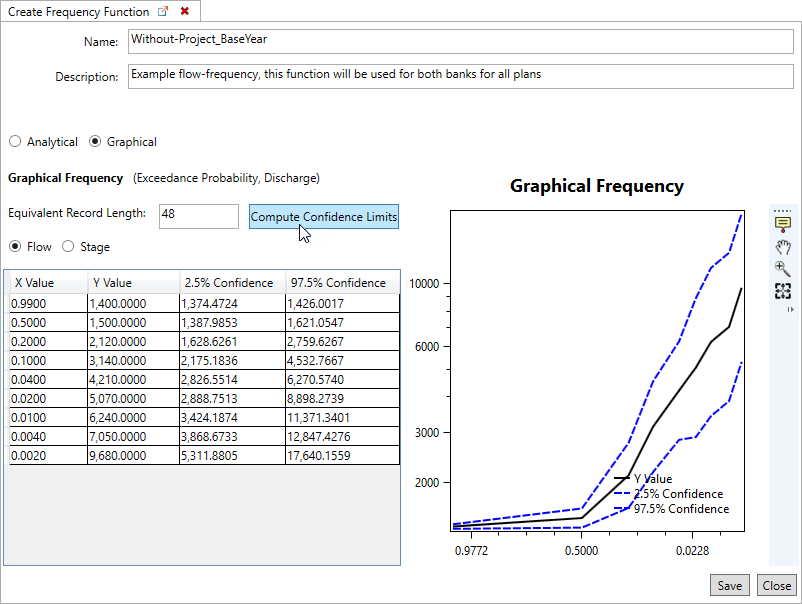
To create an graphical frequency function, from the Study Tree right-click on Frequency Functions and select the create new option. Enter the name for the function and a description (optional, but recommended). Select Graphical, select either Flow or Stage. Provide at least eight coordinates of exceedance probability and flow (or stage), and an equivalent record length. Click on Compute Confidence Limits to view the 0.025 and 0.975 confidence limits. Click Save and Close to create the new function.

To edit the created frequency function, from the Study Tree right-click on the created function and click Edit Frequency Function.
![]() Computed confidence limits are for viewing purposes only, there is no need to compute confidence limits to use the frequency function in an expected annual damage compute. The computational engine calculates the uncertainty when the entered frequency function is used in a compute. Once created, users will need to re-compute the confidence limits if opened in the Editor.
Computed confidence limits are for viewing purposes only, there is no need to compute confidence limits to use the frequency function in an expected annual damage compute. The computational engine calculates the uncertainty when the entered frequency function is used in a compute. Once created, users will need to re-compute the confidence limits if opened in the Editor.
Retrieve Graphical Frequency Function
Users may retrieve graphical stage-frequency curves from the imported hydraulic data (review the Add Graphical Frequency Function section for instructions). Recall that index points must also be imported in the FDA study to use this option (review the Index Points section for import instructions). Don't forget to edit the equivalent record length for each function after generation.
- To create an graphical stage-frequency function, from the Study Tree right-click on Frequency Functions and select the Retrieve Graphical Frequency Function option.
- Select the appropriate Hydraulic Dataset and Index Point Set to retrieve from, and click the GenerateFrequencyCurves button.

- The generated frequency curves are added to the Study Tree under the Frequency Functions element and is automatically named based on the name of the imported index point(s) (e.g., 3347000) and hydraulic dataset (e.g., WOP-BaseYear).

- Provide the correct equivalent record length for each generated stage-frequency function. To edit the generated frequency function, from the Study Tree right-click on the created function and click Edit Frequency Function.