Scenarios
What is a Scenario?
A scenario collects the hydrologic, hydraulic, and economic data for each impact area and for a given project condition and analysis year.
What is the Purpose of a Scenario?
A scenario consists of the set of summary relationships that are sampled during the Monte Carlo simulation. The scenario Monte Carlo simulation provides expected annual damage and project performance results for each impact area. Expected annual damage results include the distribution of expected annual damage and expected annual damage by damage category. Project performance results include the distribution of AEP, long-term exceedance probability, and assurance of the target threshold.
Target Threshold
![]() There are four different cases for determining the threshold value:
There are four different cases for determining the threshold value:
- For impact areas without levees, and if the scenario reflects the without-project condition, the user should select Compute Default Threshold. The software calculates the default threshold as the stage at which 5% of the damage of the 1% event occurs. This is considered to be the stage at which significant damage begins.
- For impact areas without levees, and if the scenario reflects the with-project condition, then the user must enter the threshold stage as the default threshold stage from the without-project condition. With-project system performance then reflect the stage at which significant damage begins in the without-project condition.
- For impact areas with levees but without a system response curve, the software calculates the threshold as the stage equal to the top elevation of the levee.
- For impact areas with levees and with system response curves, performance does not reflect a fixed threshold. Instead, the software calculates performance as the joint probability of hazard loading (e.g., stage) and levee breach for the entire range of stages for which there is a non-zero probability of breach.
Working with Scenarios in HEC-FDA
Scenario Model Concordance
Concordance is the state of agreement among a set of objects. In this case, the set of objects consist of the intended modeled result and the various input models. A state of agreement must be in place about the scenario/project condition, assumptions, data sources, boundary conditions, parameterization, analysis years, and uncertainties across all input models and the intended modeled result. The intended modeled result of a Scenario is a computed model of risk (EAD), which depends on several inputs which are themselves models: hazard curves (e.g. flow-frequency, stage-frequency), transform curves (unregulated-regulated, stage-flow), system response curves (levees). and consequence curves (stage-damage). All of the modeled conditions reflected in each of the input models must concord with the intended condition of the model of risk. For example, if the intention is to compute risk for the base year of the without-project condition, then the input hazard curves, transform curves, system response curves, and consequence curves should all represent the expected conditions in the river and floodplain in the base year of the without-project condition. Likewise, if modeling a with-project condition with addition or modification of a levee, then the same set of input models must reflect a levee, which can mean revised modeling for the hazard curves, transform curves, system response curves, and consequence curves. In this example, a stage-discharge function that reflects a river without a levee should probably not be used to compute risk for the river with a levee in place (unless that assumption can be reasonably defended), because a given discharge is likely to result in a different stage in the levee condition which is important variability to capture in the risk assessment. The same applies for stage-damage functions, as the stage in the levee condition is likely to cause a different level of damage than the same stage in the condition without a levee. Other issues with concordance occur when there exists poor overlap across model domain. For example, if a flow-frequency curve includes flows above 100,000 cfs for the 0.01 AEP but the stage-flow curve has a maximum flow of 80,000 cfs, then there will not be stages that concord to flows above 80,000 cfs and the combination of the two curves results in a truncated stage-frequency function and ultimately a biased estimate of EAD. This concordance of modeled conditions is critical for proper counterfactual analysis with a well-defined intervention and because the risk assessment math depends on concordance. See Expected Annual Damage in the HEC-FDA Technical Reference for more about the risk assessment math.
Differences Between HEC-FDA Versions 1 and 2
Scenarios Versus Plans
A scenario is a new concept to the HEC-FDA software. A scenario reflects study configuration at the plan-analysis year level. This concept explicitly allows for a more nimble configuration through the ability to assign any of the input functions/data to a given plan-analysis year combination. A scenario contains the same information/configurations contained by the blue highlighted row in the image of the HEC-FDA Version 1 interface below. The default threshold in HEC-FDA Version 2 is calculated in the same the way that the default threshold is calculated in HEC-FDA Version 1. Expected annual damage and project performance results of a scenario are the same results obtained from evaluation of plans by analysis year for a given plan-year combination (a given row in the image below) in HEC-FDA Version 1.

Target Stage Versus Threshold Stage
The threshold stage is the "Target Stage" (Version 1 term) or project performance threshold value which is determined the same way in Version 2 as it was in Version 1. As with Version 1, in Version 2 there are four cases for determining the threshold stage. However, 2.0 will not automatically identify the threshold stage for impact areas without levees for with-project condition scenarios, the user will need to specify those stages.
Total Risk
We have added functionality to the software to calculate total risk. Total risk is the sum of failure risk and non-failure risk. Traditionally, when there is a levee assigned to an impact area (formerly known as damage reaches), HEC-FDA would calculate failure risk only, which is appropriate when there is no interior flooding expected if the levee does not fail. However, if there is any type of significant interior flooding despite the levee performing correctly, we need to include that non-fail risk. Review the Flood Risk Assessment and HEC-FDA page for more information on how total risk is calculated in HEC-FDA Version 2.0.
Steps for Configuring Scenarios in HEC-FDA
Typical Scenarios
The instructions provided in this section explain how to create a typical scenario. To create a total risk scenario, view the Total Risk Scenarios section. The Compute and View Results section provides scenario compute options and instructions for viewing scenario results.
Specify a scenario for each project condition-analysis year combination. The following must be selected for each impact area for a given scenario to compute EAD:
- Discharge-frequency function
- Stage-discharge function
- Stage-frequency function if not able to use discharge-frequency function and stage-discharge function
- Stage-damage functions, one for each damage category - asset category combination (optional if performance is the only metric of interest)
The following may optionally be selected for any impact area for a given scenario:
- Regulated-unregulated flow transform function
- Interior-exterior stage transform function
- Levee elevation, system response curve optionally
- Additional thresholds
To create a new typical scenario:
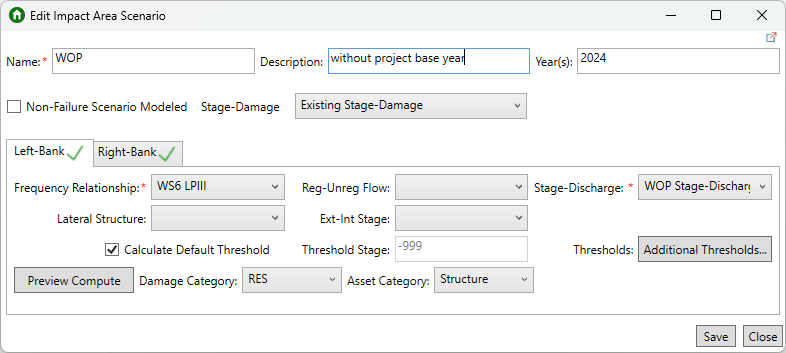
- From the Study Tree, right-click on Scenarios and select Create New Scenario.

- Give the scenario a useful name, description, and specify the analysis year.
- If the scenario is a typical scenario move to top impact area tab (e.g., Left-Bank). If the scenario is for calculating total risk, move to the Total Risk Scenarios section.
- For each impact area, select:
- Frequency function (if using flow-frequency, specify rating curve).
- Set of aggregated stage-damage functions (optional if performance is the only metric of interest).
- Regulated-unregulated function (optional).
- Lateral structure (if the impact area contains a levee).
- Exterior-interior function (optional).
- For each impact area, specify the threshold stage by which system performance statistics will be calculated. This step requires configuration for those impact areas of a scenario that will not be assigned a lateral structure.
- For impact areas with lateral structures, the software automatically identifies the threshold.
- For impact areas with a lateral structure but without a system response curve, the threshold is the stage equal to the top elevation of the levee.
- For impact areas with lateral structures and with system response curves, performance does not reflect a fixed threshold. Instead, performance considers the joint probability of hazard loading (e.g. stage) and levee breach for the entire range of stages for which there is a non-zero probability of breach.
- For impact areas without lateral structures and if the scenario reflects the without-project condition, choose Calculate Default Threshold. The default threshold is the stage at which 5% of the damage of the 1% event occurs. This is considered to be the stage at which significant damage begins.
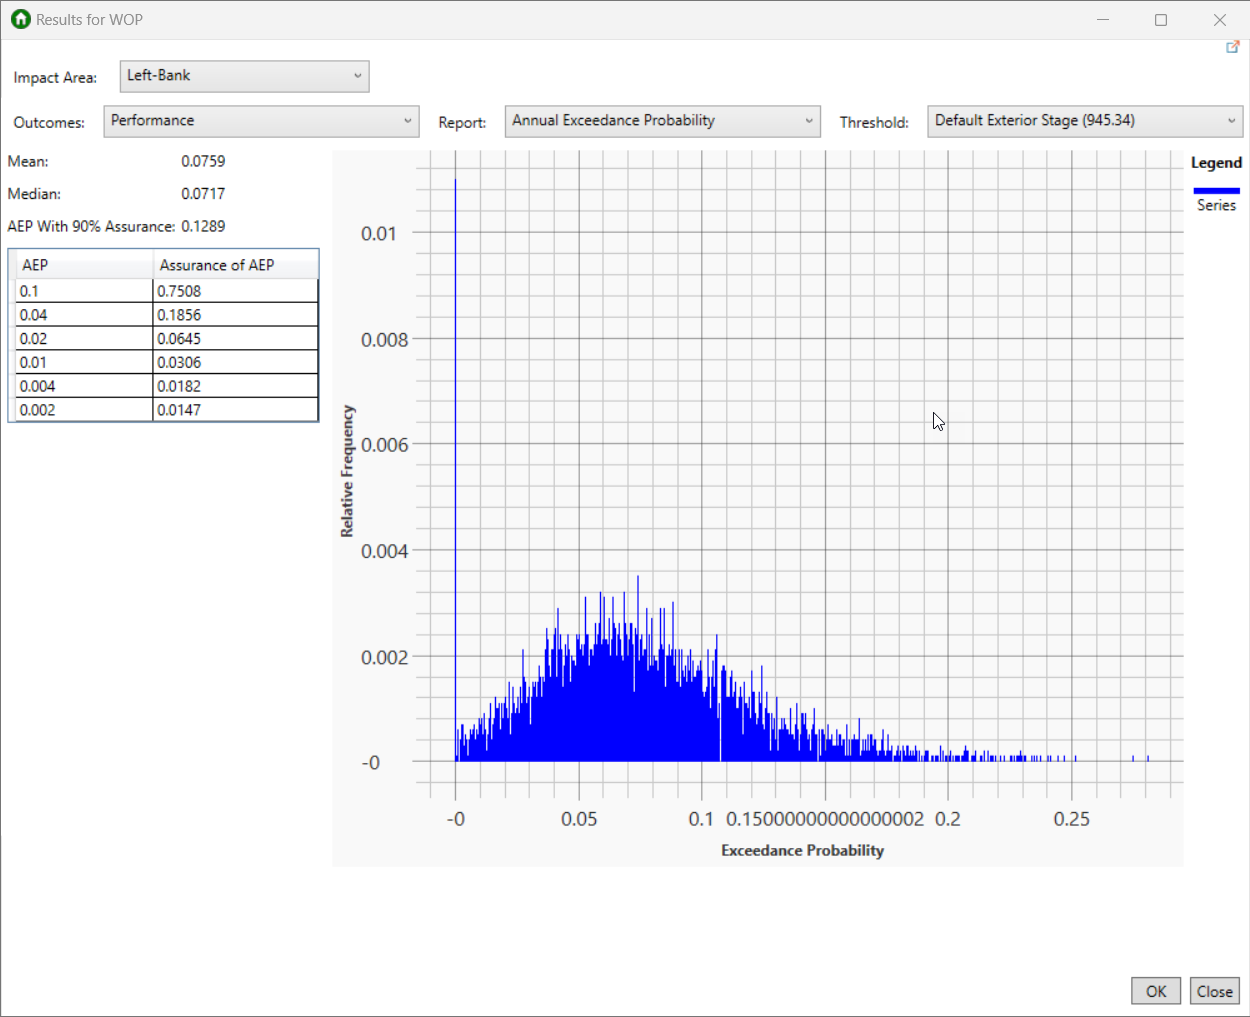
- For impact areas without lateral structures and if the scenario reflects the with-project condition, use without-project condition scenario performance results to identify the threshold stage. Obtain the without-project condition threshold stage calculated for the same impact area and analysis year. Using the same threshold for both the without- and with-project conditions of the same analysis year where no levees are present correctly results in changes to system performance metrics through modifications to hydrology or hydraulics. System performance changes are not modeled for nonstructural alternatives. To view the target threshold value, from the Study Tree, right-click on the without project scenario (for the correct analysis year), and select Compute Scenario if results have not yet been computed, otherwise right-click on the scenario and view results. The Compute Log opens to display the compute progress. Once complete, click Yes to view the results. Select the appropriate impact area, and the Performance outcomes. Note that the calculated Threshold value is displayed for the selected impact area. Return to the Create New Scenario dialog and enter the identified threshold stage for the corresponding impact area.
Important Note:
If the scenario is a with-project scenario then you must manually enter the Threshold Stage for all impact areas that do not have a lateral structure. This threshold stage is the "Target Stage" (or project performance threshold value) that is calculated for the without-project scenario for the corresponding analysis year and impact area.
- For impact areas with lateral structures, the software automatically identifies the threshold.
- Once all the required (noted with a red * asterisk) summary relationships and parameters have been selected for each impact area the impact area tab displays a green
 checkmark.
- Another option in the scenario editor is the ability to add additional thresholds. Additional thresholds could be handy for nonstructural alternatives to be able to report performance for differentially elevated structures. To add thresholds, click the Additional Thresholds button and from the System Performance Thresholds dialog click Add to add new rows to the thresholds table and enter a stage value. Repeat this process to add more thresholds. To remove an entered threshold, select the row you want to delete and click Remove. Once finished, click OK.
- Click the Preview Compute button to view damage frequency function and deterministic calculations of EAD and AEP. Spend time inspecting the overlap across the summary relationships. Lack of overlap is a significant problem that means that modeling conditions and assumptions are inconsistent between hydrology, hydraulics, or economics and the resulting risk compute will produce bad results.

- When finished, click Save and Close to create the new scenario.
Total Risk Scenarios
In addition to the normal FDA study requirements, when creating total risk scenarios the following must also be added to your study:
- A second hydraulic dataset for the non-failure situation for the interior flooding that would occur in the floodplain if the levee does not fail (e.g., is overtopped or outflanked).
- A second set of aggregated stage-damage functions calculated using the non-failure hydraulic dataset.
To create a scenario that calculates total risk:
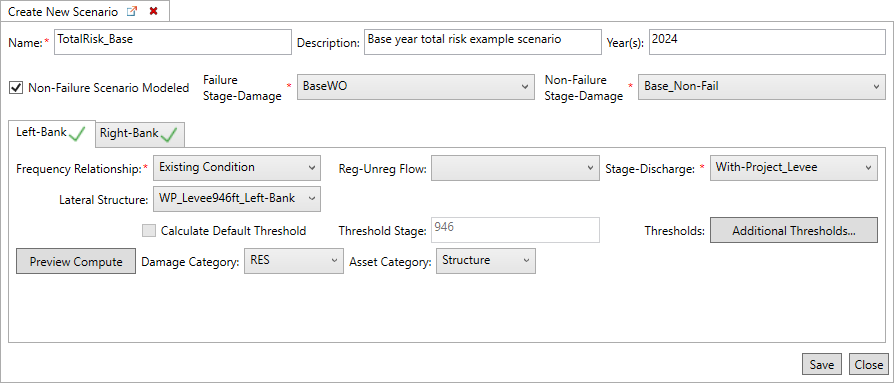
- From the Study Tree, right-click on Scenarios and select Create New Scenario.
- Enter the name, description and analysis year for the scenario.
- Enable the Non-Failure Scenario Modeled option, by checking the checkbox. Note, the Create New Scenario dialog updates to include two stage-damage lists. One list for the Failure Stage-Damage function and one for the Non-Failure Stage-Damage function.
- Next, complete the scenario as you normally would by making sure you select the correct summary relationships and parameters required for each impact area (see the Typical Scenarios section for detailed steps). Users must remember to include the lateral structure for the appropriate impact area as HEC-FDA does not check that a lateral structure is selected when the non-failure scenario modeled option is enabled.
- Once all the required (noted with a red * asterisk) summary relationships and parameters have been selected for each impact area the impact area tab displays a green
 checkmark.
- Click the Preview Compute to view damage frequency function and deterministic calculations of EAD and AEP.
- If desired, use the Additional Thresholds button to add thresholds to the scenario.
- When finished, click Save and Close to create the new scenario.
Compute and View Results
- To compute a specific scenario, from the Study Tree, right-click on the scenario and select Compute Scenario. For example, to view the target threshold value, from the Study Tree, right-click on the without project scenario (for the correct analysis year), and select Compute Scenario. The Compute Log opens to display the compute progress.

Alternatively, users can compute multiple scenarios at once by right-clicking on Scenarios from the Study Tree and selecting Compute Scenarios. A dialog opens that provides checkboxes to select specific scenarios to compute, or use the Select All option to compute all the scenarios at once.

- Once the compute is complete, click Yes to view the results.
- Select the type of report - Expected Annual Damage or Project Performance, and select result of interest. For example, to identify the target stage for a with-project scenario, select the appropriate impact area, and the Performance outcomes. Note that the calculated Threshold value is displayed for the selected impact area.
- Then, return to the Scenario dialog and enter the identified threshold stage for the corresponding impact area.

See Scenario Results for more information.
Quick Tips
- Create a scenarios overview table detailing the input summary relationships and parameters required for each scenario, impact area, analysis year combination (please see the example table provided below).Scenarios Overview Table - Example Study
Scenario Name
Analysis Year Stage-Damage Functions Frequency Relationship Stage-Discharge Lateral Structures Target Threshold WOP_Base 2024 BaseWO Existing Conditions Without-Project None Left-Bank:
Right-Bank:WOP_Future 2054 FutureWO Existing Conditions Without-Project None Left-Bank:
Right-Bank:Levee_Base 2024 BaseWO Existing Conditions With-Project_Levee Left-Bank: (Levee)
Right-Bank: NoneLeft-Bank:
Right-Bank:Levee_Future 2054 FutureWO Existing Conditions With-Project_Levee Left-Bank: (Levee)
Right-Bank: NoneLeft-Bank:
Right-Bank:NS_Base 2024 BaseYear_WP Existing Conditions Without-Project None Left-Bank:
Right-Bank:NS_Future 2054 FutureYear_WP Existing Conditions Without-Project None Left-Bank:
Right-Bank:Levee_NS_Base 2024 BaseYear_WP Existing Conditions With-Project_Levee Left-Bank: (Levee)
Right-Bank: NoneLeft-Bank:
Right-Bank:Levee_NS_Future 2054 FutureYear_WP Existing Conditions With-Project_Levee Left-Bank: (Levee)
Right-Bank: NoneLeft-Bank:
Right-Bank: - Create and compute your without project base and future year scenarios first. Add the threshold values to the scenarios overview table. This will make determining the threshold values for impact areas without lateral structures easier for the with-project scenarios.
- Use the Preview Compute to view the series of plots. Which provides the deterministic estimate for the Expected Annual Damage (EAD) and the summary input relationships. The series of plots can be very helpful as you can inspect the plots (starting in the top right and moving counter-clockwise) to verify that there's substantial overlap between the dependent variable in the first plot and the independent variable in the next plot. If not, there might be a flaw in the modeling and information is being lost.