Chapter 1 - Stage-Only, No Uncertainty, Quick Setup
This chapter introduces the HEC-FDA 2.0 software in the context of a United States Army Corps of Engineers (USACE) flood risk reduction study. A step-by-step example of how to build a base-year, without-project condition HEC-FDA 2.0 model is provided without uncertainty.
Background
A USACE study has been initiated in Sum City to address an existing flood risk problem. An estimate of existing economic risk is needed to inform plan formulation. With the provided information, an HEC-FDA 2.0 model of economic risk will be developed.
Several weeks into the study, a base-year, existing conditions hydraulics model is produced using the Hydrologic Engineering Center's (CEIWR-HEC) River Analysis System (HEC-RAS) software and provided to the Economist. A terrain and eight annual exceedance probability (AEP) flood events are provided and the economist is to produce an early assessment of flood risk.
The goal is to produce an estimate of economic damages geospatially as quickly as possible with the available data.
Learning Objectives
- Identify basic data needs.
- Import required data.
- Create an Aggregated-Stage Damage Function.
- Create a Scenario.
- Provide the foundation for HEC-FDA 2.0 model building in a USACE plan formulation context.
- Interpret results of early modeling.
Model Inputs
Some inputs require the Economist to procure and curate. Those inputs include:
- Impact Area
- Occupancy Type
- Structure Inventory
Some inputs are provided by the HEC-RAS modeler. Those inputs include:
- Terrain
- Hydraulic Model
- Frequency Function
Impact Area
Impact areas consist of boundaries around given regions within the study area and there can be one or more Impact areas in an HEC-FDA 2.0 model. The study area extents can be obtained from the Plan Formulator.
The number of impact areas and how to delineate them is determined through discussion between the HEC-RAS modeler and the Economist. In this example, study area is defined by the area circled in the image below.

For the first estimate of economic damages, a single impact area can be utilized.
Occupancy Types
Occupancy type data consists of depth-percent damage relationships for structures and other assets. The Economist should have access to occupancy type data that is appropriate for regional studies through district or MSC economic resources. Occupancy type data can also contain information about the uncertainty around first floor elevation, structure value, and other asset values.
For the first estimate of economic damages, occupancy types without uncertainty will be utilized. In this case, the relationships are derived from regionally developed occupancy type data as shown below.

Structure Inventory
A structure inventory provides an account of structures and other economic assets with many relevant attributes for estimating economic risk in the study area when combined with information about where flooding occurs. For this study, the structure inventory was obtained from the USACE National Structure Inventory (NSI) database. The locations of the structures are shown as yellow dots in the image below.

Terrain
The terrain data provides ground surface elevations across the study area. The ground surface elevations are compared to the water surface elevations in the hydraulic model to determine depth on inundation at the structures.
The terrain is provided by the HEC-RAS modeler and should be the same terrain utilized in the HEC-RAS model. HEC-FDA 2.0 will accept terrain files as TIFF or HDF files. In this example, a TIFF file is utilized.
Hydraulic Model
The hydraulic model provides water surfaces elevations across the study area for a set of AEP events. The water surface elevations are compared to the ground surface elevations in the terrain data to determine depth of inundation at the structures.
The hydraulic model is provided by the HEC-RAS modeler. HEC-FDA 2.0 will accept hydraulic models as steady or unsteady HDF files, or gridded rasters as TIFF files. In this chapter, gridded rasters will be utilized.
Frequency Function
The frequency function is the relationship between AEP and either stage or discharge at the index point for a given impact area. The location of the index point is determined through discussion between the HEC-RAS modeler and the Economist.
The frequency function is combined with the consequence function to calculate expected annual damages (EAD) if the frequency function is a stage-frequency function. If the frequency function is a flow-frequency function, flows are transformed to stages through the stage-discharge function first, and then combined with the consequence function to calculate EAD.
In this chapter, a stage-frequency function is utilized. An index point was selected in coordination with the HEC-RAS modeler and is indicated by the red dot in the image below.

Model Development Steps
With the previously described inputs, an HEC-FDA 2.0 model can be developed to provide the team with an estimate of economic damages geospatially.
Create a New Study
To create a new study:
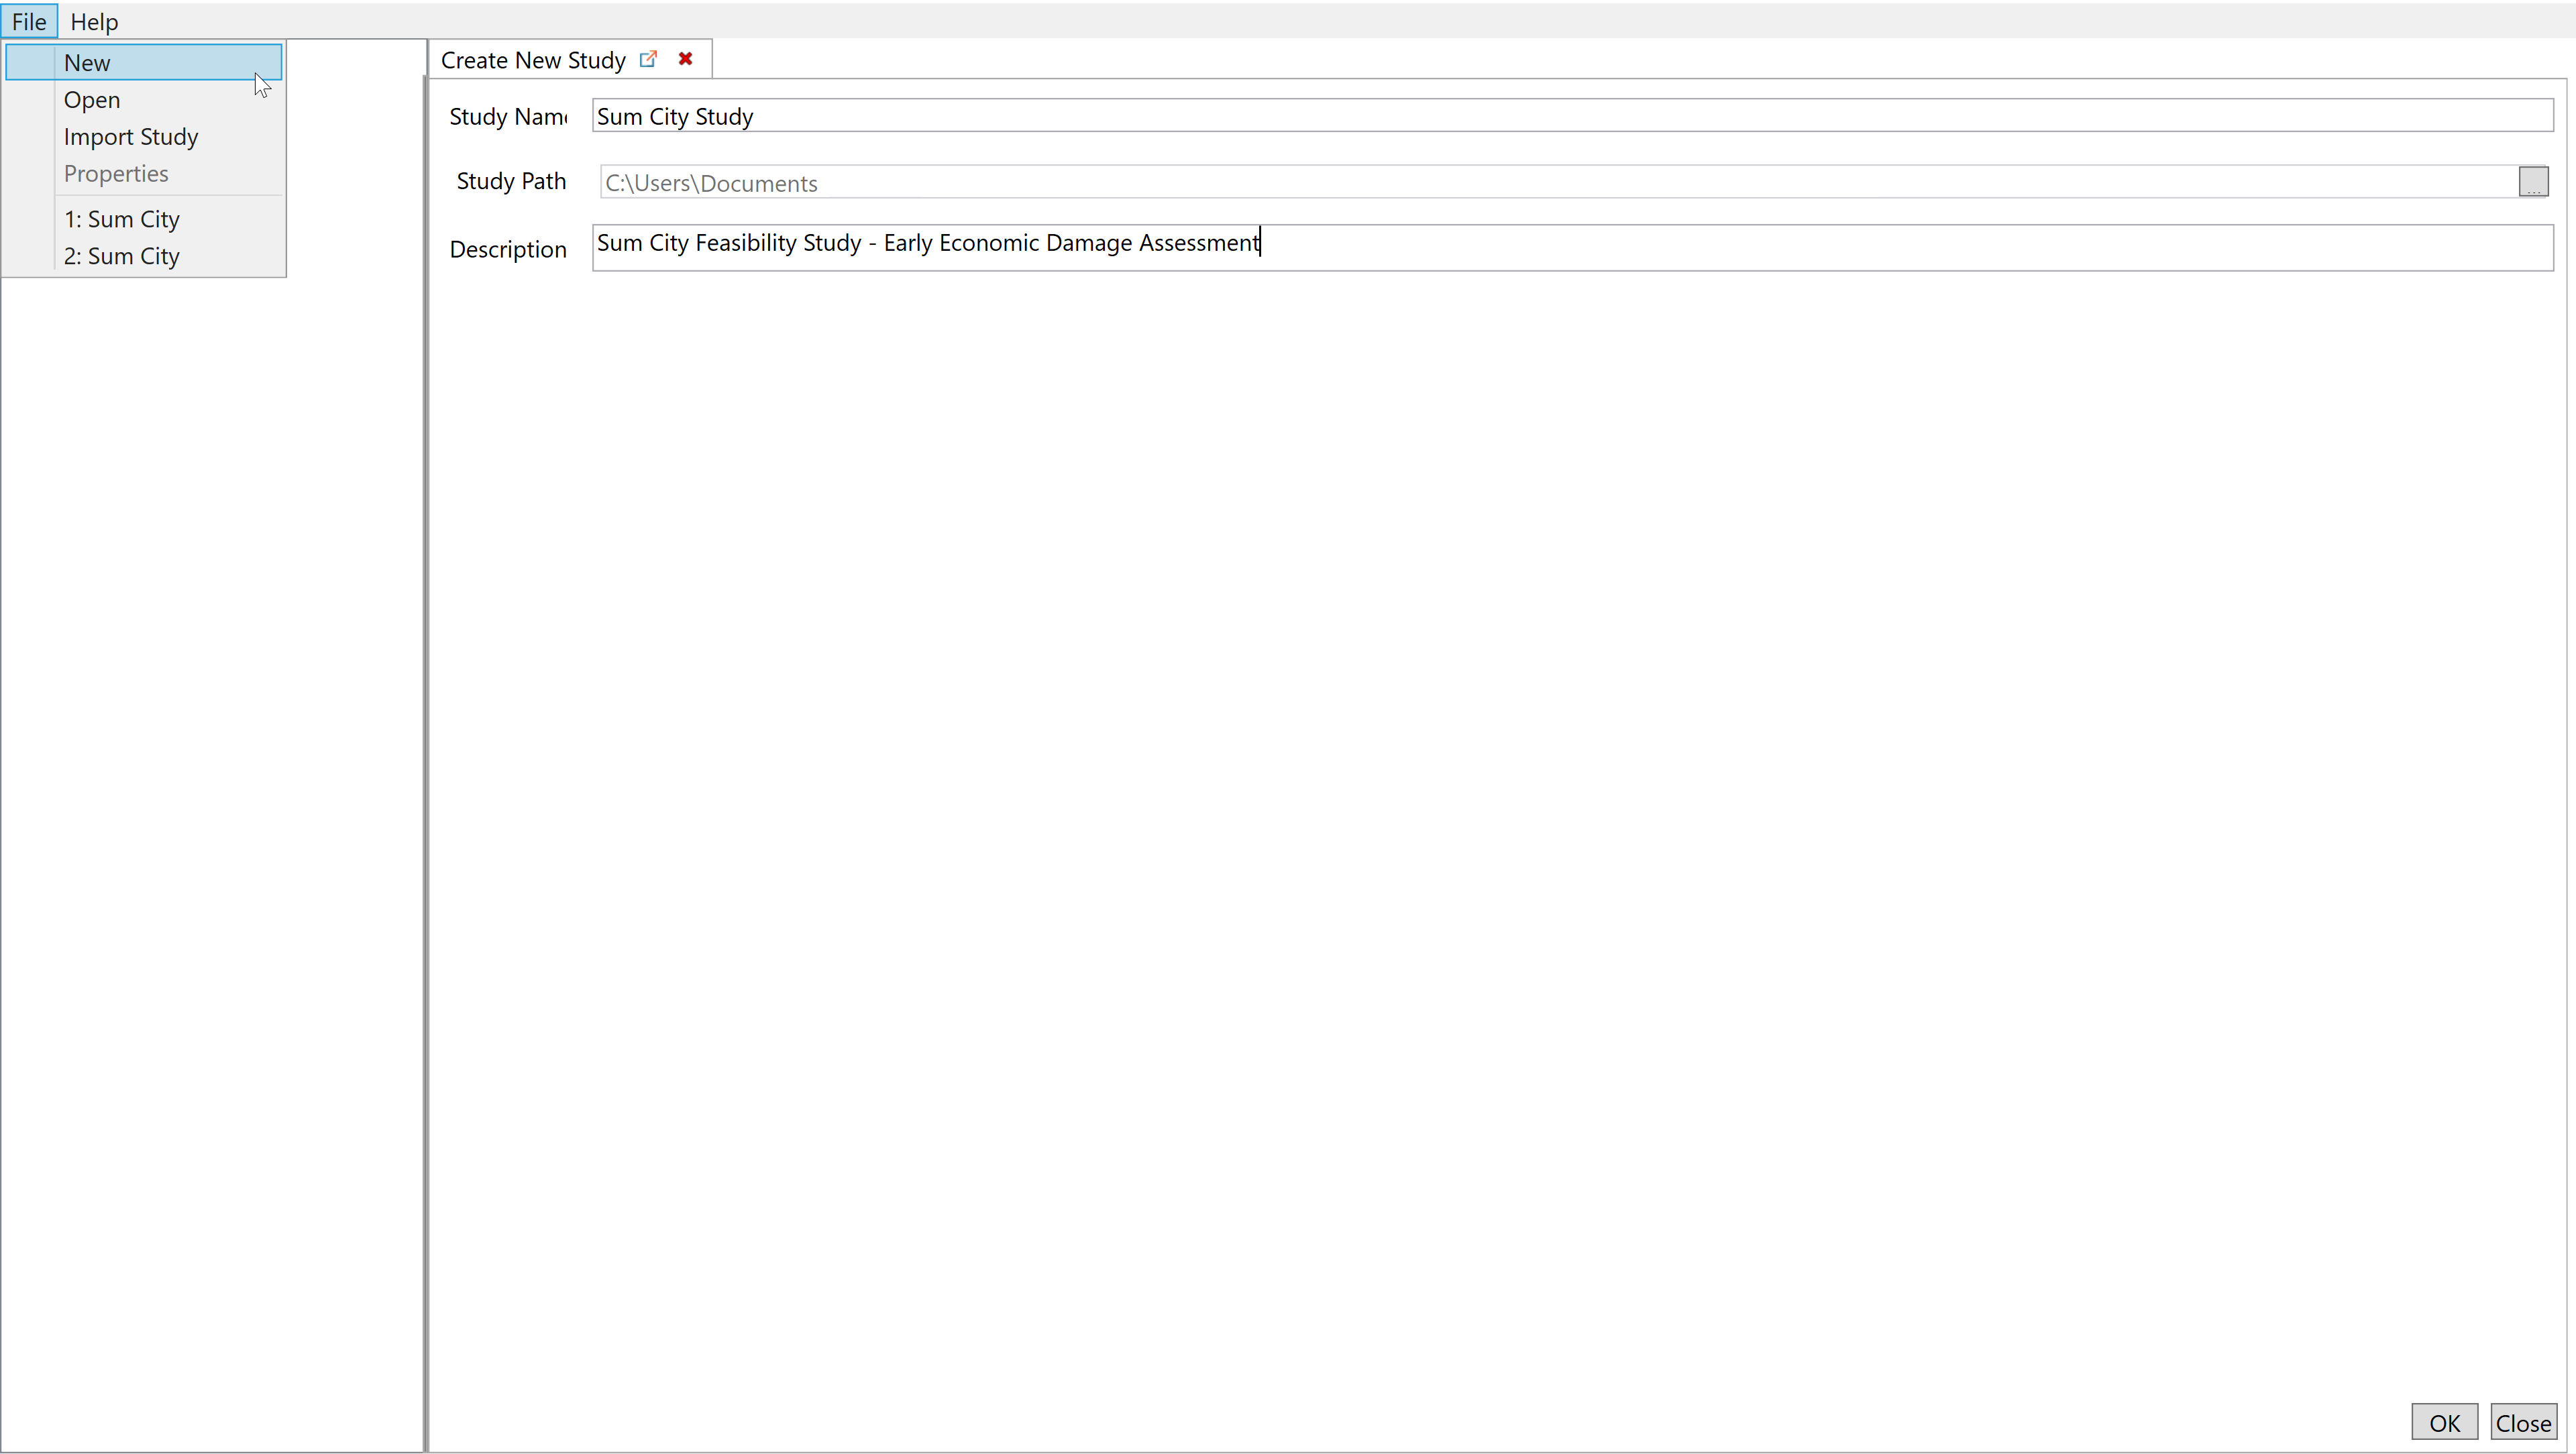
- Open the HEC-FDA 2.0 software and select File at the top left side of the window
- Select New and enter your study name in the Study Name text box
- Select a file path by selecting the ellipsis
 on the far right side of the Study Path text box and navigate to the folder in which you would like the model to be saved
 - Briefly describe the study in the Description text box
- Select OK
 at the bottom right corner of the window
Import the Terrain
To import the terrain:
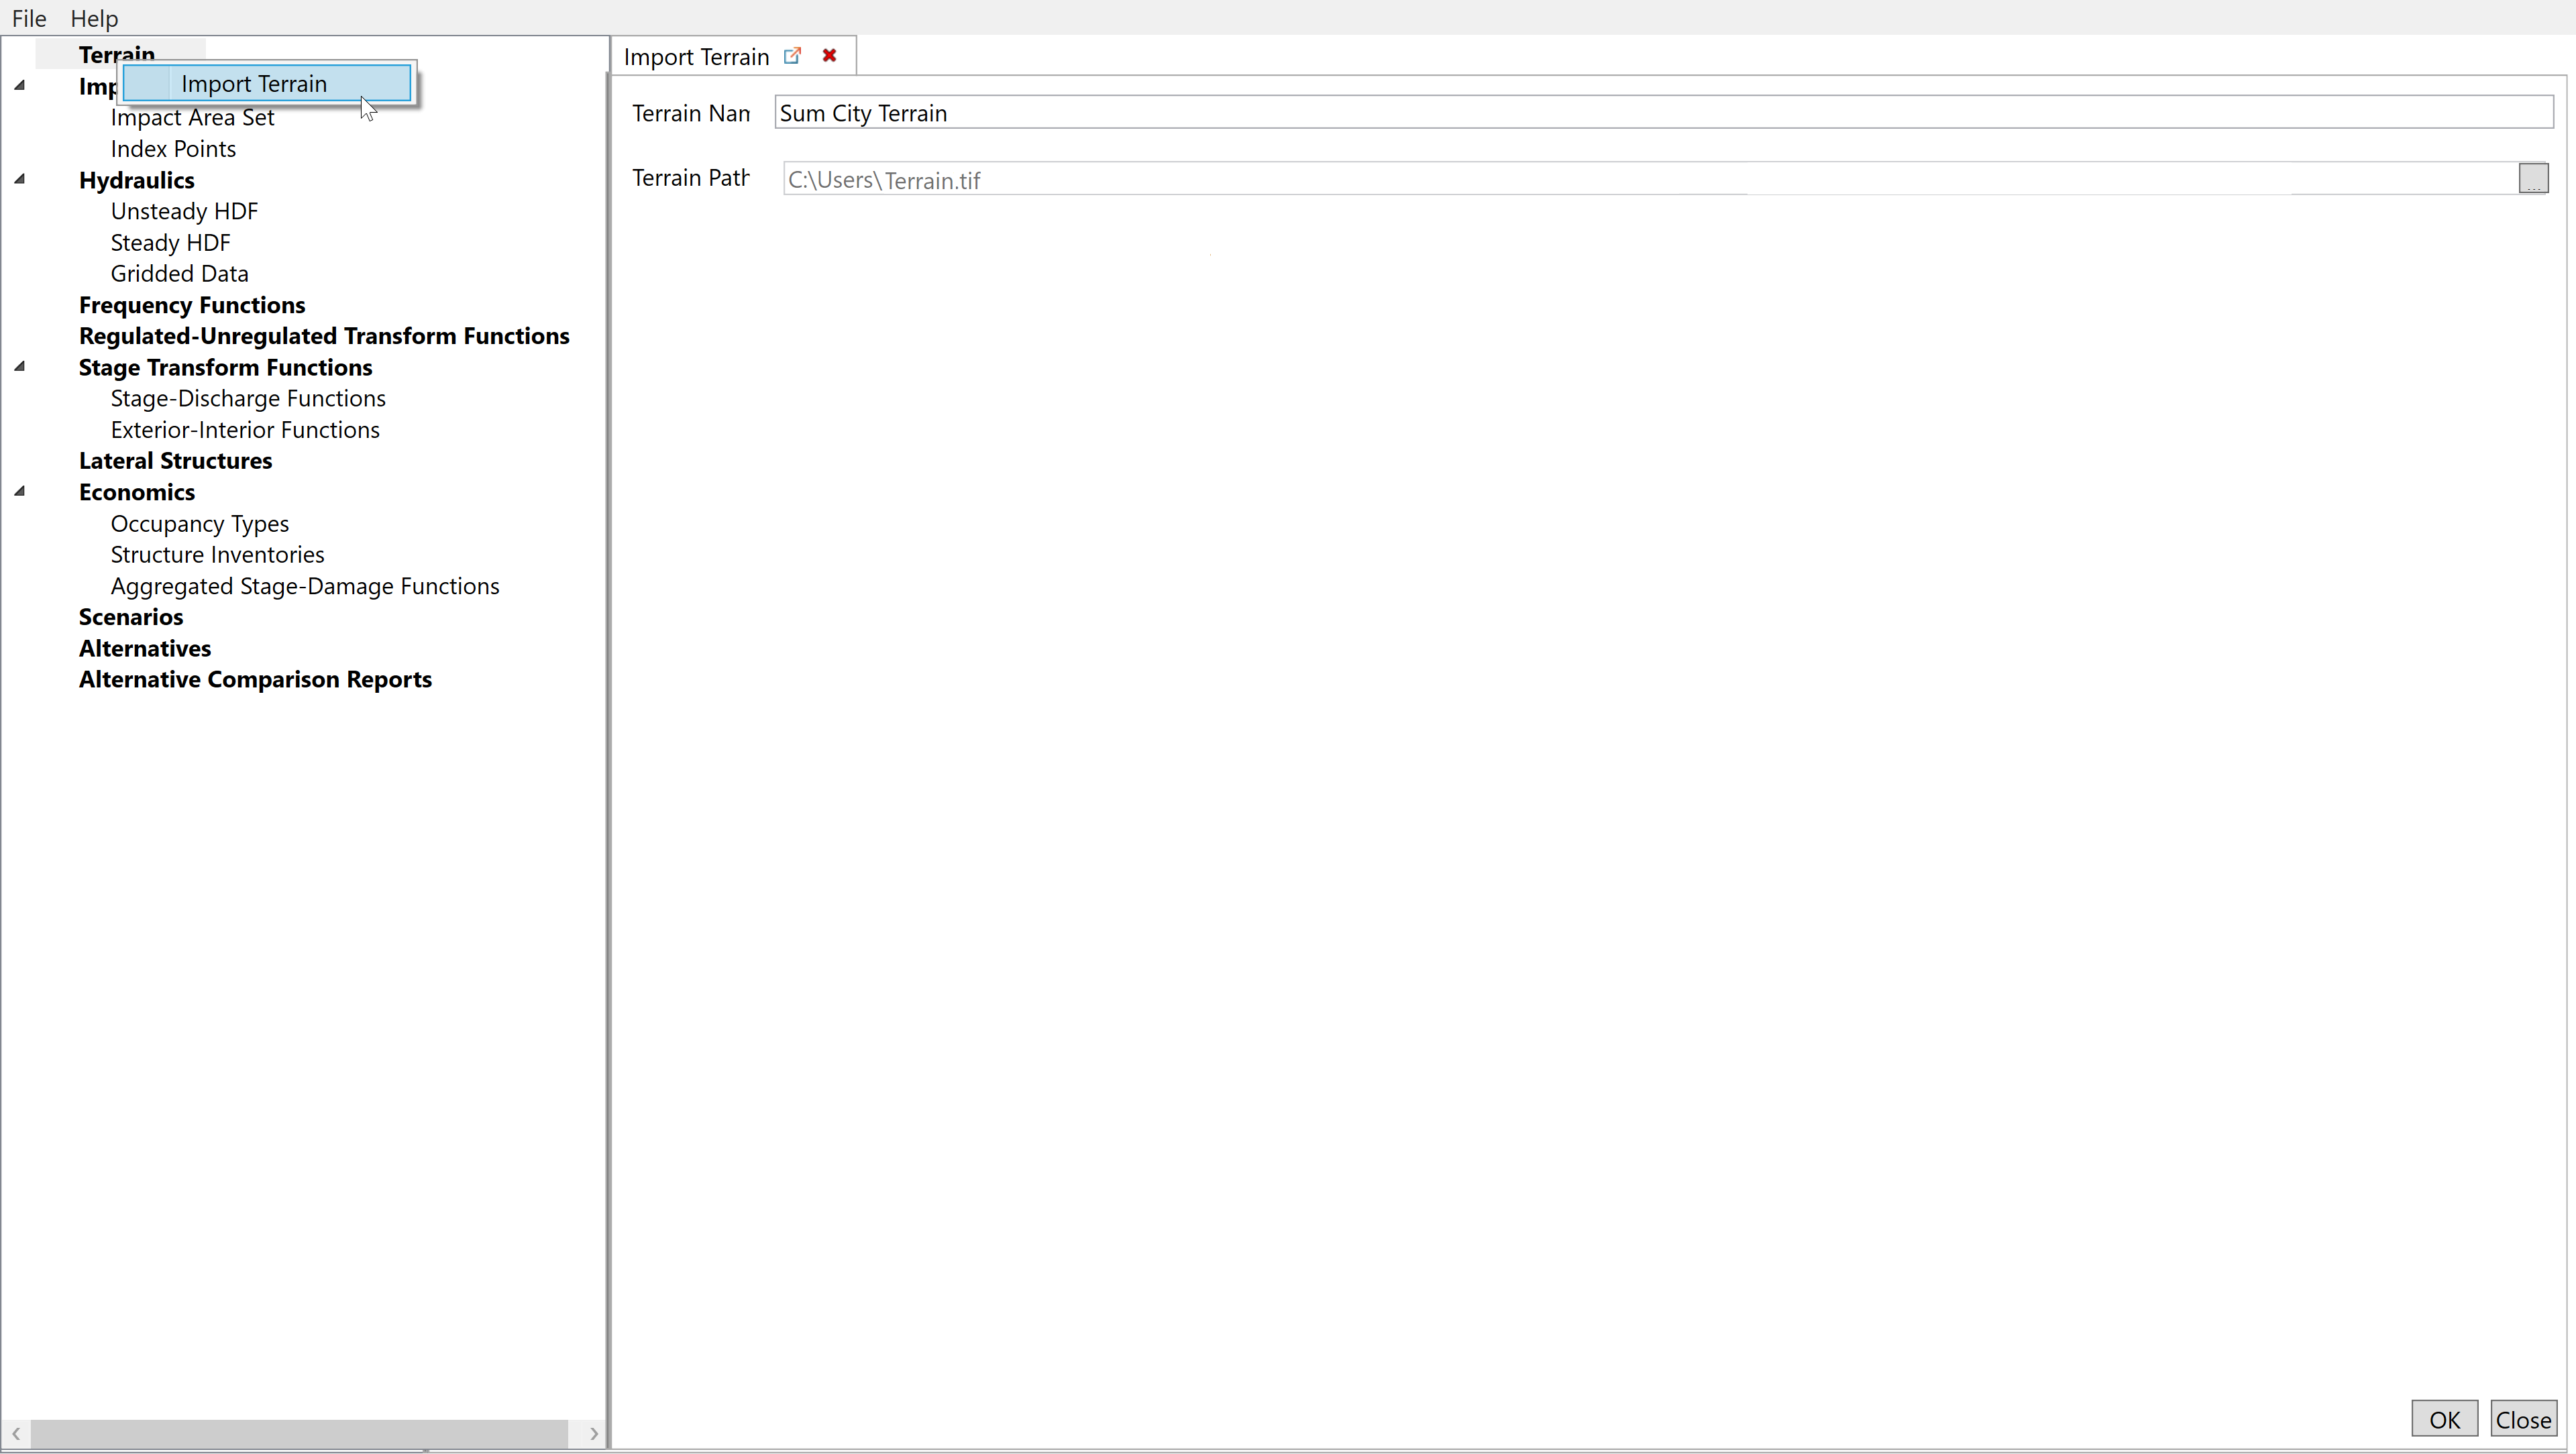
- Right-click on Terrain at the top left of the window and select Import Terrain
- Enter the terrain name in the Terrain Name text box
- Select a file path by selecting the ellipsis on the far right side of the Terrain Path text box and navigate to the folder in which you saved the terrain file
- Select OK at the bottom right corner of the window
Import the Impact Area Set
To import the impact area set:
- Right-click Impact Area Set near the top left side of the window and select Import Impact Area Set...
- Enter the impact area set name in the Impact Area Name text box
- Enter a brief description of the impact area set in Description text box
- Select a file path by selecting the ellipsis on the far right side of the Shapefile Path text box and navigate to the folder in which you saved the impact area set file
- Select the column header that contains your impact area set names from the Unique Name dropdown box
- Select OK at the bottom right corner of the window

Import Index Point (Optional)
To import the index point:
- Right-click Index Points near the top left side of the window and select Create New Index Points...
- Enter the index point name in the Index Point Name text box
- Enter a brief description of the index point in Description text box
- Select a file path by selecting the ellipsis on the far right side of the Shapefile Path text box and navigate to the folder in which you saved the index point file
- Select the column header that contains your index point names from the Unique Name dropdown box
- Select OK at the bottom right corner of the window

Import the Hydraulics
To import the gridded hydraulics:
- Right-click Gridded Data under Hydraulics on the left window pane and select Import Hydraulics...
- Enter the name of the hydraulics in the Profile Name
- Enter a brief description of the hydraulics in the Profile Description text box
- Select a file path by selecting the ellipsis on the far right side of the Source Directory text box and navigate to the folder in which you saved the hydraulic model files
- For gridded data, select the folder that contains subfolders containing the hydraulic files
- Enter the AEP or return interval for each row appropriately
- Select Save
 at the bottom right corner of the window and then Close

Note: For unsteady HDF import, separate HDFs for each AEP event need to be provided. To import, select the folder containing the HDFs in place of step 5.
For steady HDF import, a single HDF can be provided that contains all the AEP events. To import, select the HDF in place of step 5.
Enter a Frequency Function
To enter the frequency function:
- Right-click Frequency Functions and select Retrieve Graphical Frequency Function...
- Select the hydraulic dataset and index point set from the respective drop down boxes
- Select GenerateFrequencyCurves and select OK
- Right-click on the frequency function icon
 for the frequency function that was generated
 - Ensure the Graphical radio button and Stage radio button are selected
- Enter 1000000 in the Equivalent Record Length text box
- This will effectively run the model without uncertainty around stage
- Select Save at the bottom right corner of the window and then Close


Import Occupancy Types
To import the occupancy types:
- Right-click on Occupancy Types at the bottom on the left side pane and select Import Occupancy Types from Tab-Delimited Text File...
- Enter the name of the occupancy types in the Base Name text box
- Enter a brief description of the occupancy types in the Base Description text box
- Select a file path by selecting the ellipsis on the far right side of the Tab Delimited File text box and navigate to the folder in which you saved the occupancy types
- Select Import
 and select Close

Import Structure Inventory
To import the structure inventory:
- Right-click Structure Inventories and select Import from Shapefile
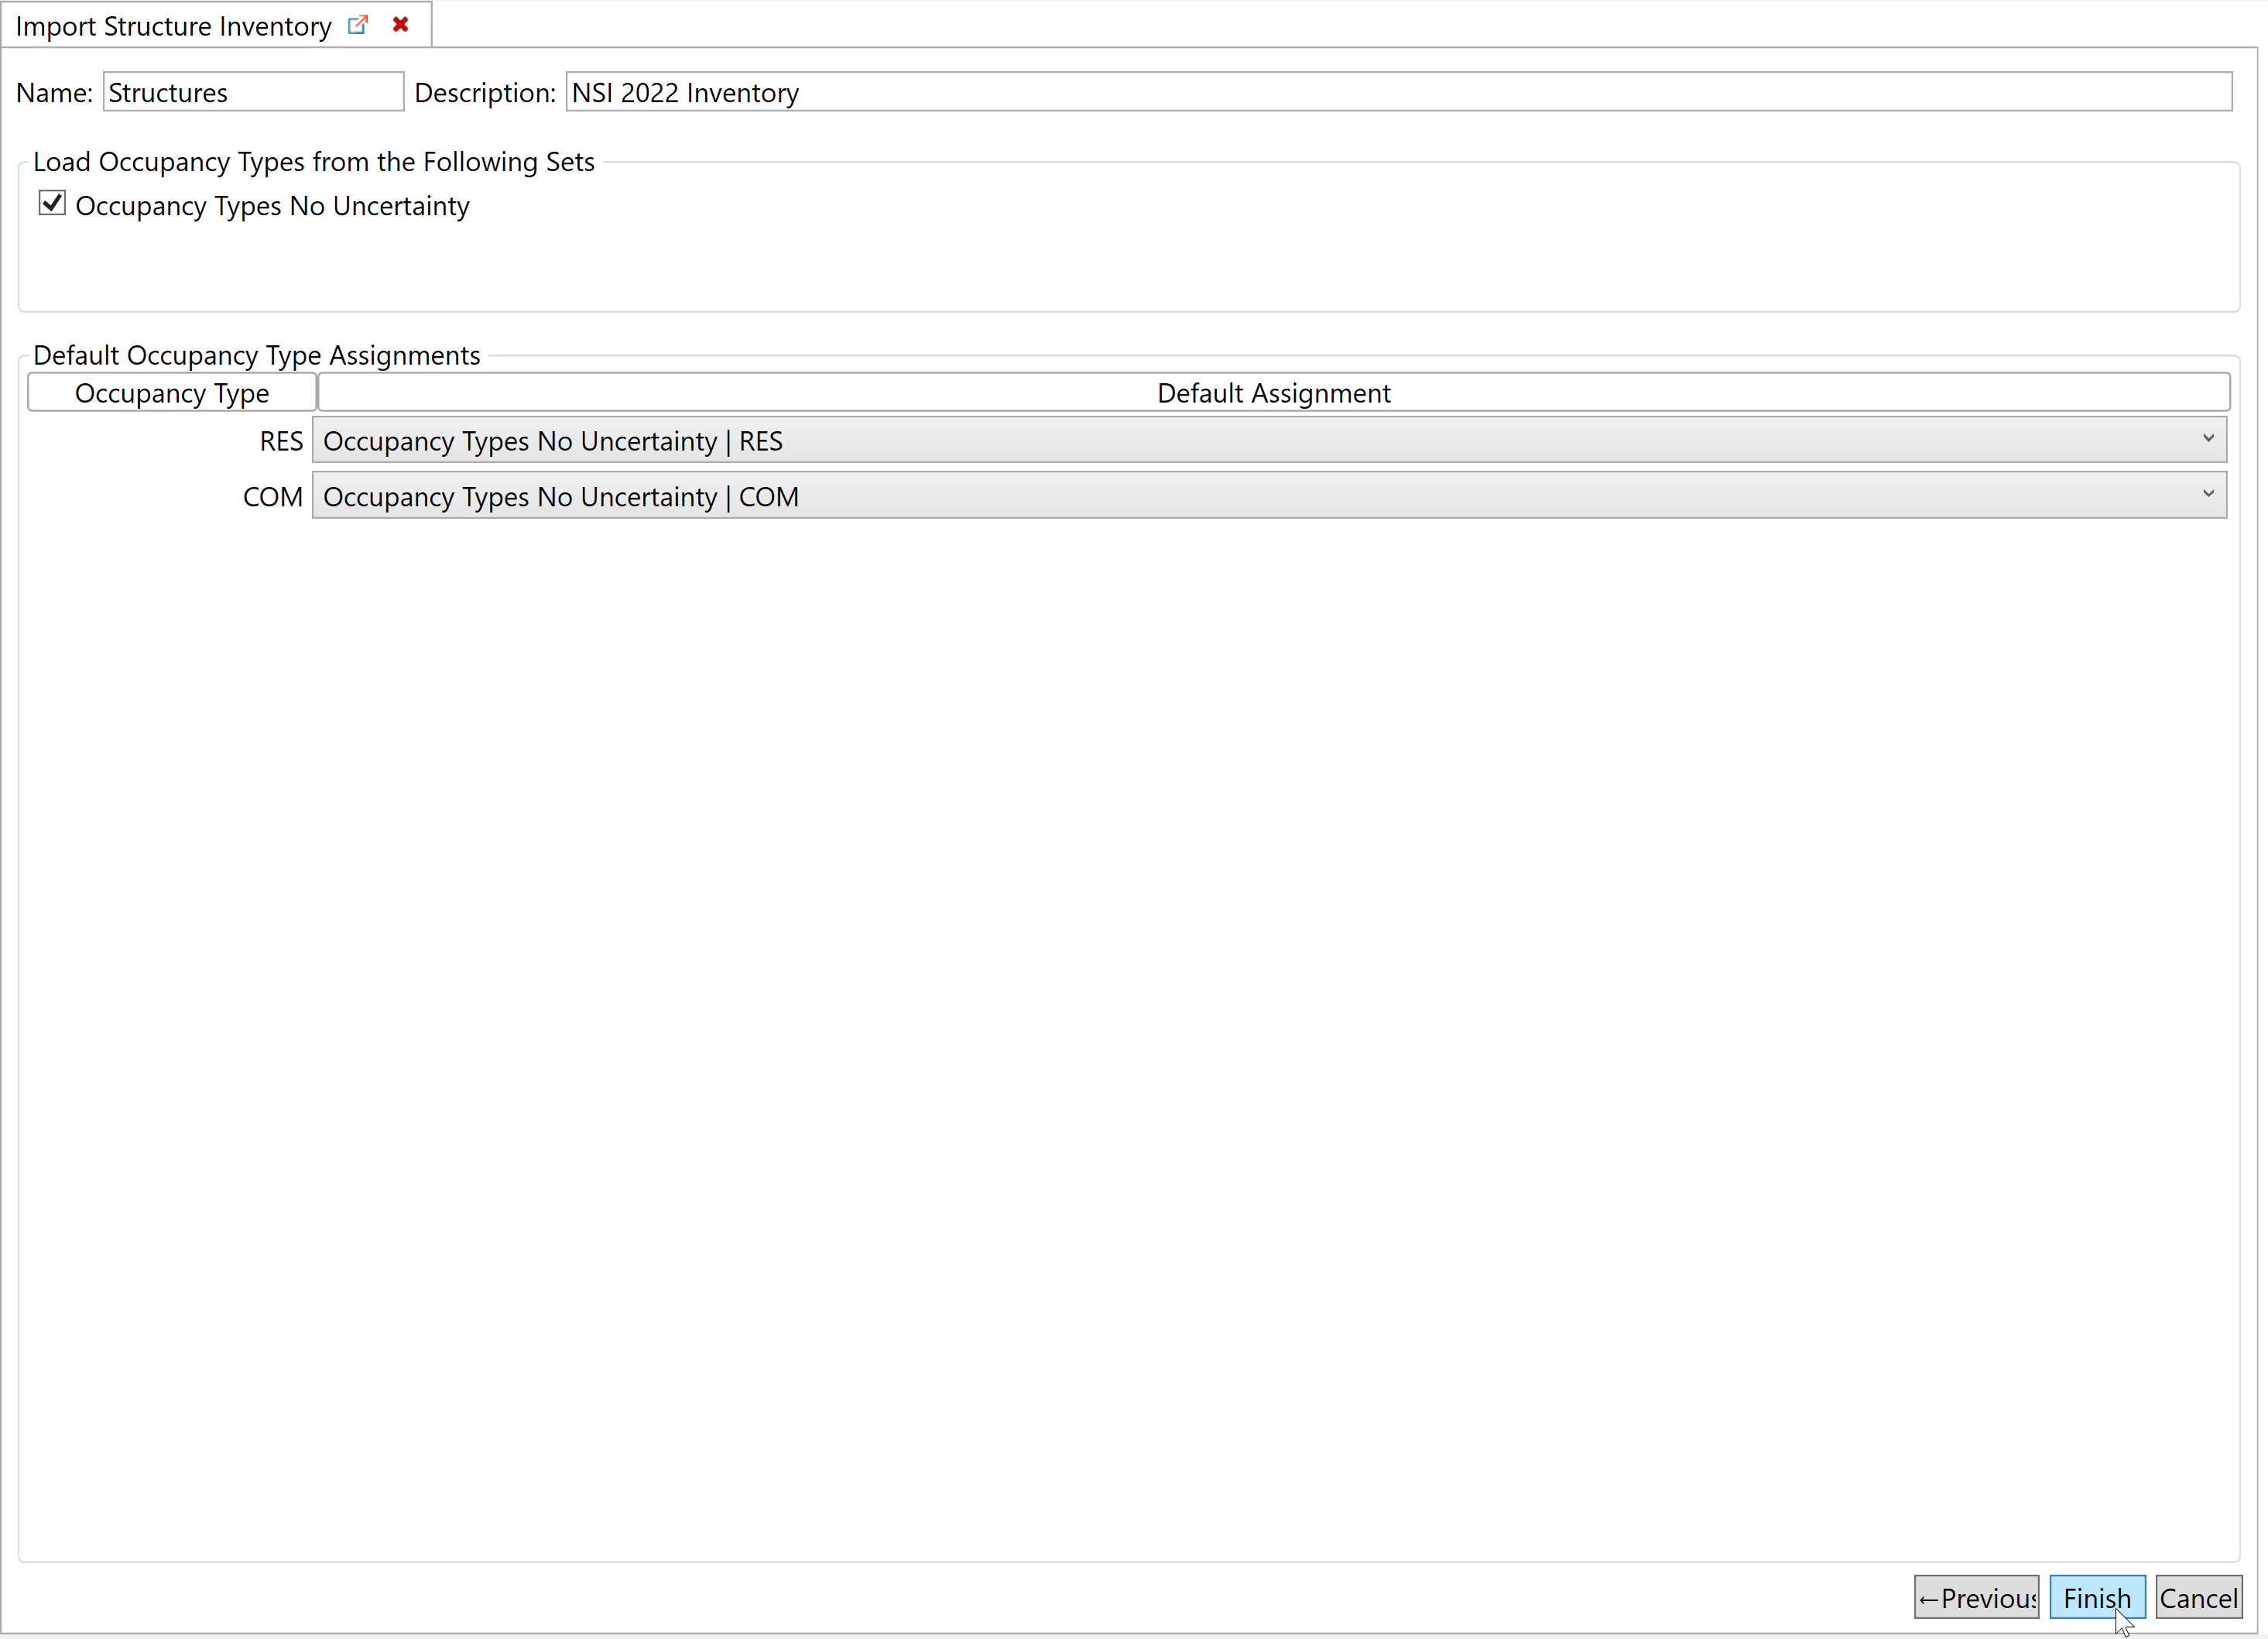
- Enter the name of the structure inventory in the Name text box
- Enter a brief description of the structure inventory in the Description text box
- Select a file path by selecting the ellipsis on the far right side of the Structure Inventory Shapefile text box and navigate to the folder in which you saved the structure inventory
- Ensure the Ground Elevation and Foundation Height radio button and From Terrain File radio button are selected
- From the dropdown boxes, select the column headers corresponding to the structure ID, occupancy type, foundation height, and structure value respectively
- Optionally, select the column headers corresponding to the other attributes listed
- Select Next

- Ensure the occupancy types from from the occupancy type data are selected in the drop-down menus correspond to the occupancy types indicated in the structure inventory
- Select Finish


Generate Aggregated Stage-Damage Function
To generate an aggregated stage-damage function:
- Right-click Aggregated Stage-Damage Functions and select Create New Stage-Damage Functions...
- Enter the name of the aggregated stage-damage function in the Name text box
- Enter a brief description of the aggregated stage-damage function in the Description text box
- Ensure the Computed radio button is selected
- Enter the appropriate analysis year in the Analysis Year text box
- Select the Water Surface Elevations and Structures from the respective drop-down boxes
- Select the generated Frequency Function from the drop-down box
- Ensure the Write Details to CSV radio button is selected
- Select Compute Curve

- Wait for the aggregated stage-damage function to generate as indicated by functions being displayed at the bottom of the window and then select Save
 and select Close

Create a New Scenario
To create a new scenario:
- Right-click on Scenarios and select Create New Scenario...
- Enter a name and description for the scenario in the respective text boxes.
- Enter the appropriate analysis year in the Year(s) text box
- Select the stage-damage function from the Stage-Damage drop-down box
- Select the frequency function from the Frequency Relationship drop-down box
- Ensure the Calculate Default Threshold radio button is selected
- Select save and select Close
- Right-click on the scenario
 that was created and select Compute Scenario...
 - Wait for the scenario to be generated and then select Yes when prompted to view the results

Results
There are two results windows to review the results: right-click on the scenario ![]() that was created and select View Results... (or by selecting Yes on Step 8 in the last section), and by right-clicking Scenarios and selecting View Summary Results.
that was created and select View Results... (or by selecting Yes on Step 8 in the last section), and by right-clicking Scenarios and selecting View Summary Results.
View Results
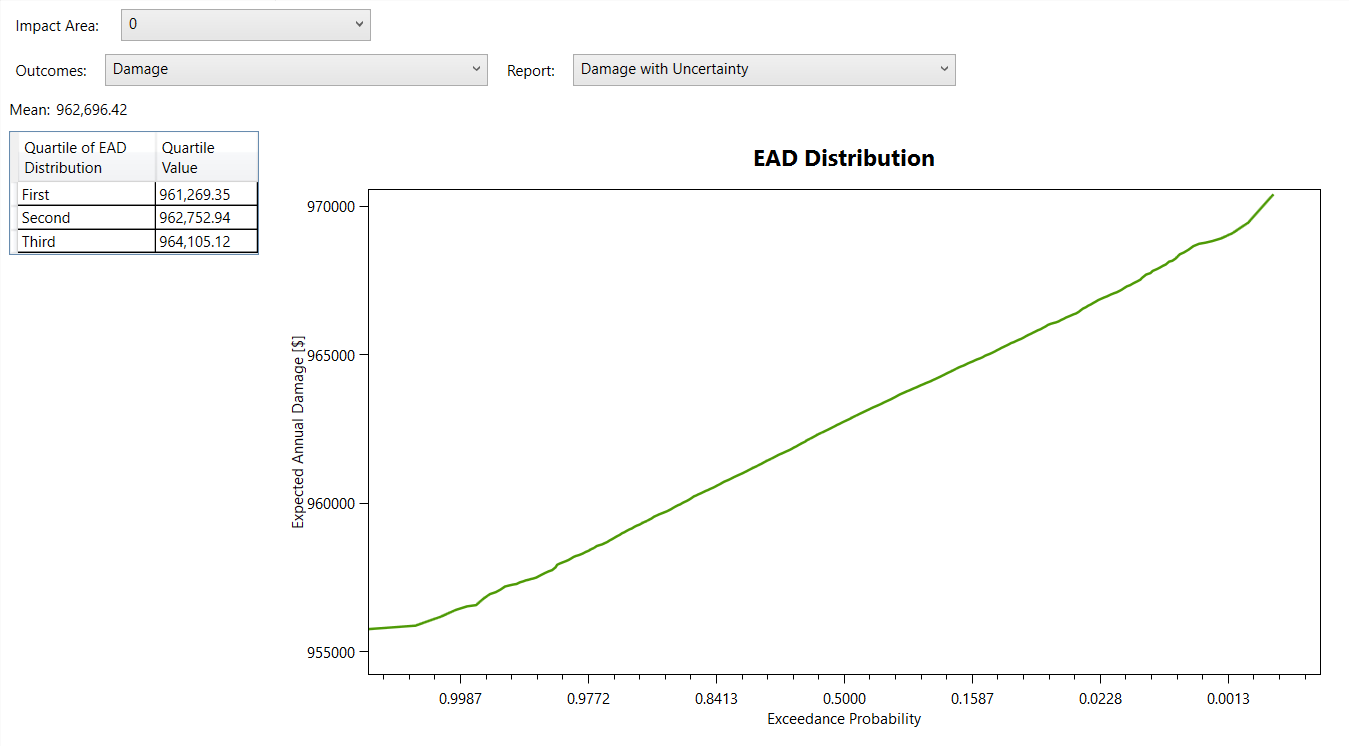
There are three drop-down menus from the Results window.
Impact Area
The impact area drop-down box allows the user to toggle between the different impact areas. In this case, there is only one impact area.
Outcomes
There are two options with the Outcomes drop-down box. The default is Damage, which displays the Report drop-down box.
When Performance is selected, the Report drop-down box allows the user to select how performance is displayed. The Threshold dropdown-box allows the user to select from among the thresholds that were selected during the creation of the scenario. In this example, the default value was calculated and there's only one. In the without-project condition, this result isn't useful.
Report
When Damage is selected in the Outcomes drop-down menu, the Report menu allows the user to select Damage with Uncertainty...
...or Damage by Damage Category.

View Summary Results
The Summary Results window displays all the information on one page from the Results window. If more than one scenario is generated, the results for all scenarios will be displayed.
