Chapter 2 - Flow, Future Condition, and Many Impact Areas
This chapter builds upon the previous chapter by introducing flow into the model, incorporating future condition hydraulics, and breaking the study area into smaller impact areas.
Background
A future condition, without-project hydraulic model has been produced and provided to the Economist. Through discussion with the HEC-RAS modeler, the study area was divided into several impact areas and index points were selected. The HEC-RAS modeler has also provided a flow-frequency function and stage-discharge function (also known as a rating curve). In some cases, it may be appropriate to proceed without modeling flow. Be sure to discuss the appropriateness of including flow in your modeling with the Flood Risk Management Planning Center of Expertise (FRM-PCX).
Learning Objectives
- Identify data needs for without-project modeling.
- Incorporate more than one impact area.
- Incorporate future condition Hydraulics and Structure Inventory.
- Create flow-frequency functions.
- Create Stage-Discharge Functions.
- Incorporate flow into HEC-FDA 2.0 modeling.
- Interpret results of without-project modeling.
Model Inputs
Impact Area
The study area has been split into many impact areas to account for differences in hydraulic and economic characteristics that impact inputs and outputs.
The image below shows the new impact areas.

Structure Inventory
The Economist has developed a future condition structure inventory that includes additional structures to account for future development.
Hydraulic Model
Two sets of hydraulic models are provided: base year and future year conditions.
Frequency Functions
Each impact area requires a frequency function, and so new index points were selected for each impact area. The frequency functions in this chapter relate flow with AEP, which also requires a stage-discharge function in order to derive EAD from the consequence function.
The new index points are indicated by the red dots in the image below.

Stage-Discharge Transform Functions
Since the frequency functions are flow-frequency, stage-discharge (ie stage-flow) relationships are required for each index point. To derive EAD from a flow-frequency function, a flow-stage relationship is the link to the stage-damage function. In this chapter, the stage-discharge functions are provided without uncertainty.
Model Development Steps
With the previously described inputs, an HEC-FDA 2.0 model can be developed to provide the team with an estimate of economic damages geospatially.
Import the Impact Area Set
To import the impact area set:
- Right-click Impact Area Set near the top left side of the window and select Import Impact Area Set...
- Enter the impact area set name in the Impact Area Name text box
- Enter a brief description of the impact area set in Description text box
- Select a file path by selecting the ellipsis
 on the far right side of the Shapefile Path text box and navigate to the folder in which you saved the impact area set file
 - Select the column header that contains your impact area set names from the Unique Name dropdown box
- Select OK
 at the bottom right corner of the window

Import Future Year Hydraulics
To import the gridded hydraulics:
- Right-click Gridded Data under Hydraulics on the left window pane and select Import Hydraulics...
- Enter the name of the hydraulics in the Profile Name
- Enter a brief description of the hydraulics in the Profile Description text box
- Select a file path by selecting the ellipsis on the far right side of the Source Directory text box and navigate to the folder in which you saved the hydraulic model files
- For gridded data, select the folder that contains subfolders containing the hydraulic files
- Enter the AEP or return interval for each row appropriately
- Select Save
 at the bottom right corner of the window and then Close

Note: For unsteady HDF import, separate HDFs for each AEP event need to be provided. To import, select the folder containing the HDFs in place of step 5.
For steady HDF import, a single HDF can be provided that contains all the AEP events. To import, select the HDF in place of step 5.
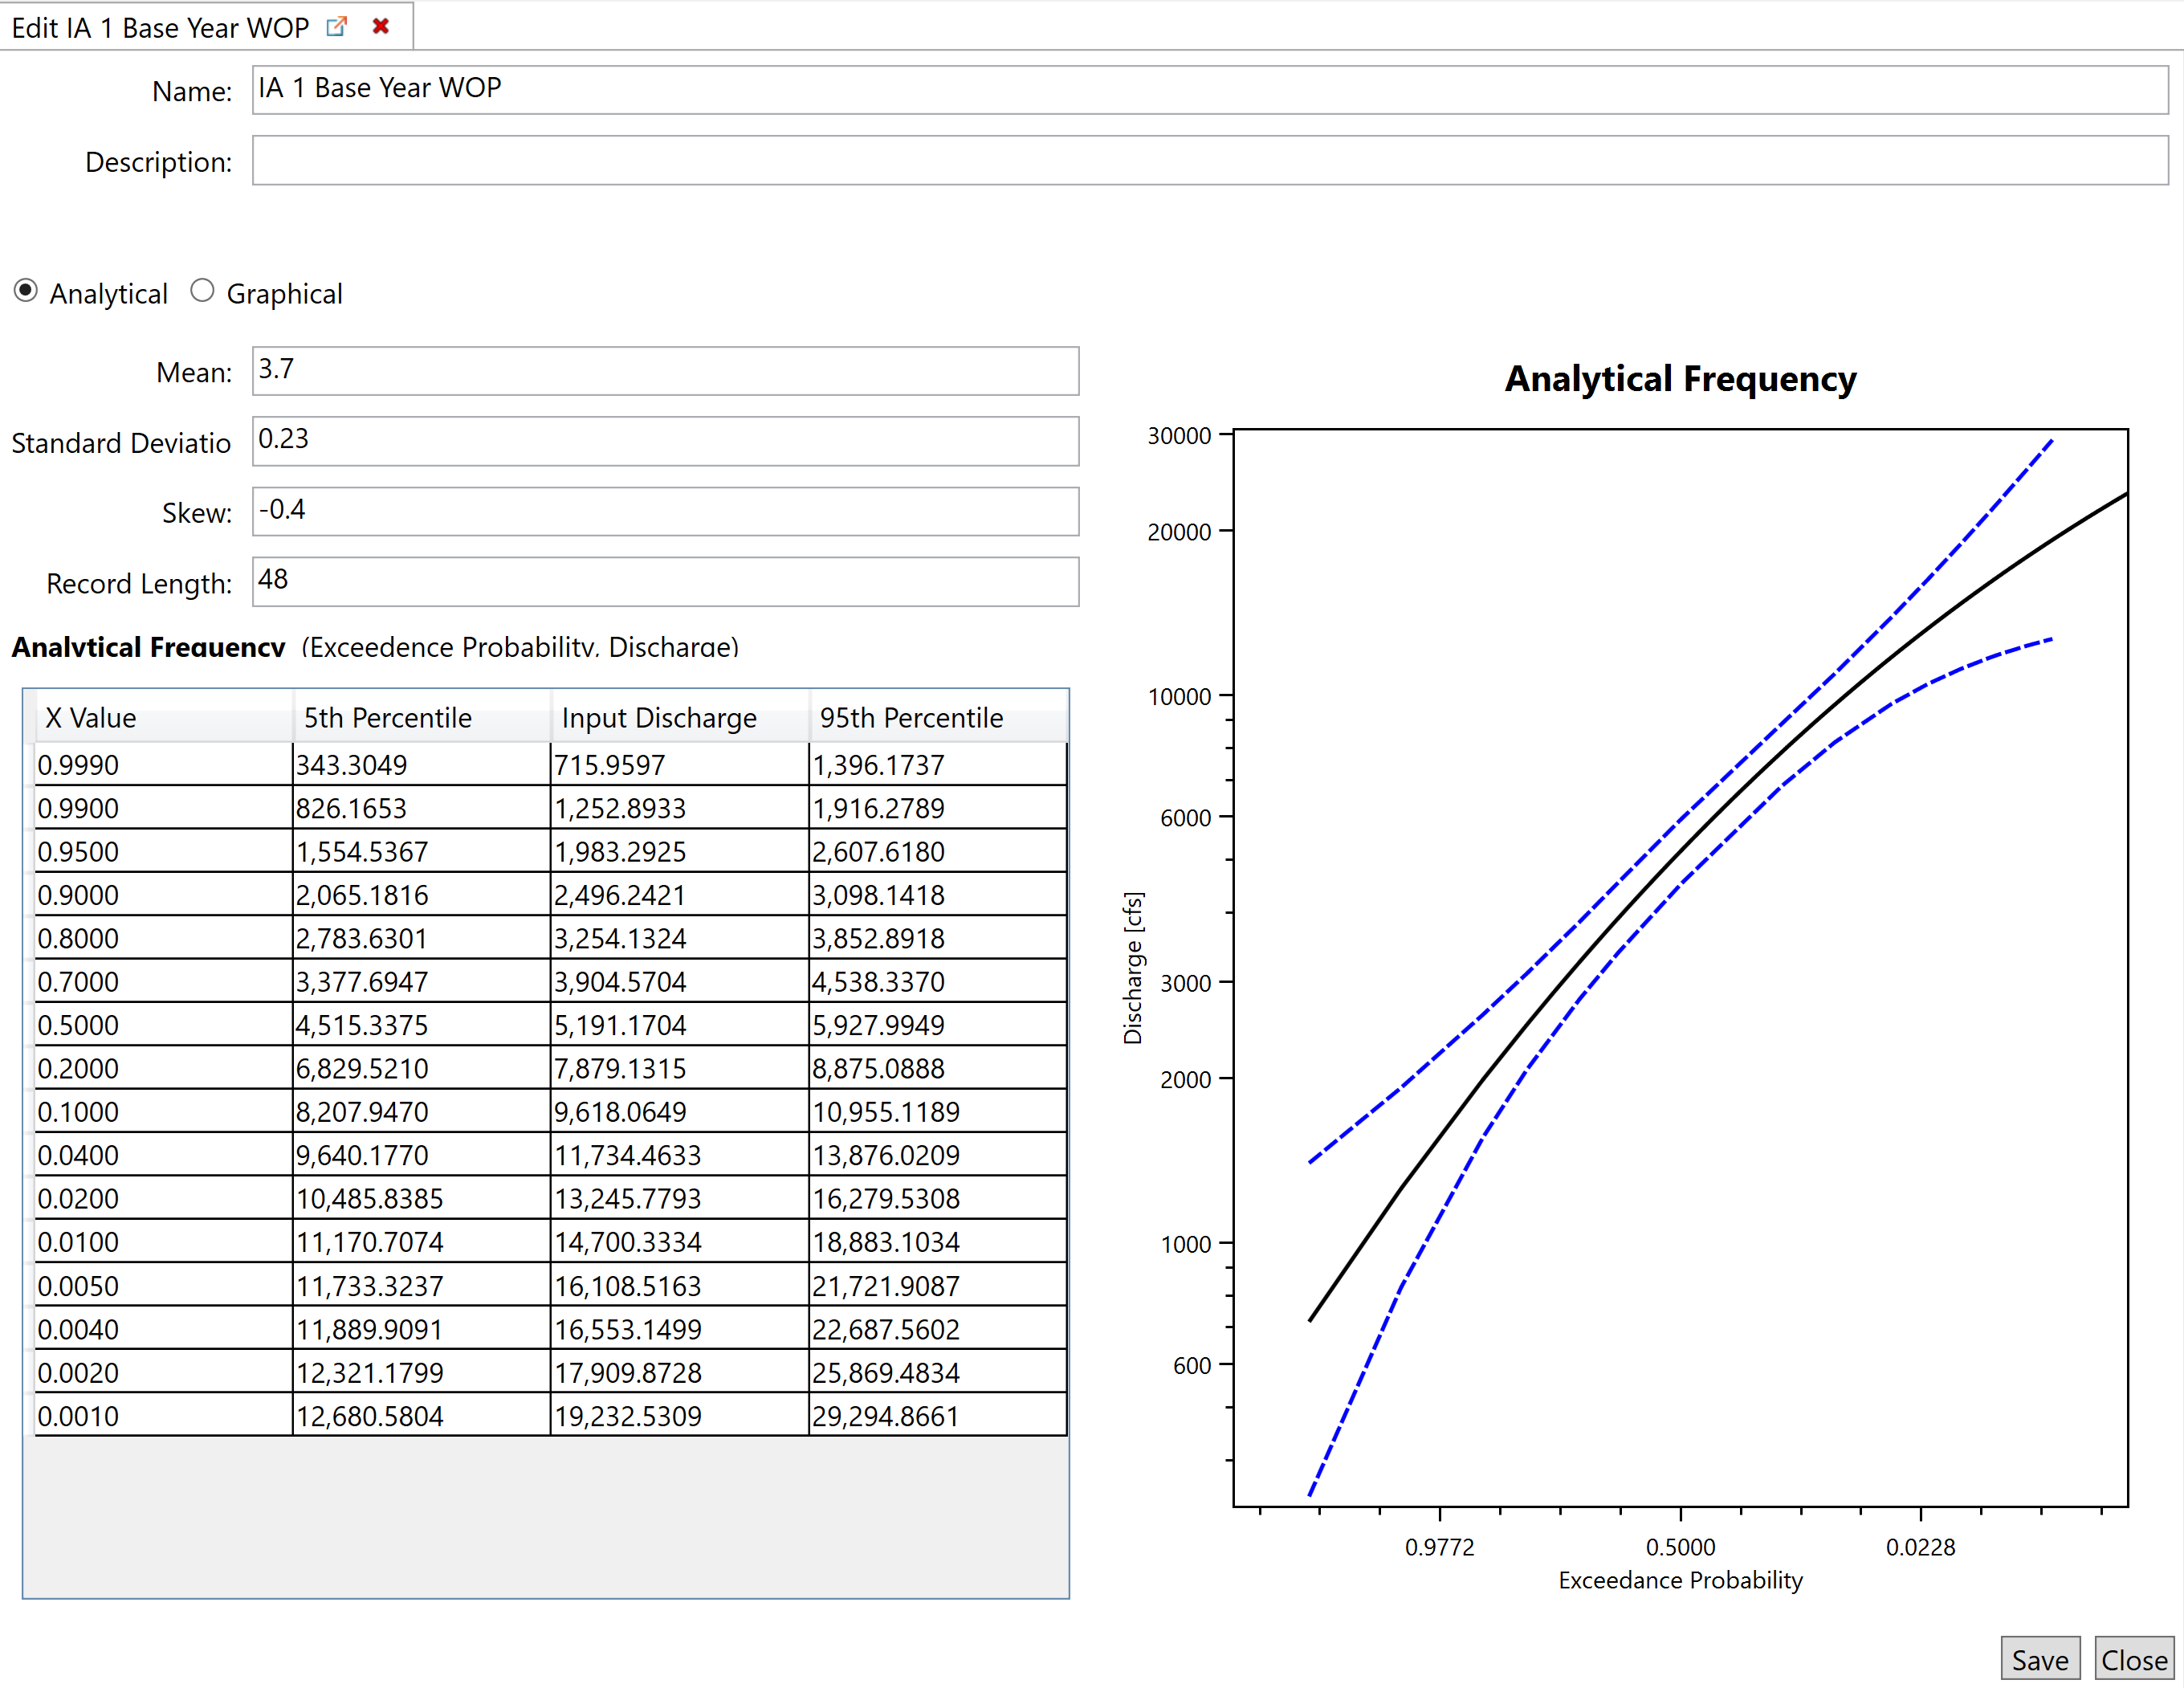
Enter Frequency Functions
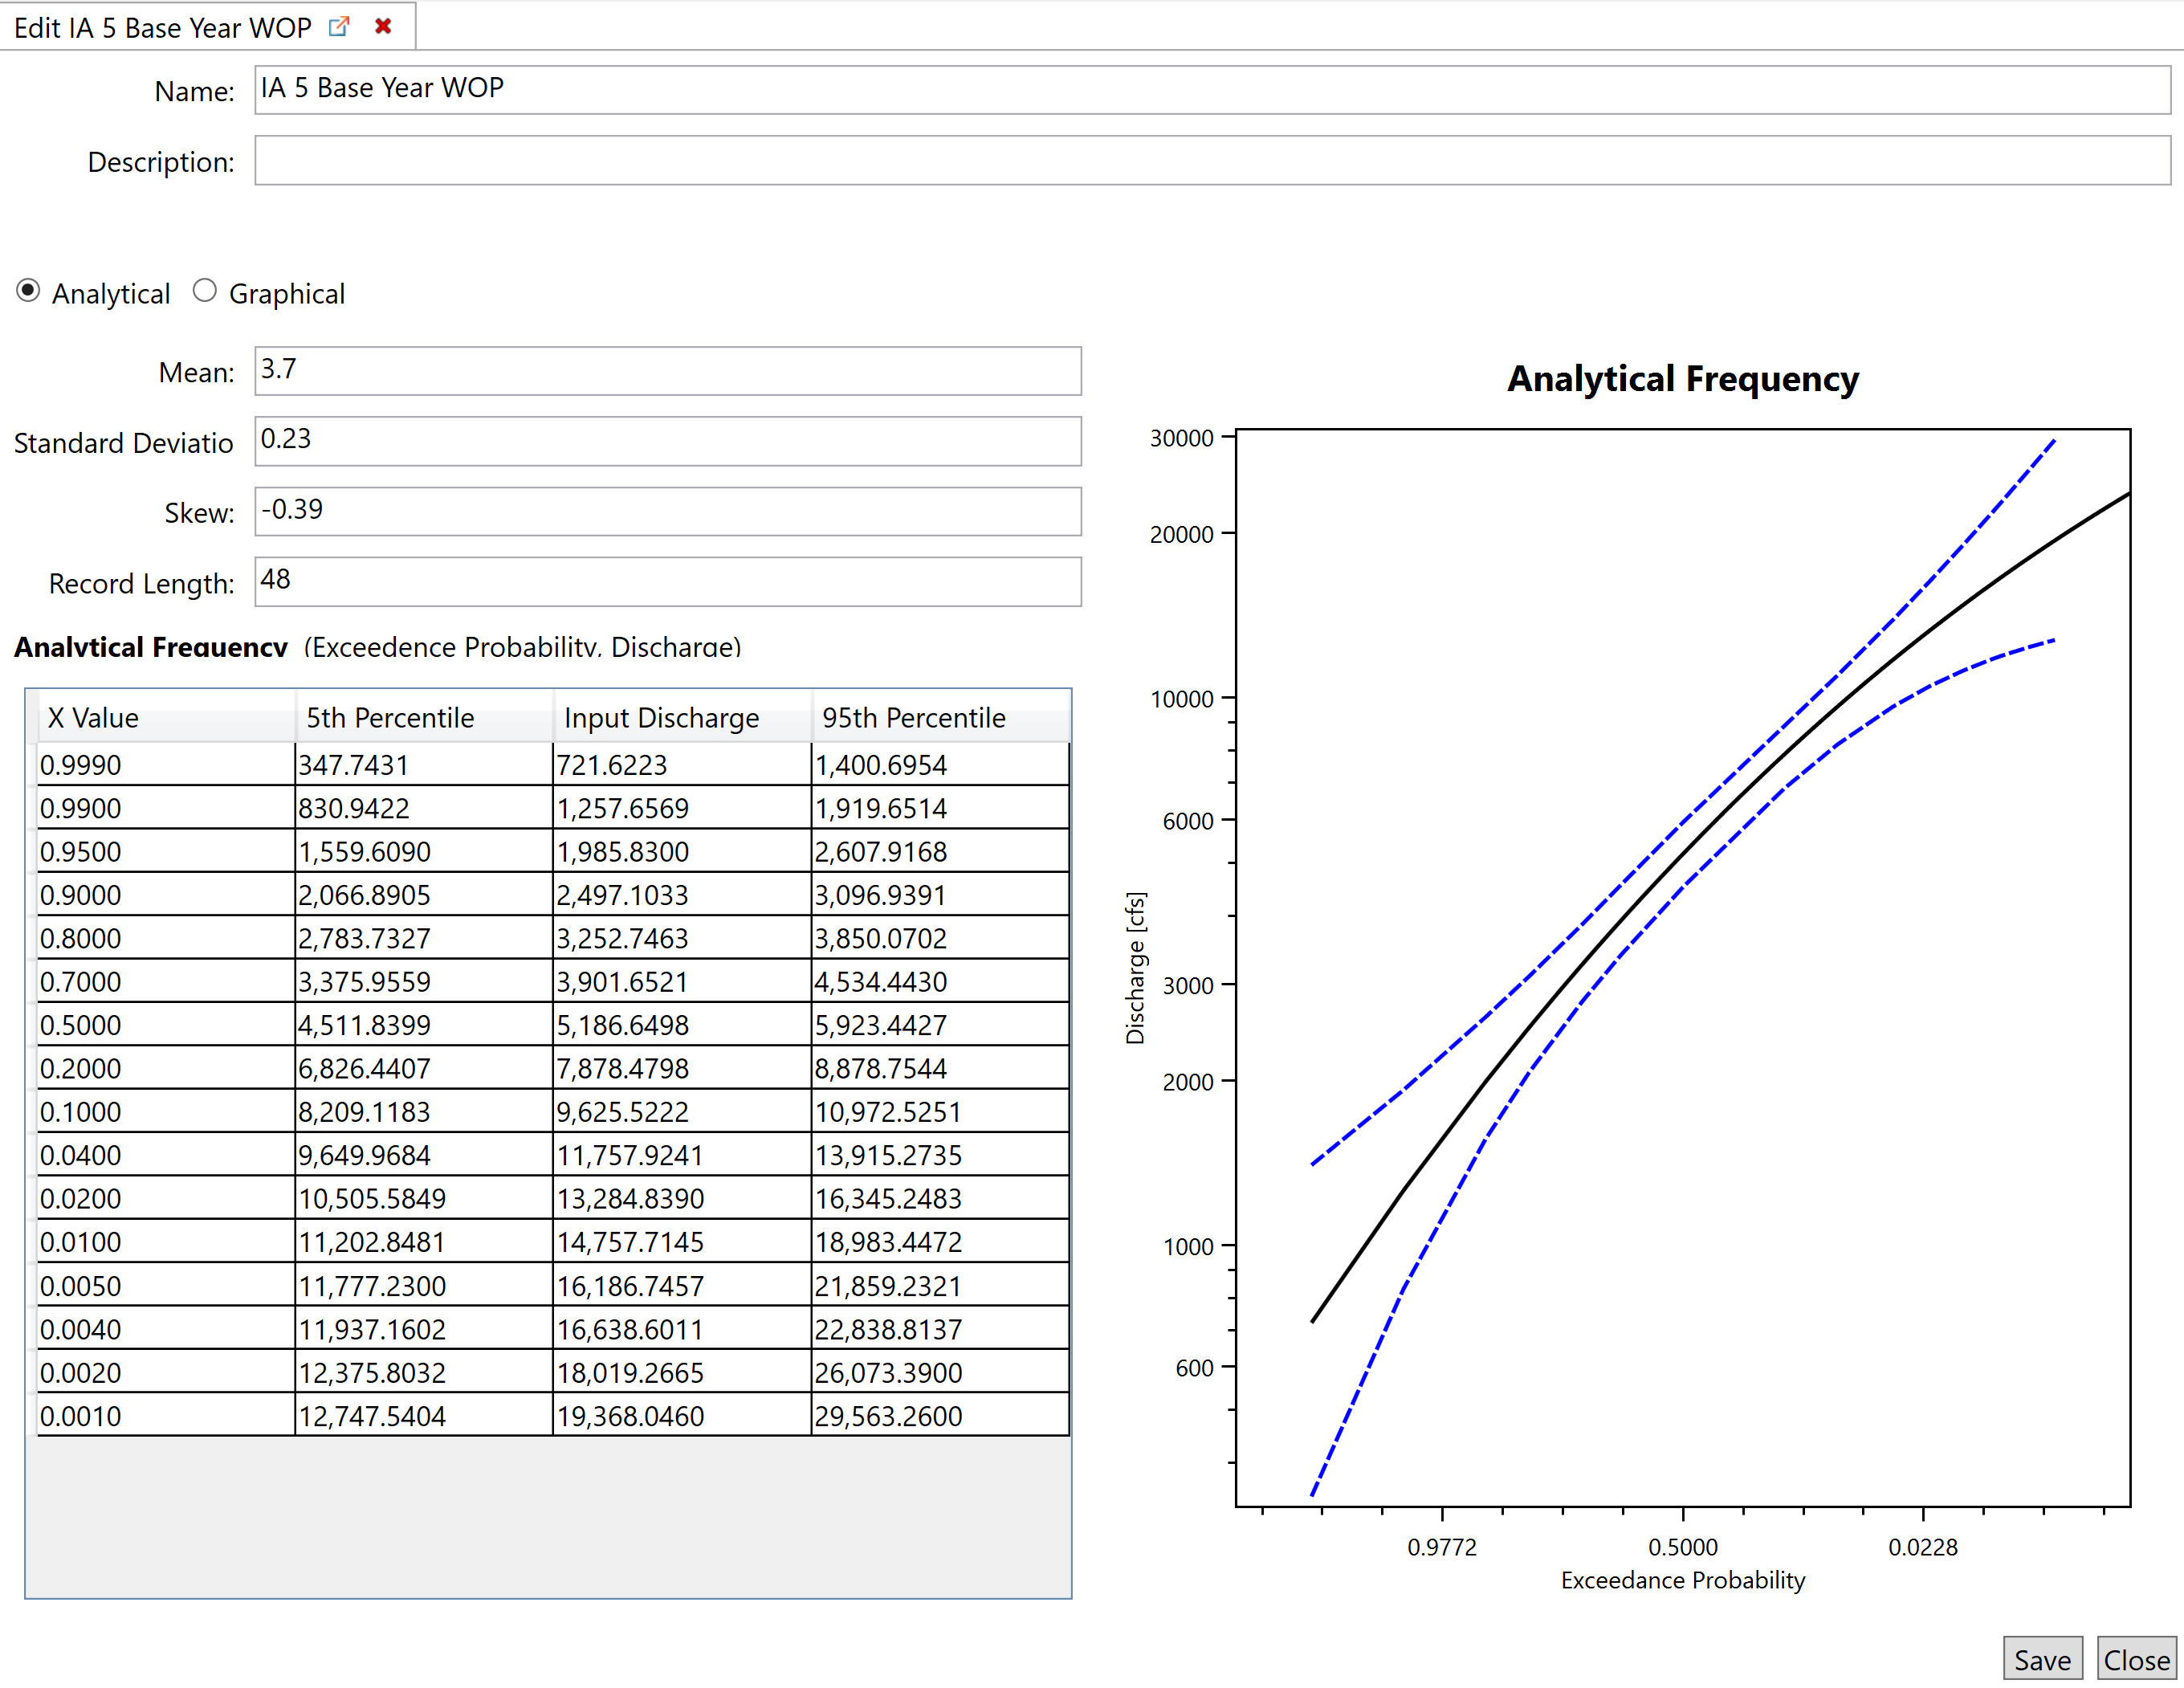
In this chapter, the frequency functions are flow-frequency functions provided as Log-Pearson Type III parameterized functions.
To enter the frequency functions:
- Right-click Frequency Functions and select Create New Frequency Function
- Enter the name of the frequency function in the Name text box
- Enter a brief description of the frequency function in the Description text box
- Select the Analytical radio button to enter the parameterized functions.
- Enter the Mean, Standard Deviation, Skew, and Record Length in the respective text boxes
- Select Save at the bottom right corner of the window and then Close
The frequency functions utilized in this example are in the images below.


Enter Stage-Discharge Functions
To enter the stage-discharge functions:
- Right-click Stage-Discharge Functions and select Create New Stage-Discharge Relationship
- Enter the name of the function in the Name text box
- Enter a brief description of the function in the Description text box
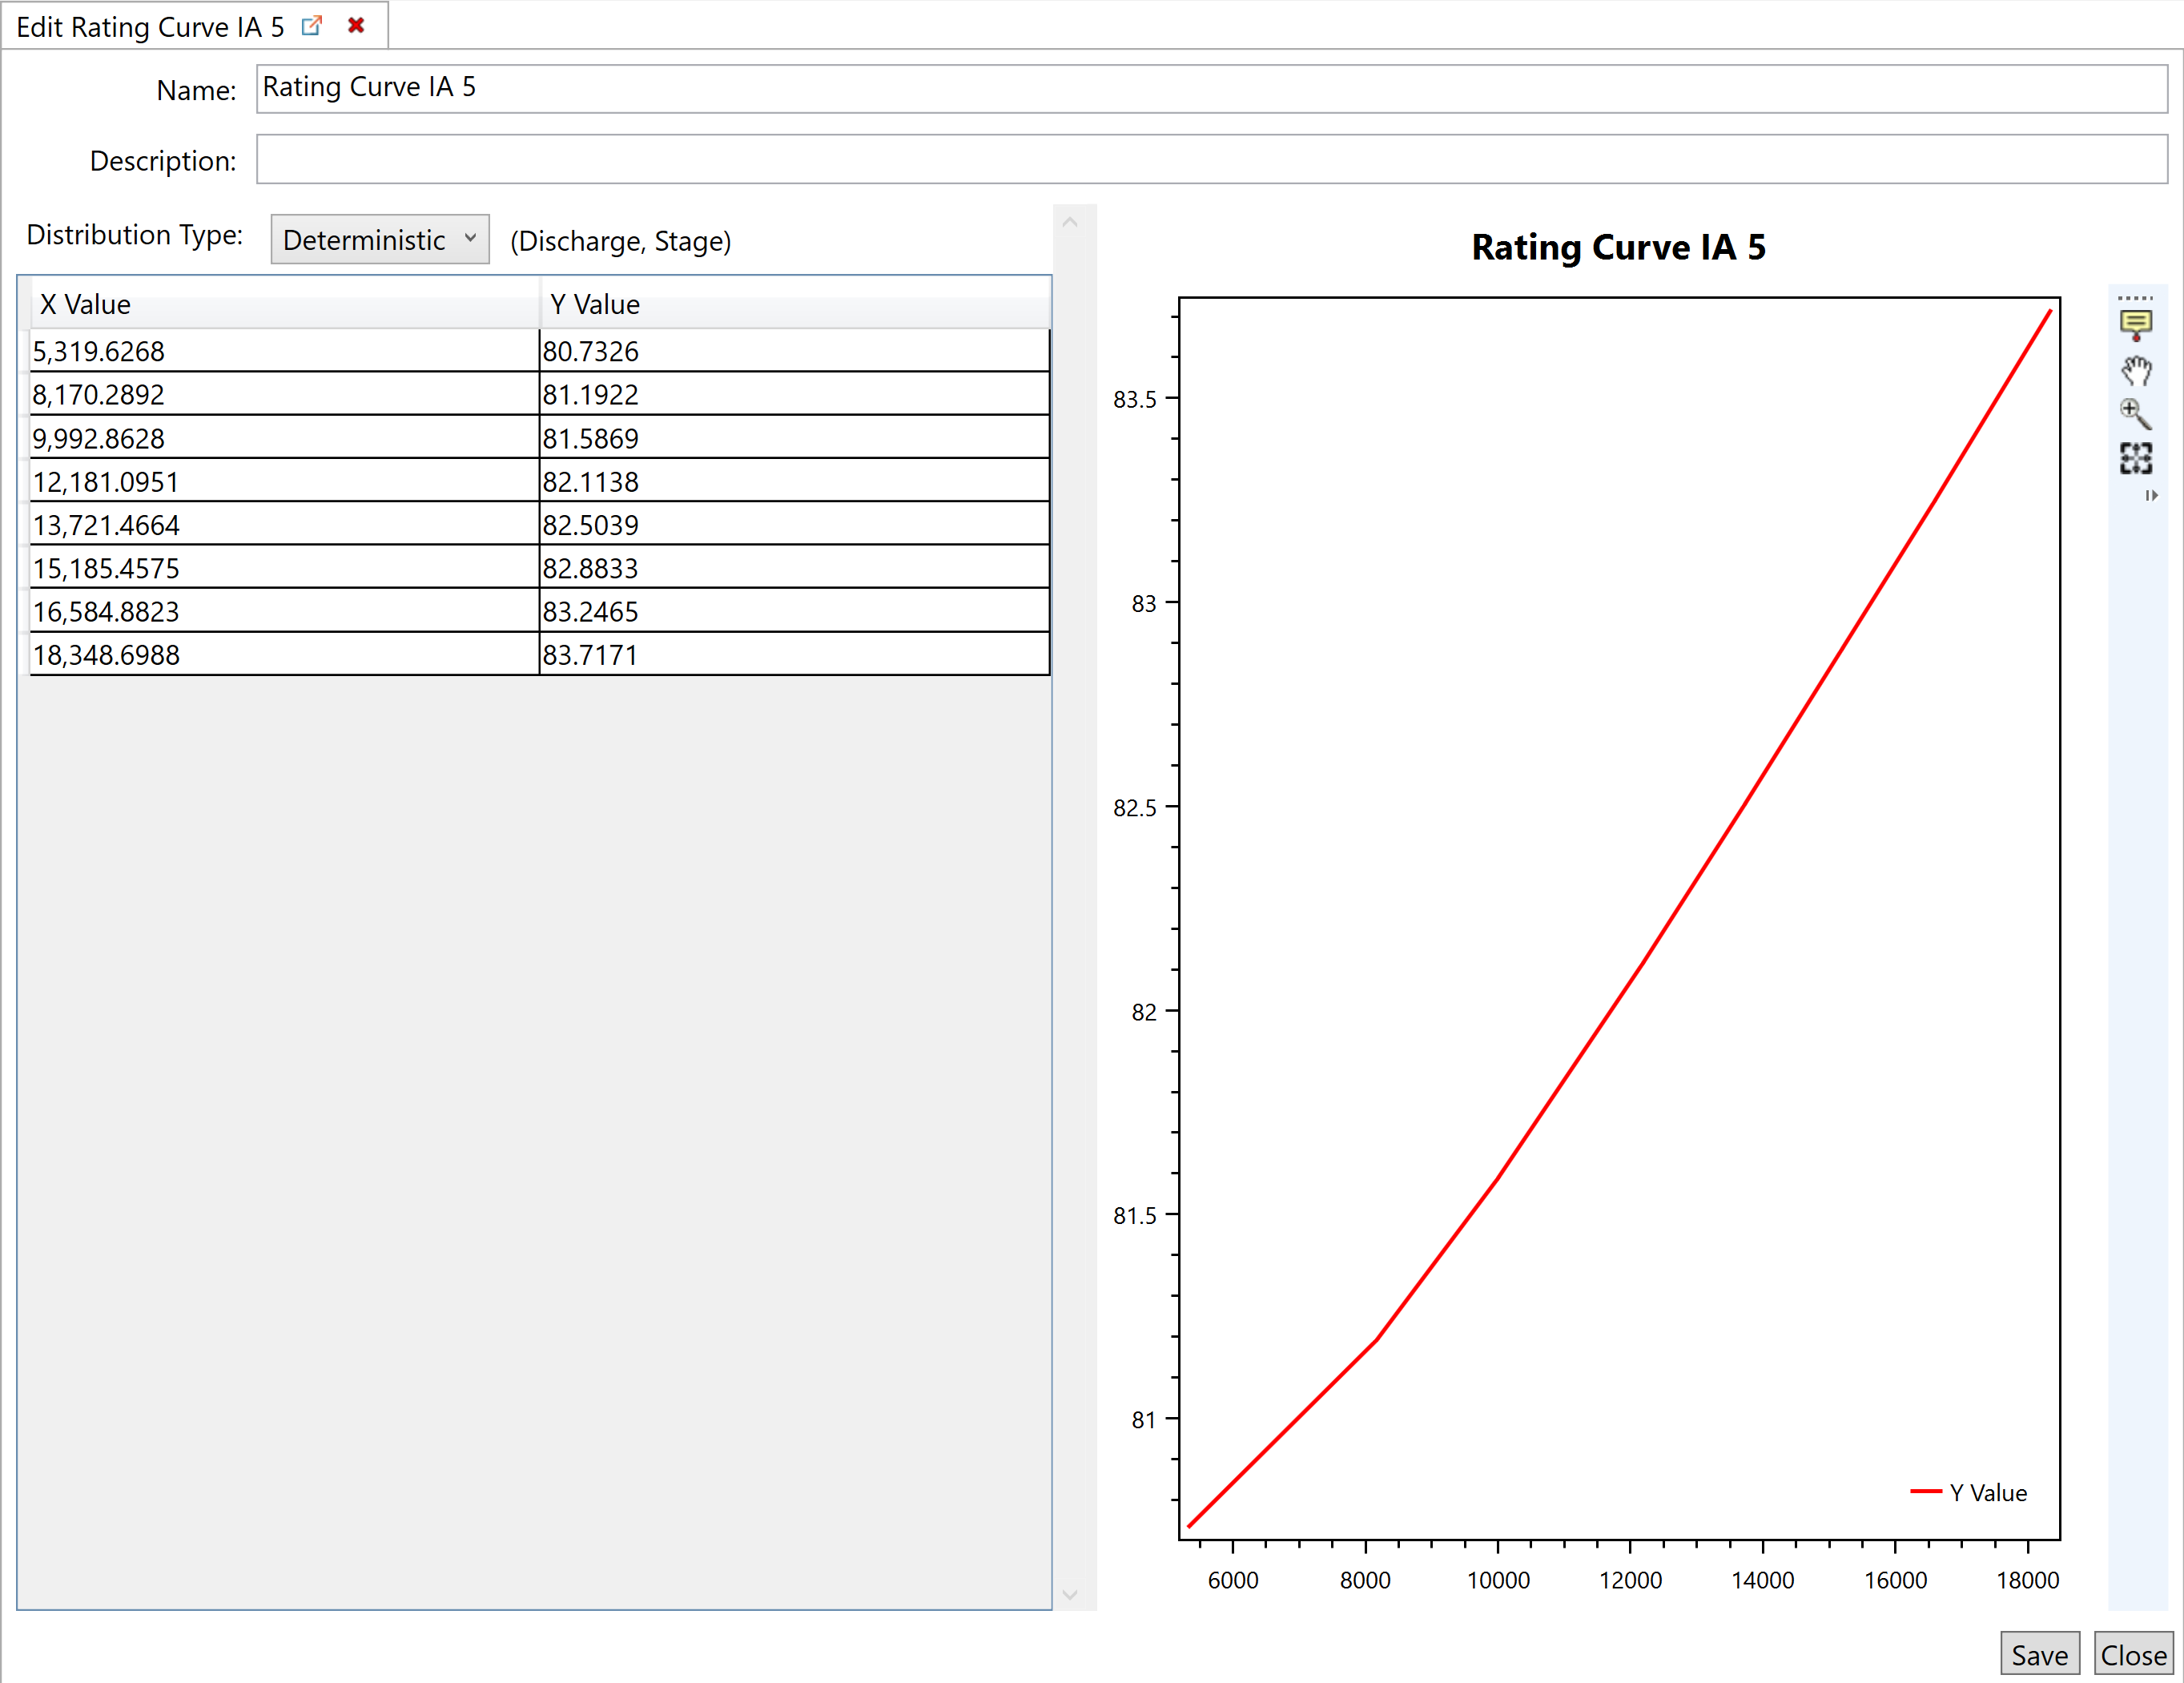
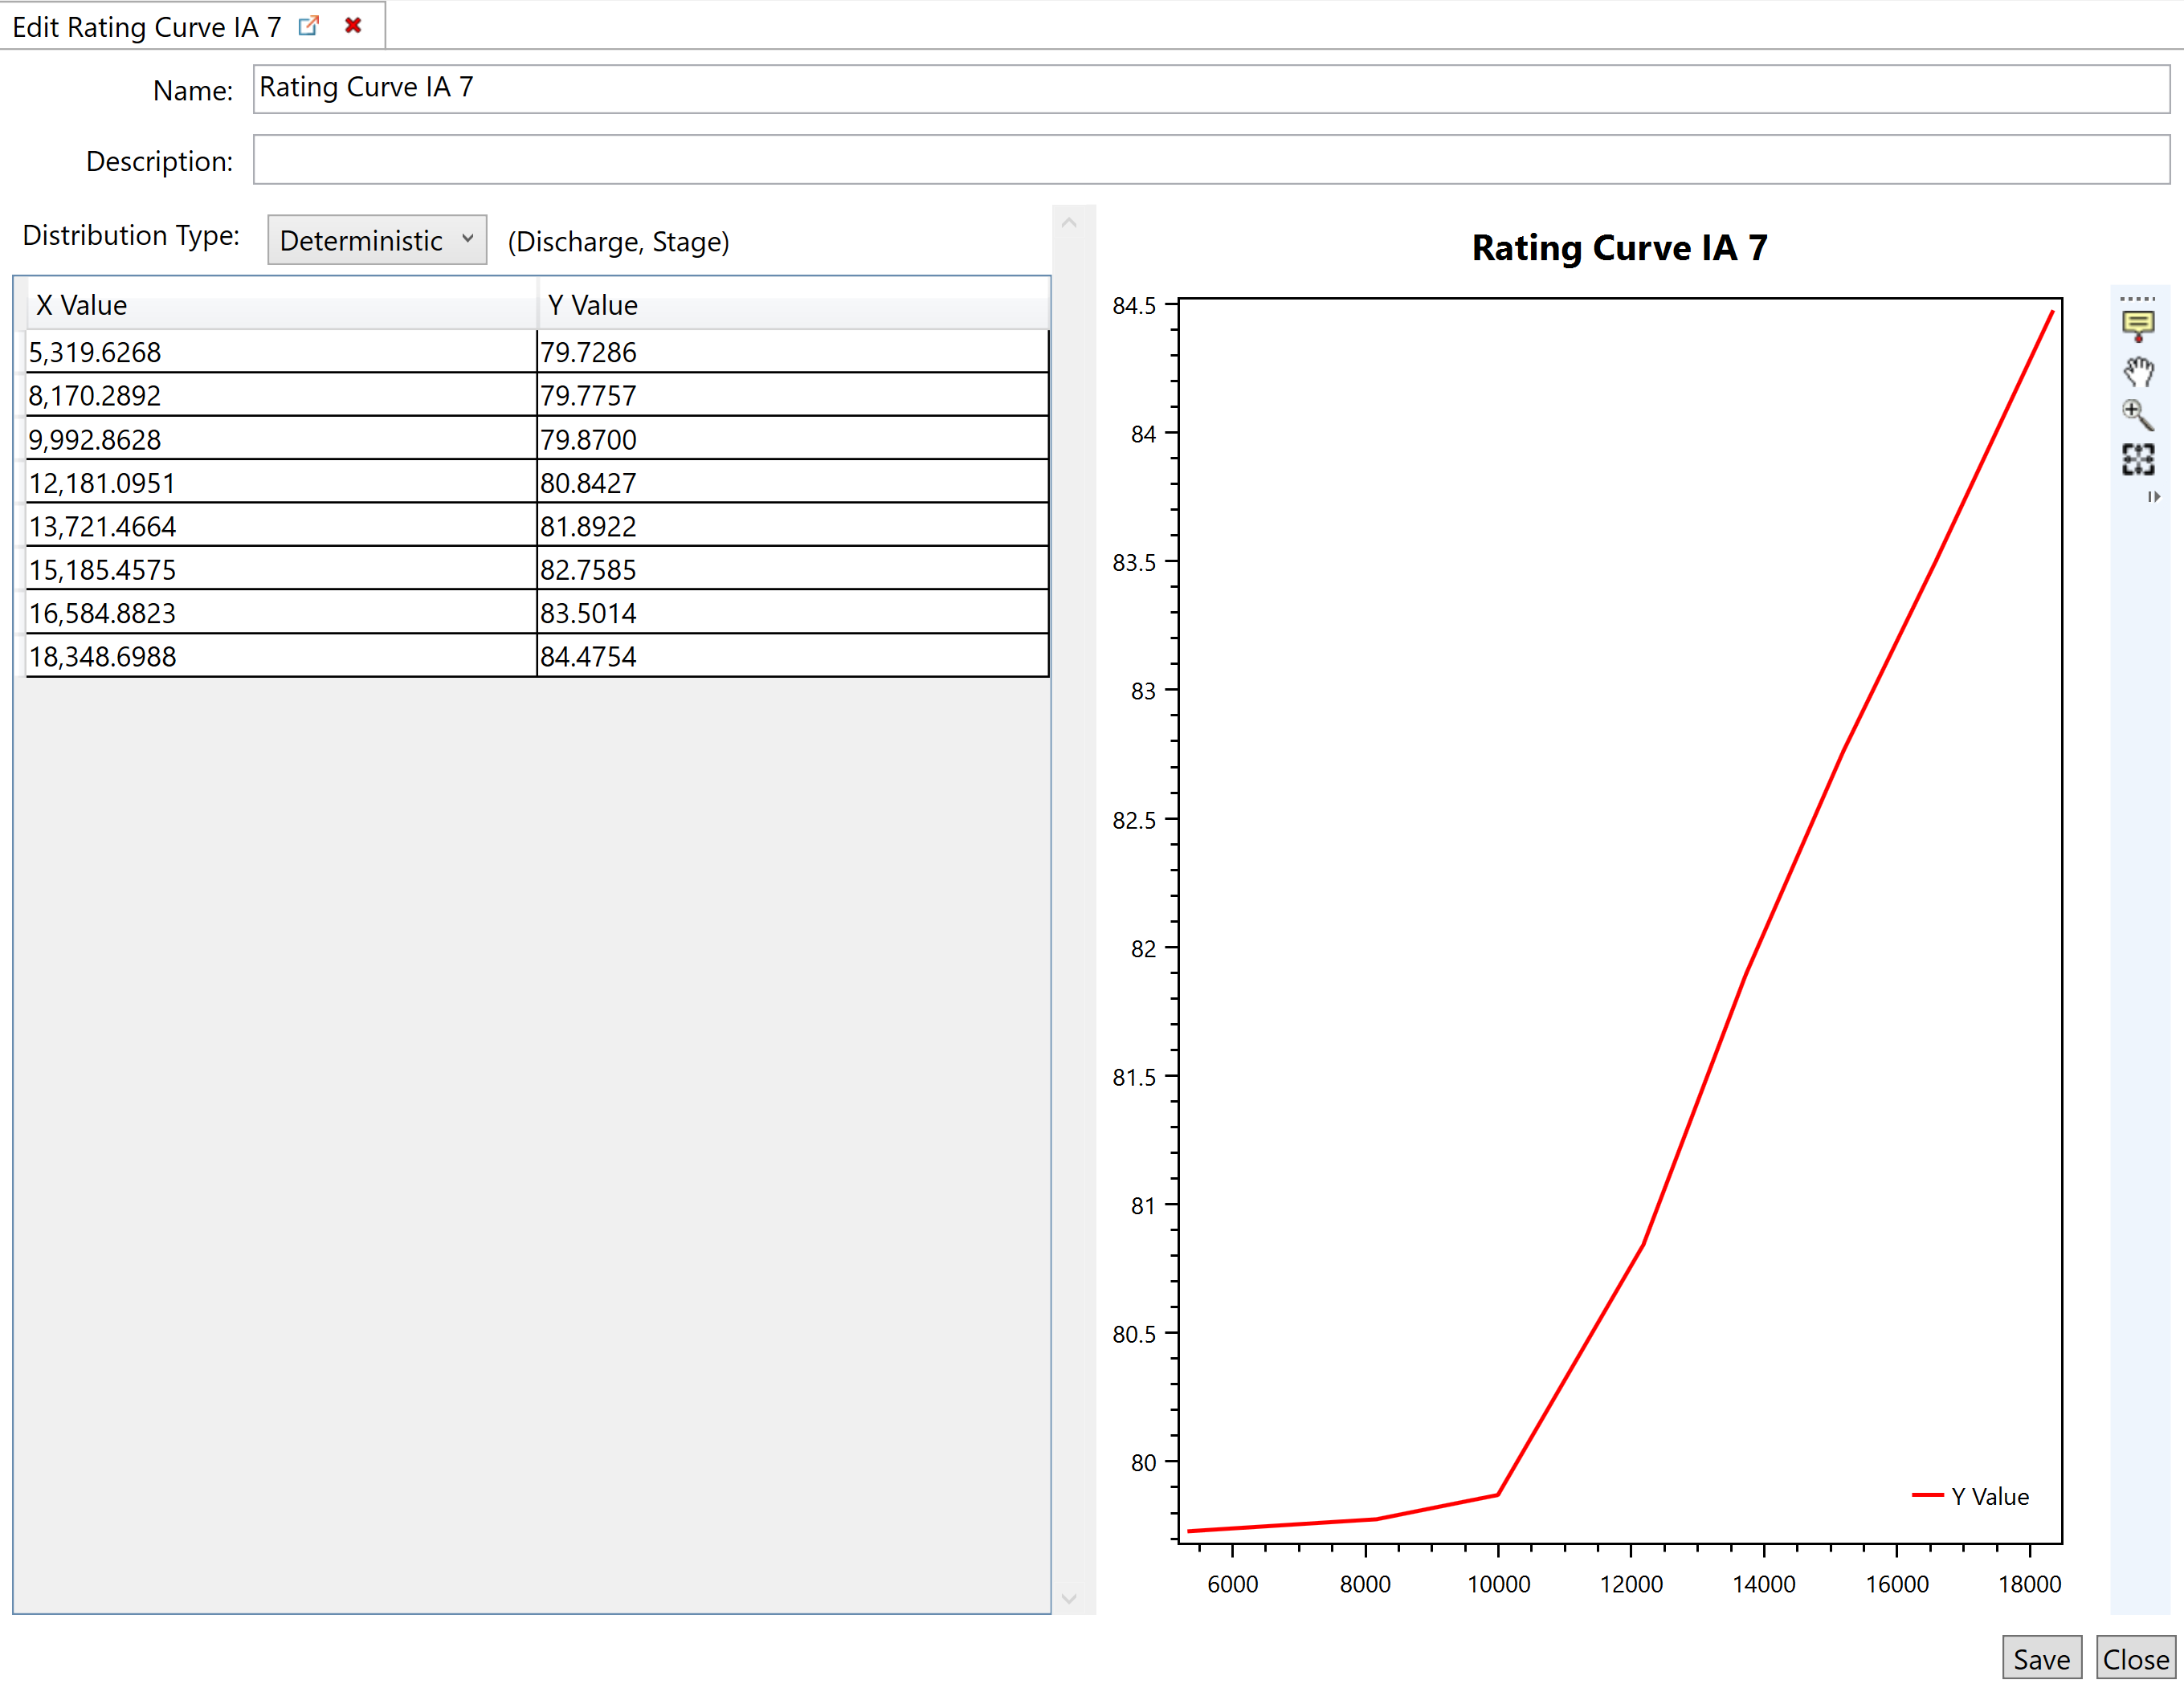
- Select Deterministic from the drop-down menu
- Enter the X and Y values
- Select Save at the bottom right corner of the window and then Close
The stage-discharge functions utilized in this example are in the images below.


Import Structure Inventory
To import the structure inventory:
- Right-click Structure Inventories and select Import from Shapefile
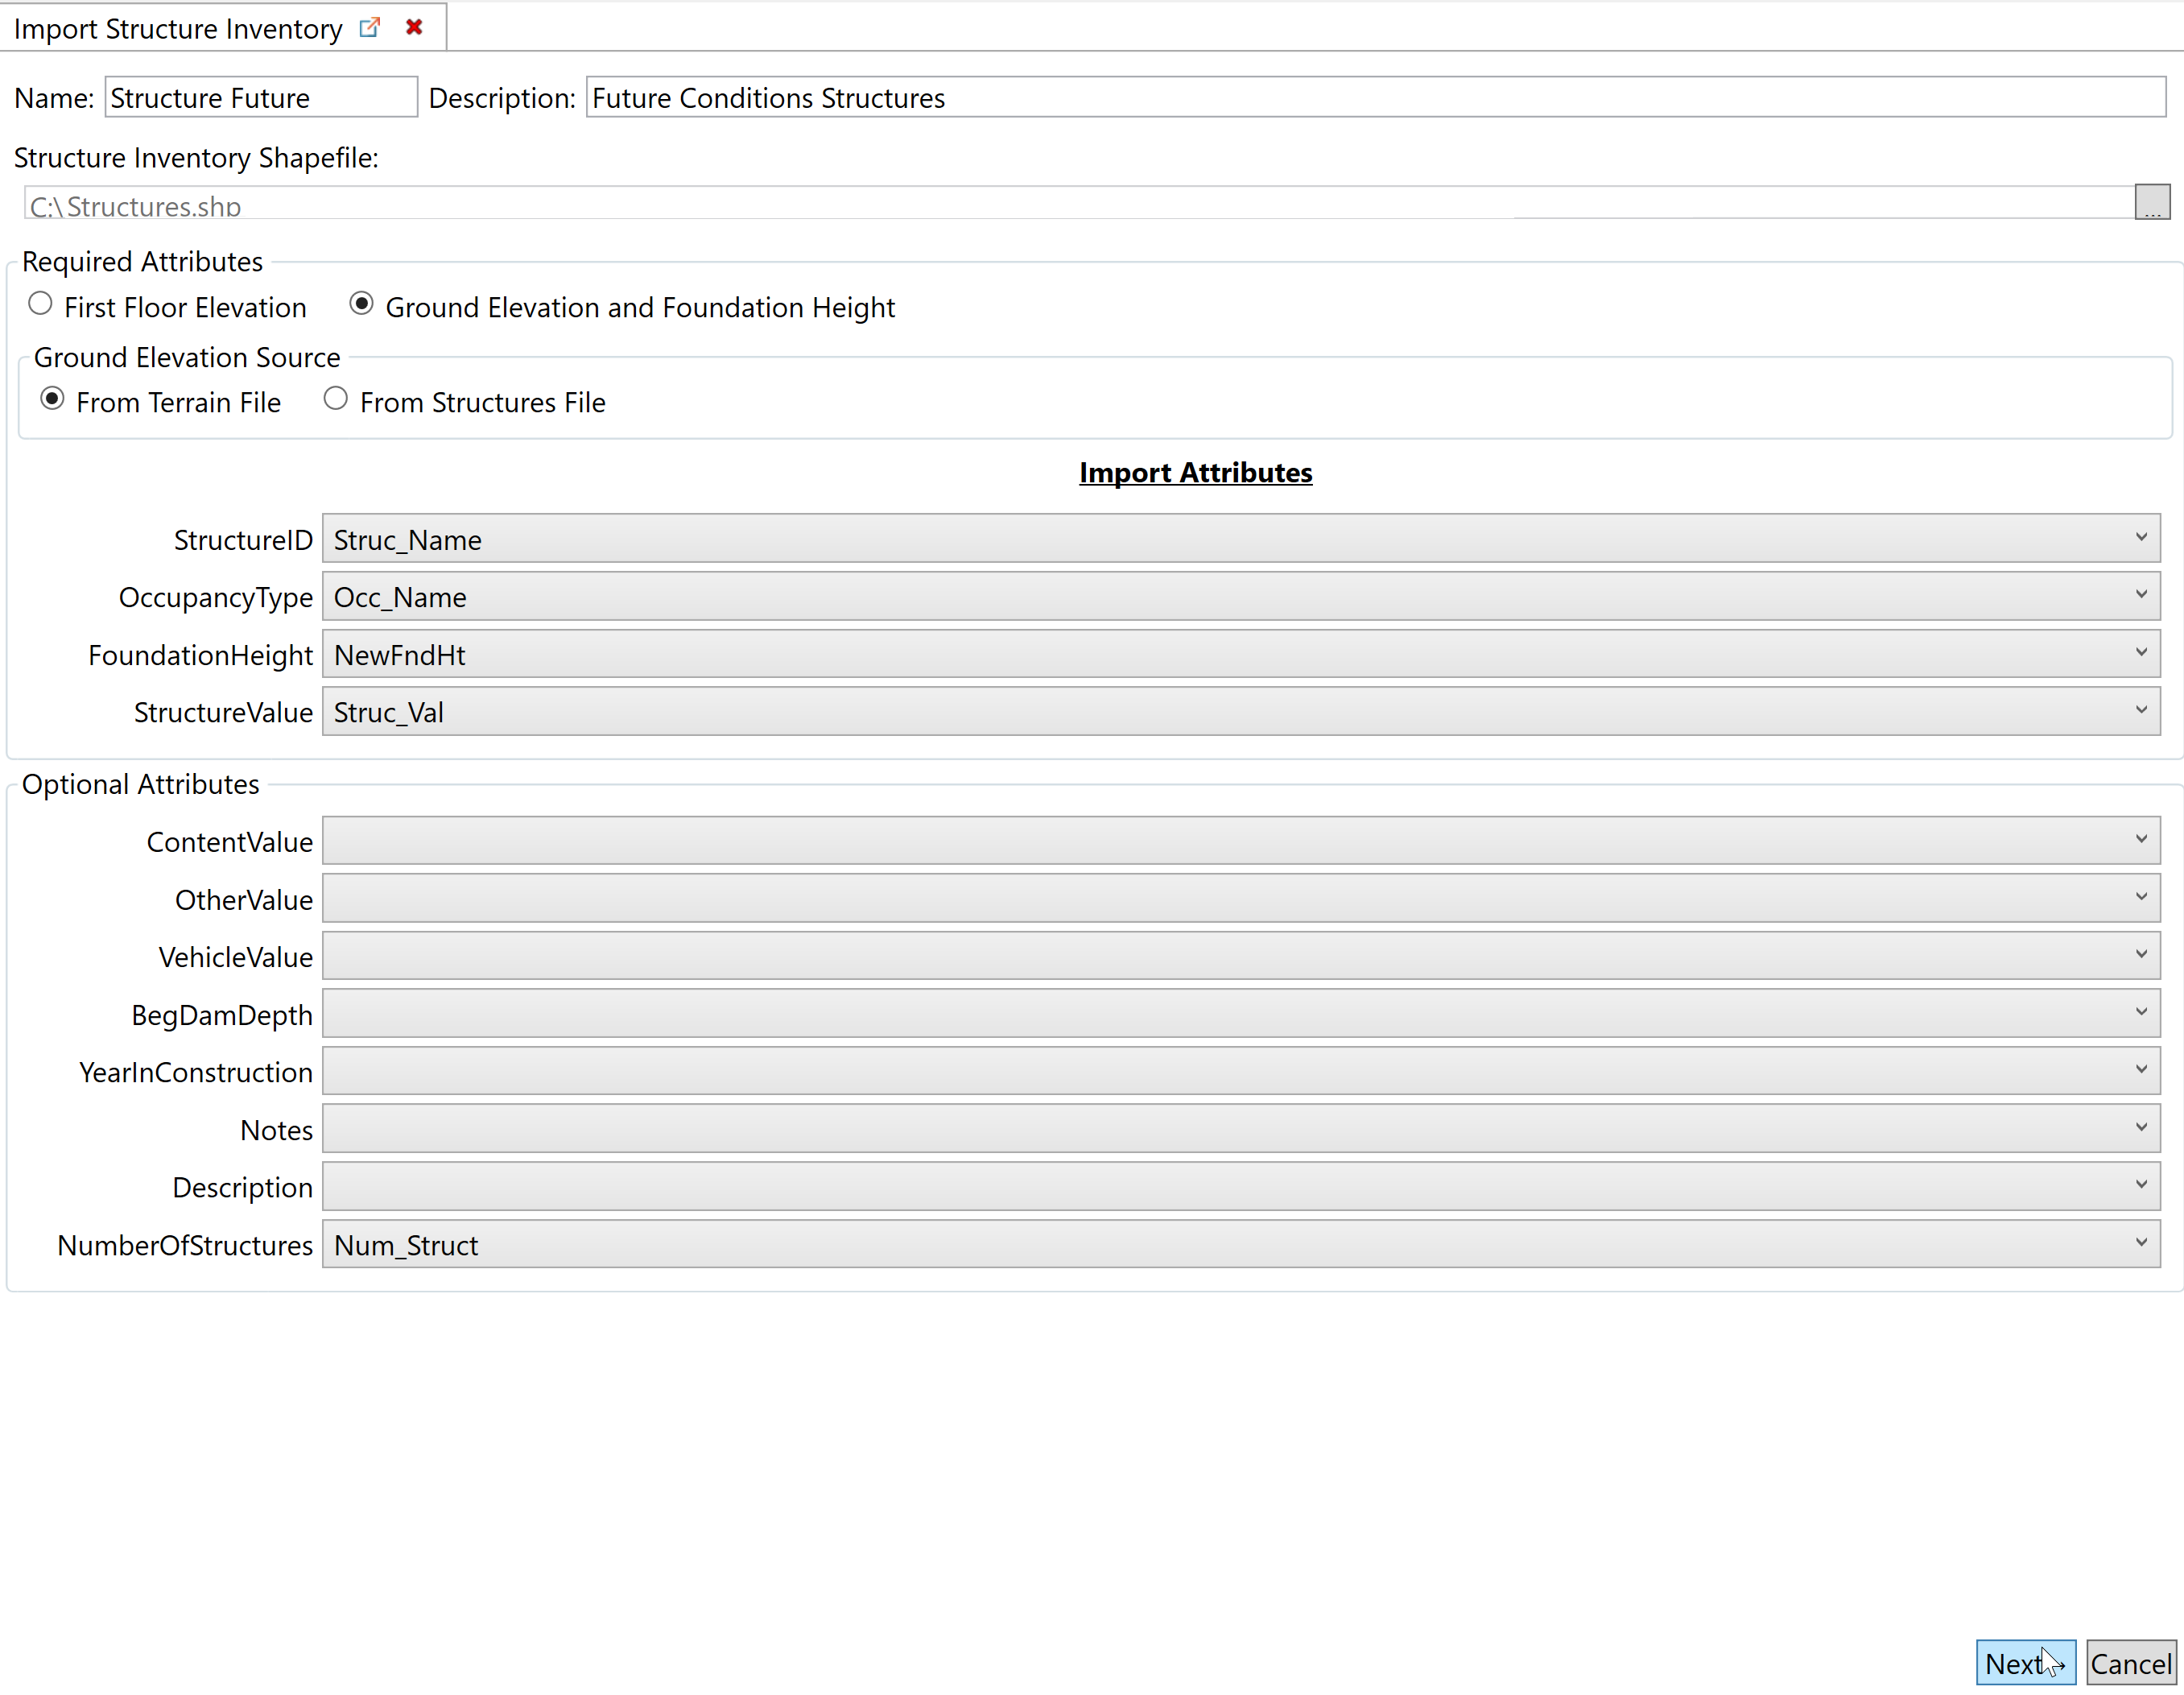
- Enter the name of the structure inventory in the Name text box
- Enter a brief description of the structure inventory in the Description text box
- Select a file path by selecting the ellipsis on the far right side of the Structure Inventory Shapefile text box and navigate to the folder in which you saved the structure inventory
- Ensure the Ground Elevation and Foundation Height radio button and From Terrain File radio button are selected
- From the dropdown boxes, select the column headers corresponding to the structure ID, occupancy type, foundation height, and structure value respectively
- For the future condition structure inventory, select the appropriate attribute for the NumberOfStructures column
- Select Next

- Ensure the occupancy types from from the occupancy type data are selected in the drop-down menus correspond to the occupancy types indicated in the structure inventory
- Select Finish


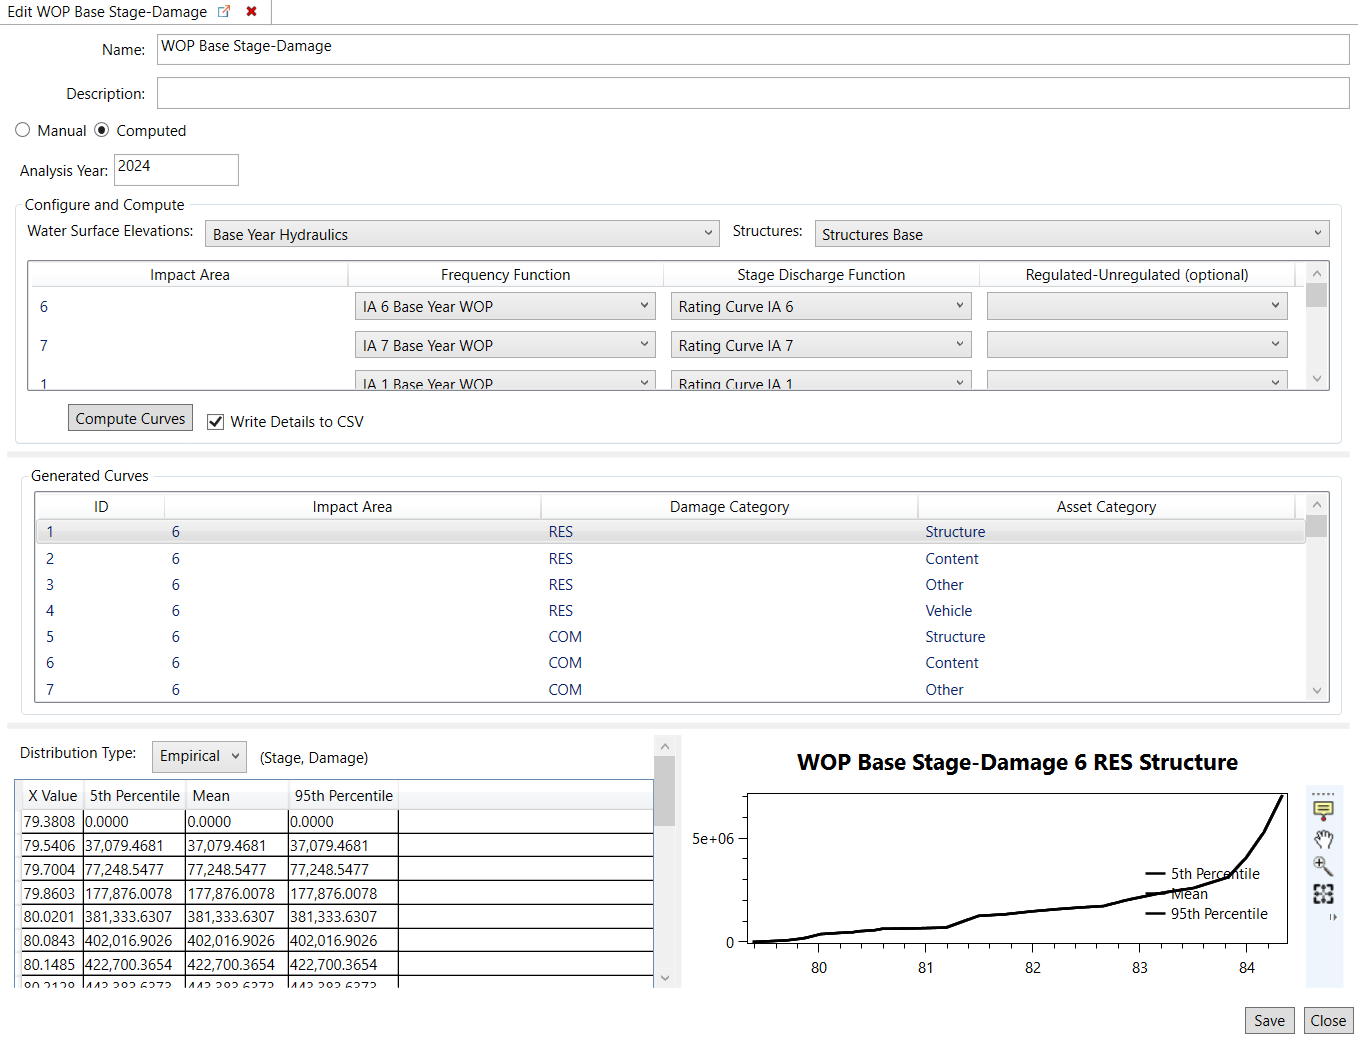
Generate Aggregated Stage-Damage Functions
Two aggregated stage-damage functions must be generated; one for base year, and one for future year.
To generate aggregated stage-damage functions:
- Right-click Aggregated Stage-Damage Functions and select Create New Stage-Damage Functions...
- Enter the name of the aggregated stage-damage function in the Name text box
- Enter a brief description of the aggregated stage-damage function in the Description text box
- Ensure the Computed radio button is selected
- Enter the appropriate analysis year in the Analysis Year text box
- Select the Water Surface Elevations and Structures from the respective drop-down boxes
- Select the generated Frequency Function from the drop-down box
- Ensure the Write Details to CSV radio button is selected
- Select Compute Curve

- Wait for the aggregated stage-damage function to generate as indicated by functions being displayed at the bottom of the window and then select Save
 and select Close
Note: Analysis Year, Water Surface Elevations, and Structures should be assigned according to base and future year respectively. Frequency Functions and Stage-Discharge Functions must be matched to the appropriate impact area. See images below for correct setup.

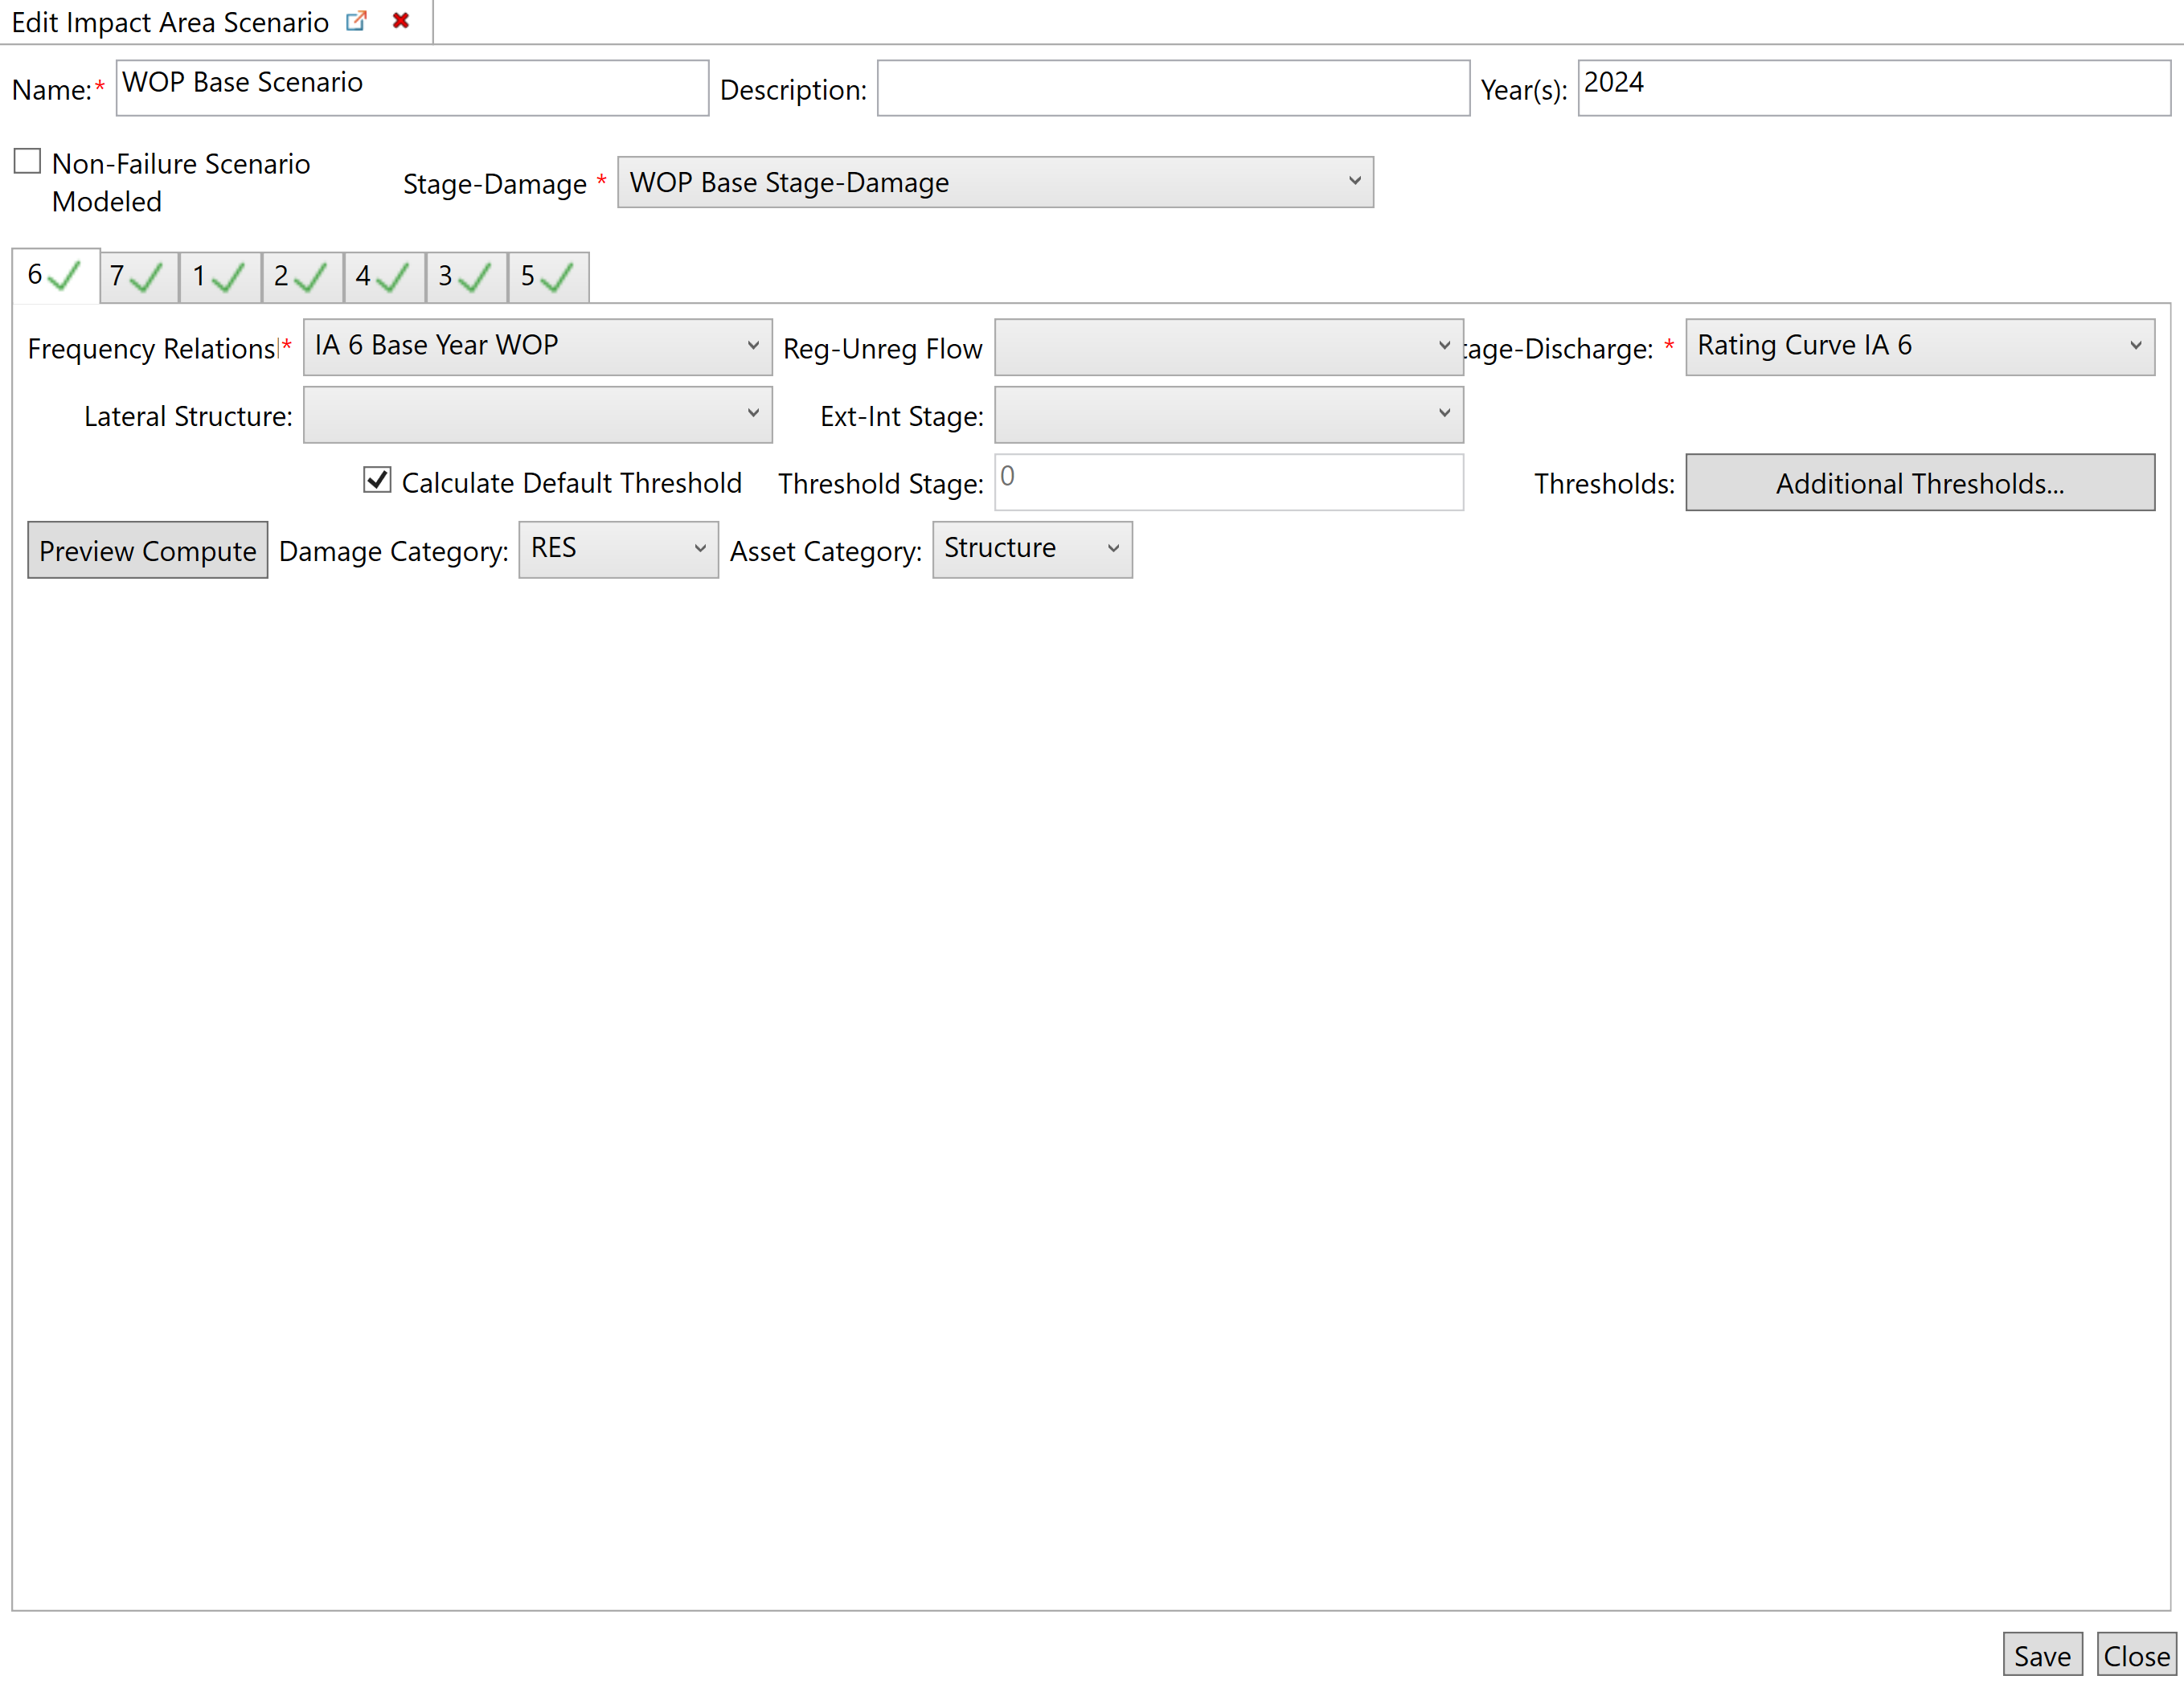
Create a New Scenario
To create a new scenario:
- Right-click on Scenarios and select Create New Scenario...
- Enter a name and description for the scenario in the respective text boxes.
- Enter the appropriate analysis year in the Year(s) text box
- Select the stage-damage function from the Stage-Damage drop-down box
- Select the frequency function from the Frequency Relationship drop-down box
- Select the stage-discharge function from the Stage-Discharge drop-down box
- Repeat steps 5 and 6 for each impact area by selecting the other impact areas from the tabs
- Ensure the Calculate Default Threshold radio button is selected
- Select save and select Close
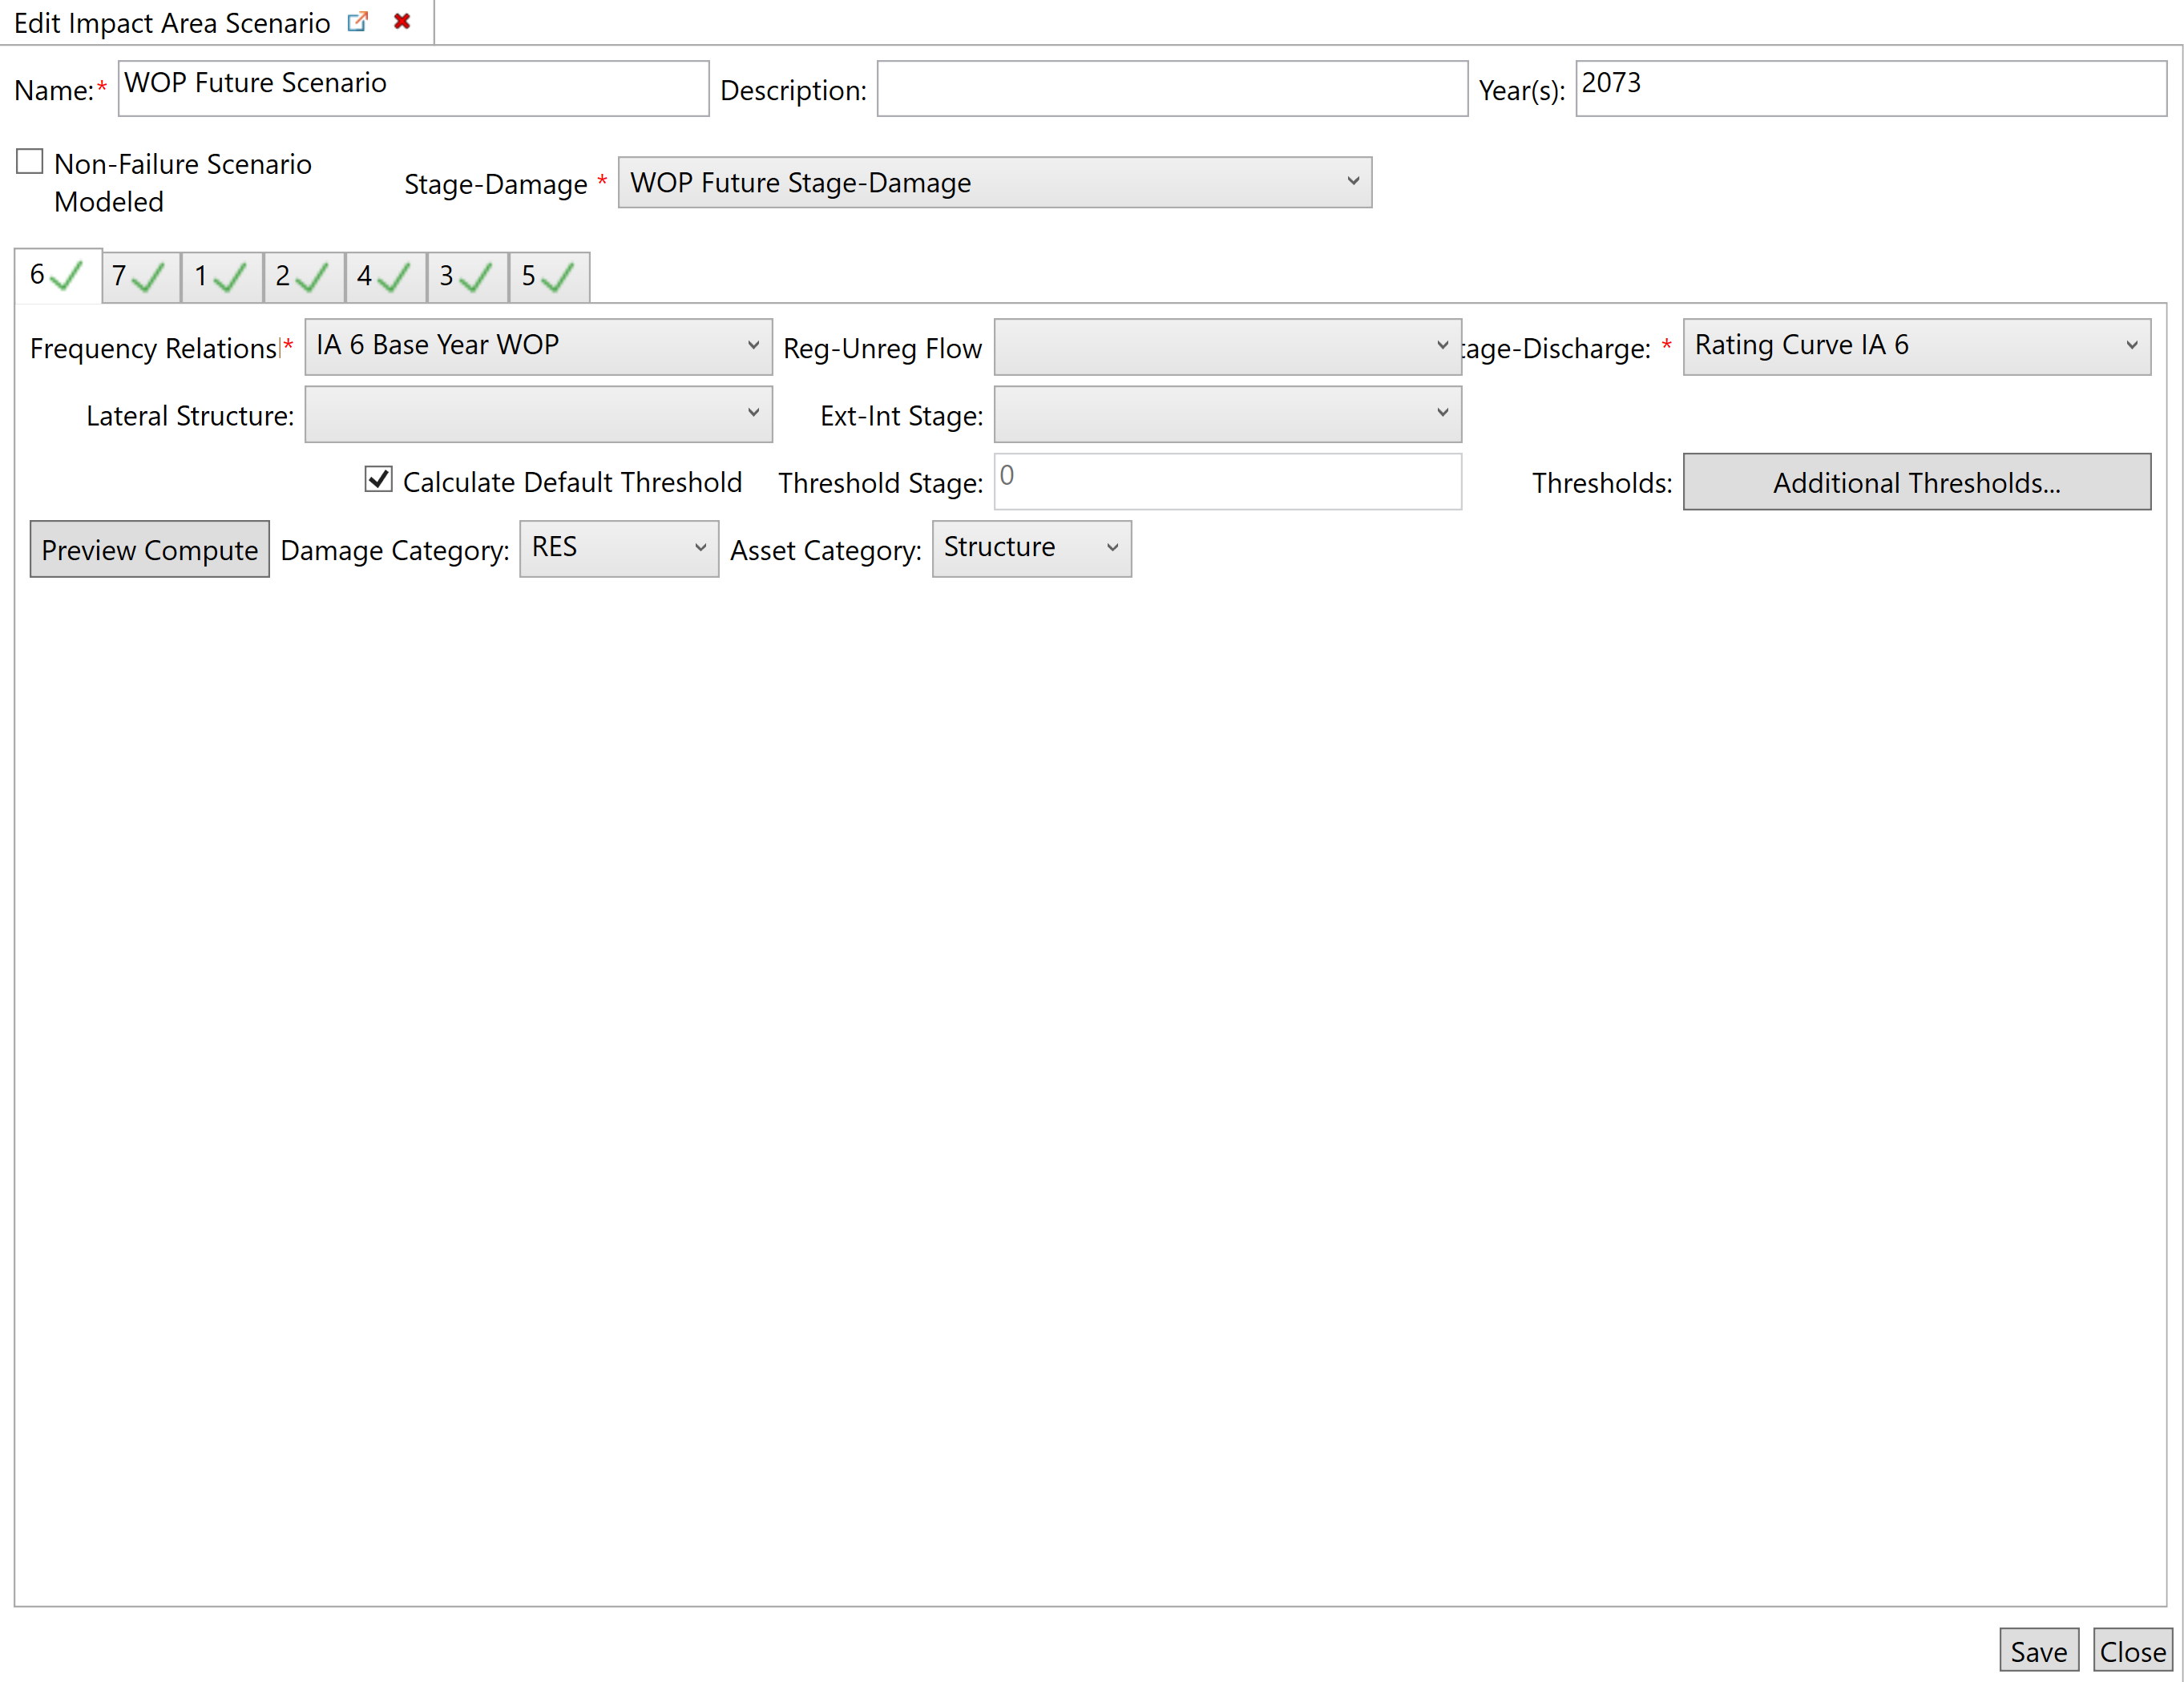
- Repeat steps 1-9 for the future scenario
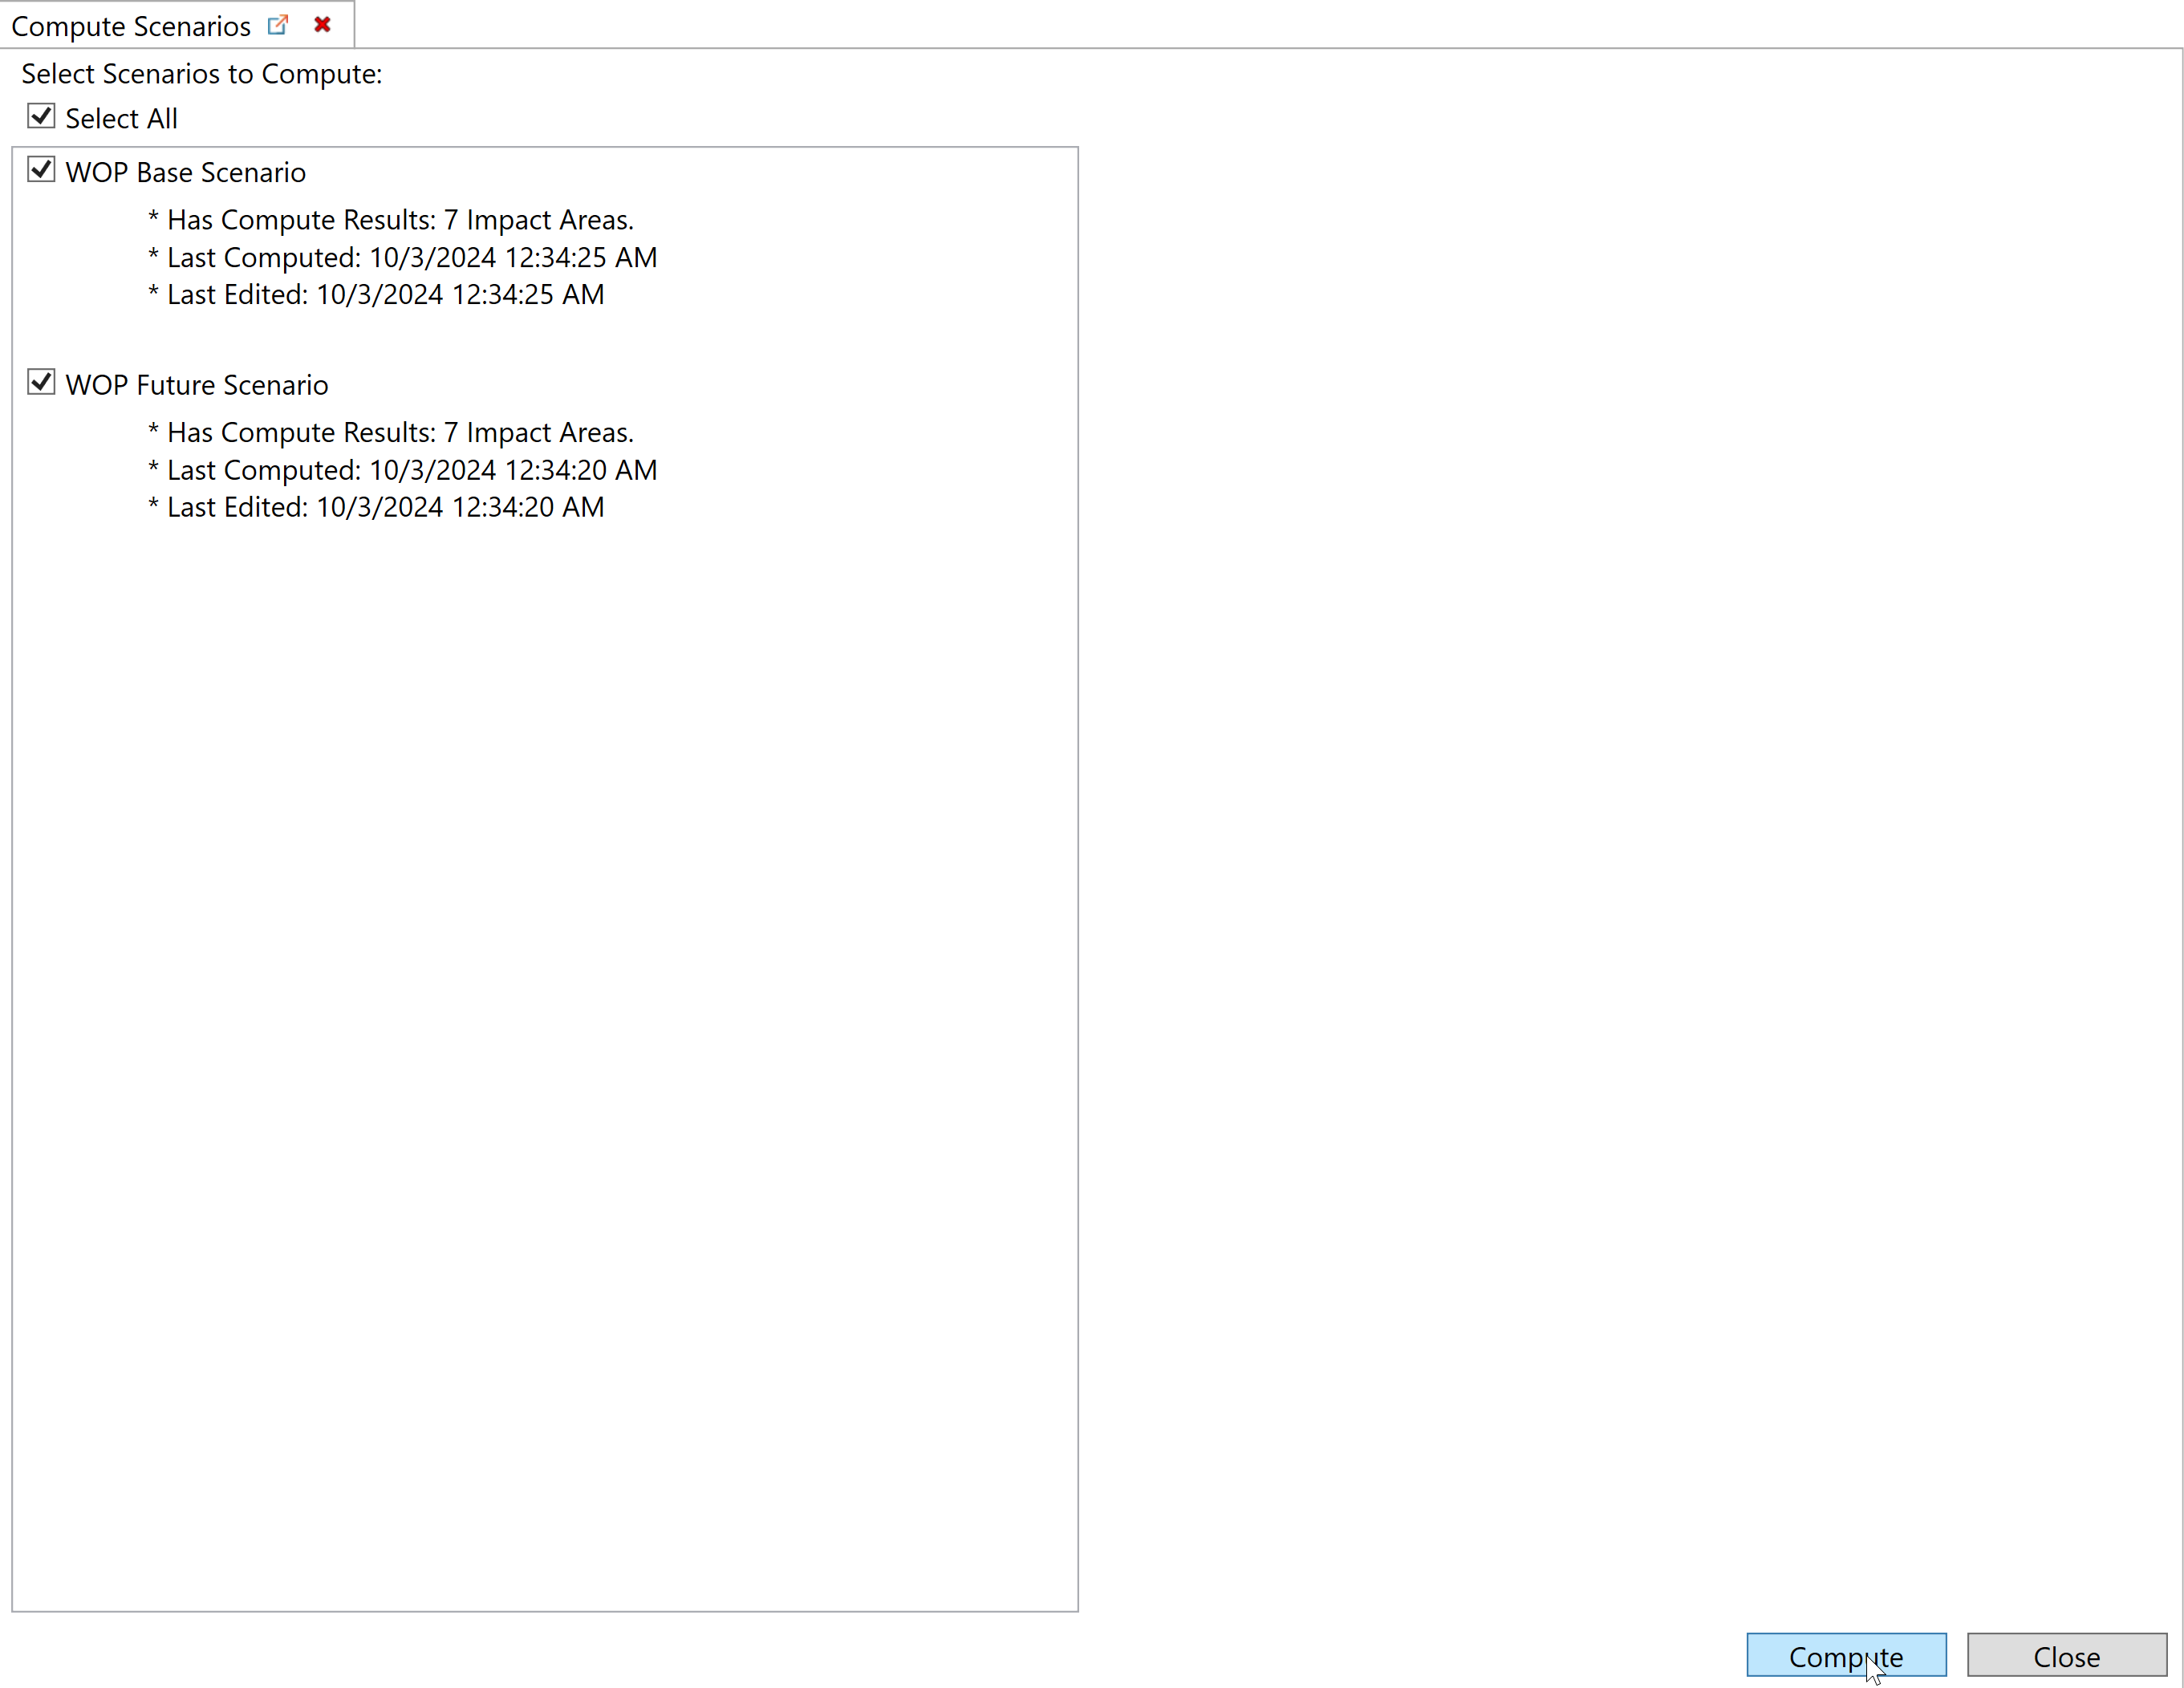
- Right-click on Scenarios and and select Compute Scenarios...
- Select the Select All check box and select Compute at the bottom right side corner
- Wait for the scenarios to be generated and then select Yes when prompted to view the results
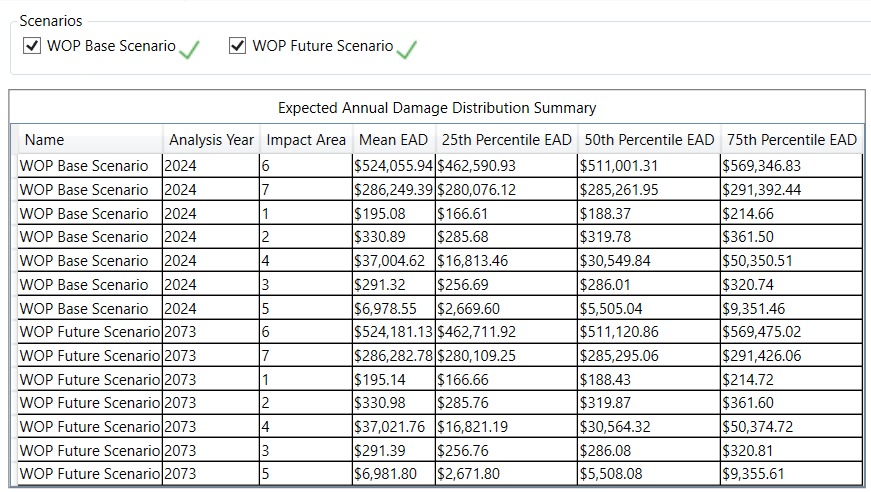
Results
View Results
Report
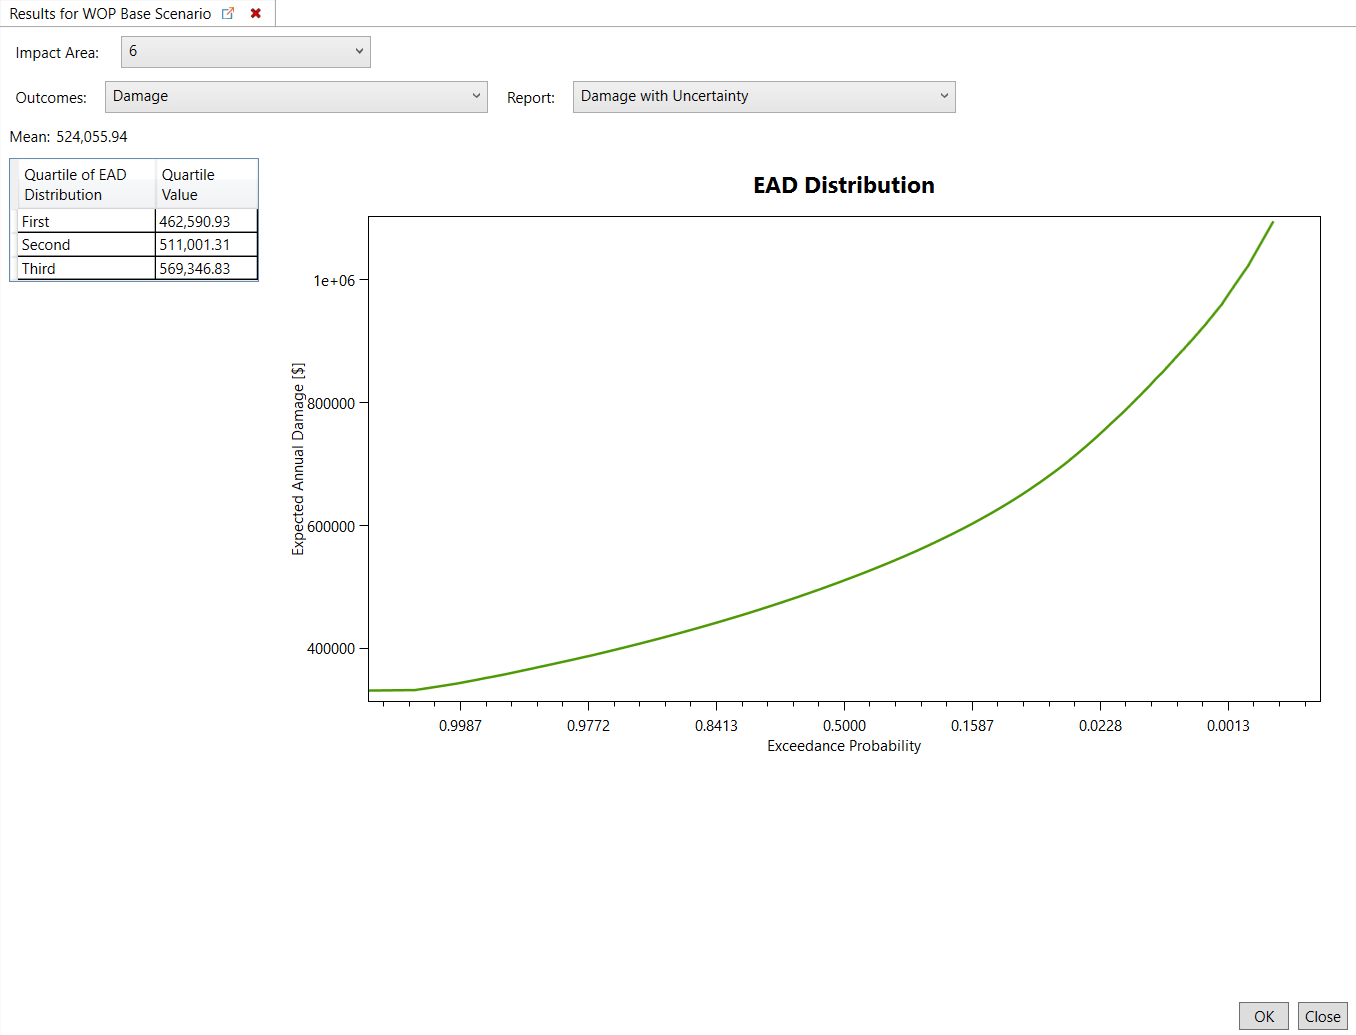
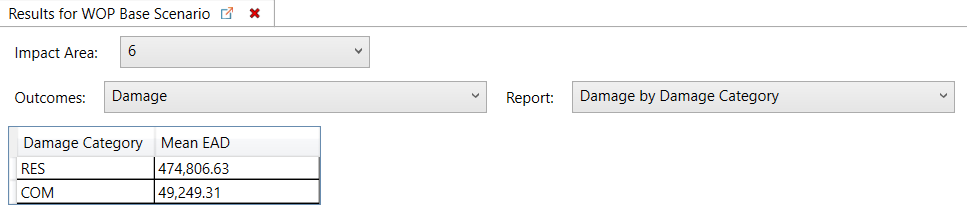
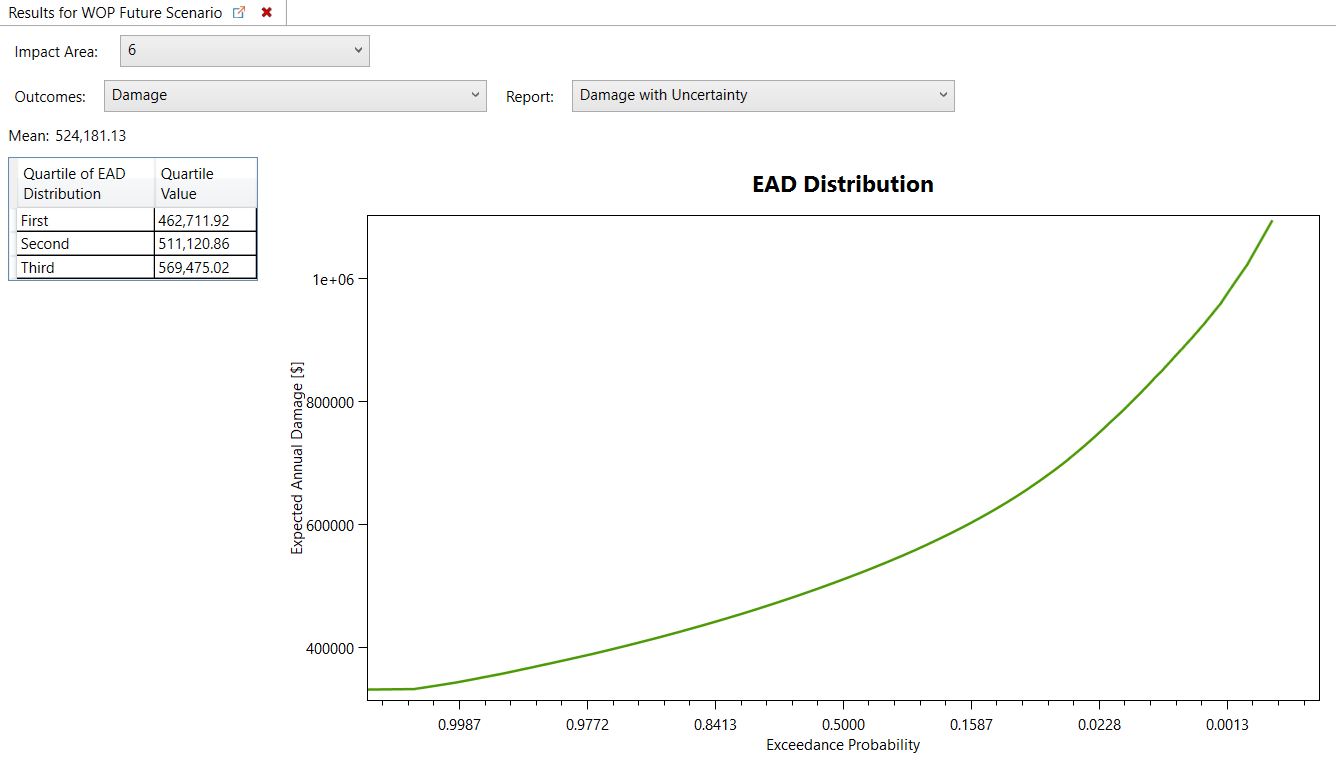
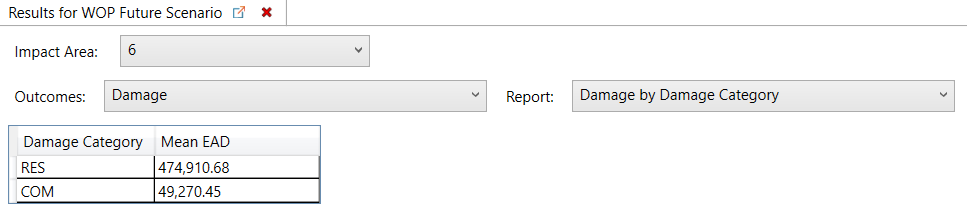
View Summary Results