For Version 3.0, GeoEFM was rewritten as a toolbox that contains 4 primary tools and 10 python scripts (Figure 1). Much of the functionality of previous GeoEFM versions is coded in those scripts. Three features in GeoEFM 2.0 were not carried to GeoEFM 3.0 – data management through views, nearest neighbor, and spatial statistics.
In 2.0, data management through views was part of the basic GeoEFM project framework. Standard, combo, and custom views were created by the user as data frames or workspaces for different management alternatives and ecological concerns. This was not carried over to Version 3.0. Organization of layers is now left to the users, which is a simpler approach that leans on already built capabilities of Pro.
Nearest neighbor is one of three habitat functionality methods included in Version 2.0. It was not carried over to Version 3.0 due to funding limitations.
Spatial statistics was not carried over to Version 3.0 because Pro has already built capabilities for plotting point data at different scales.
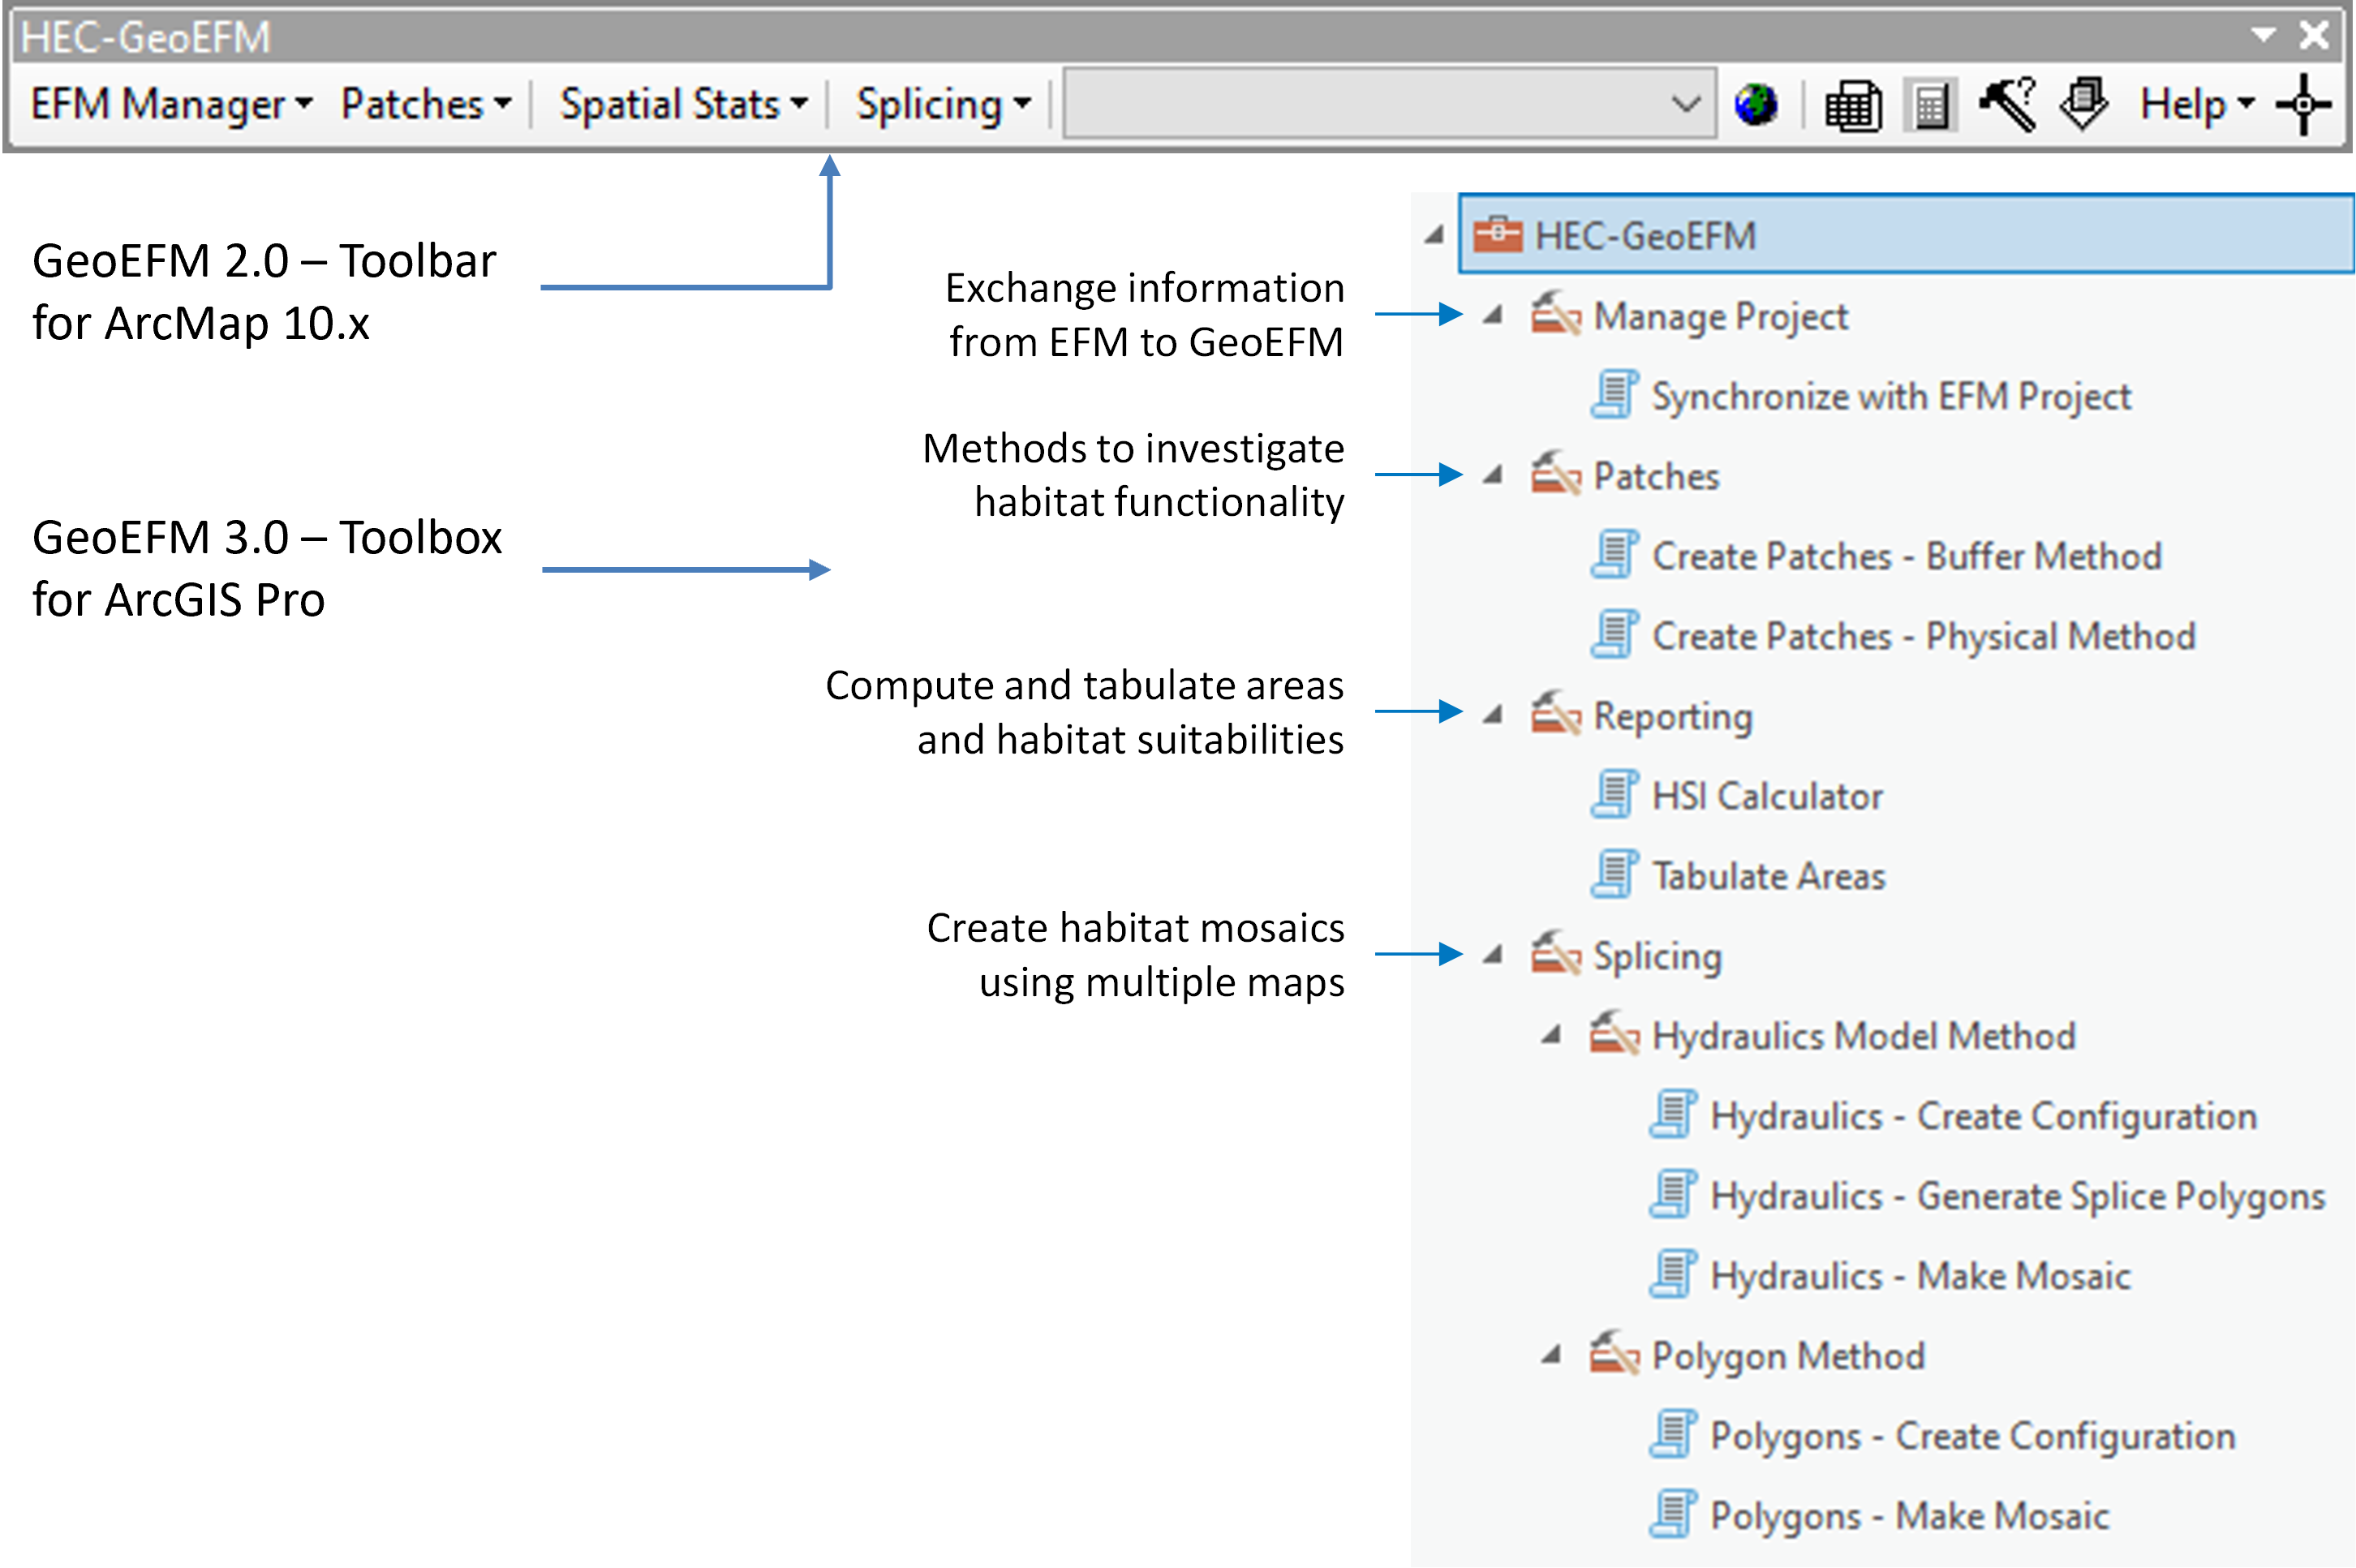
Figure 1. Construct differences between GeoEFM 2.0 and 3.0.
When a script is initiated, an interface opens in the Geoprocessing frame of Pro. Users enter parameters into the interface fields (Figure 2), which are then used to guide application of the script (Figure 3). Output can be rasters (Figure 4) or feature class information that is stored to geodatabases.
By default, scripts that generate rasters produce geotiffs that are stored to a layers folder in the project directory. Users can adjust this to produce grids or geodatabase rasters that are saved to any location on disk. Typically, outputs from GeoEFM tools are automatically added to map contents.
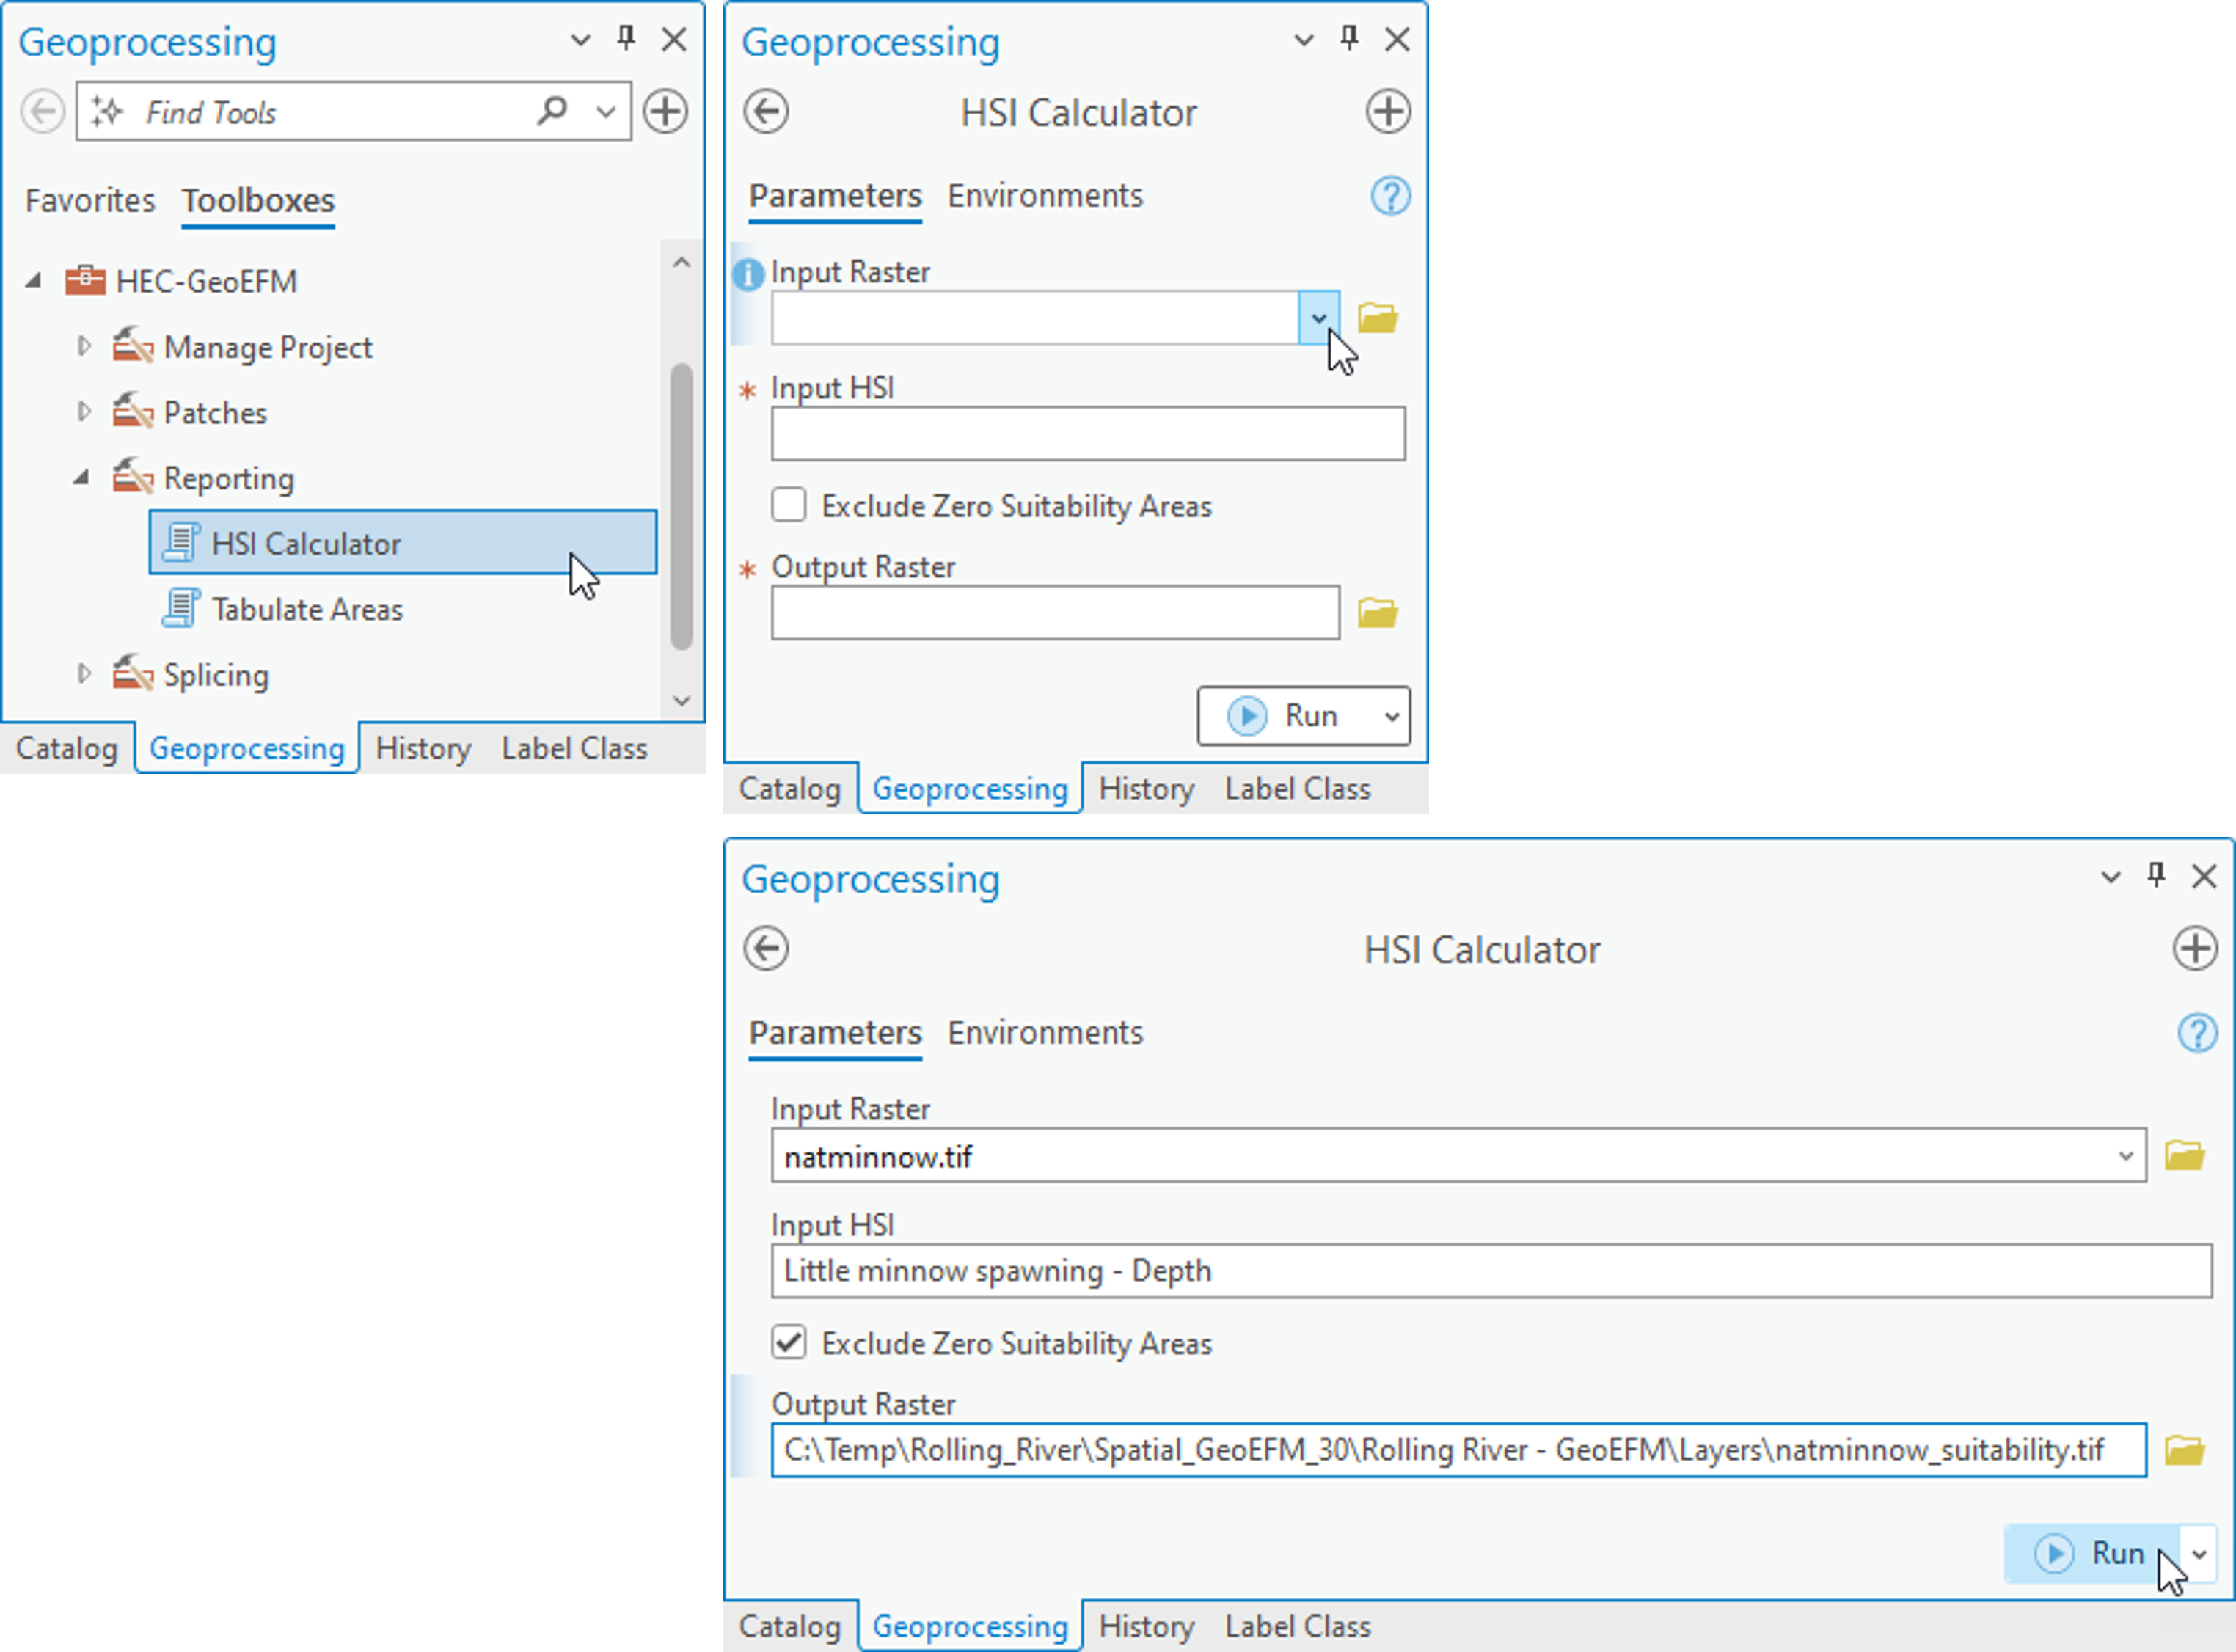
Figure 2. The HSI Calculator allows users to apply an HSI to compute a suitability raster.
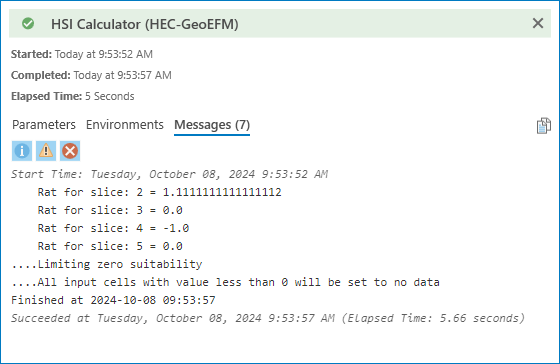
Figure 3. Applying the HSI Calculator to compute a suitability raster.
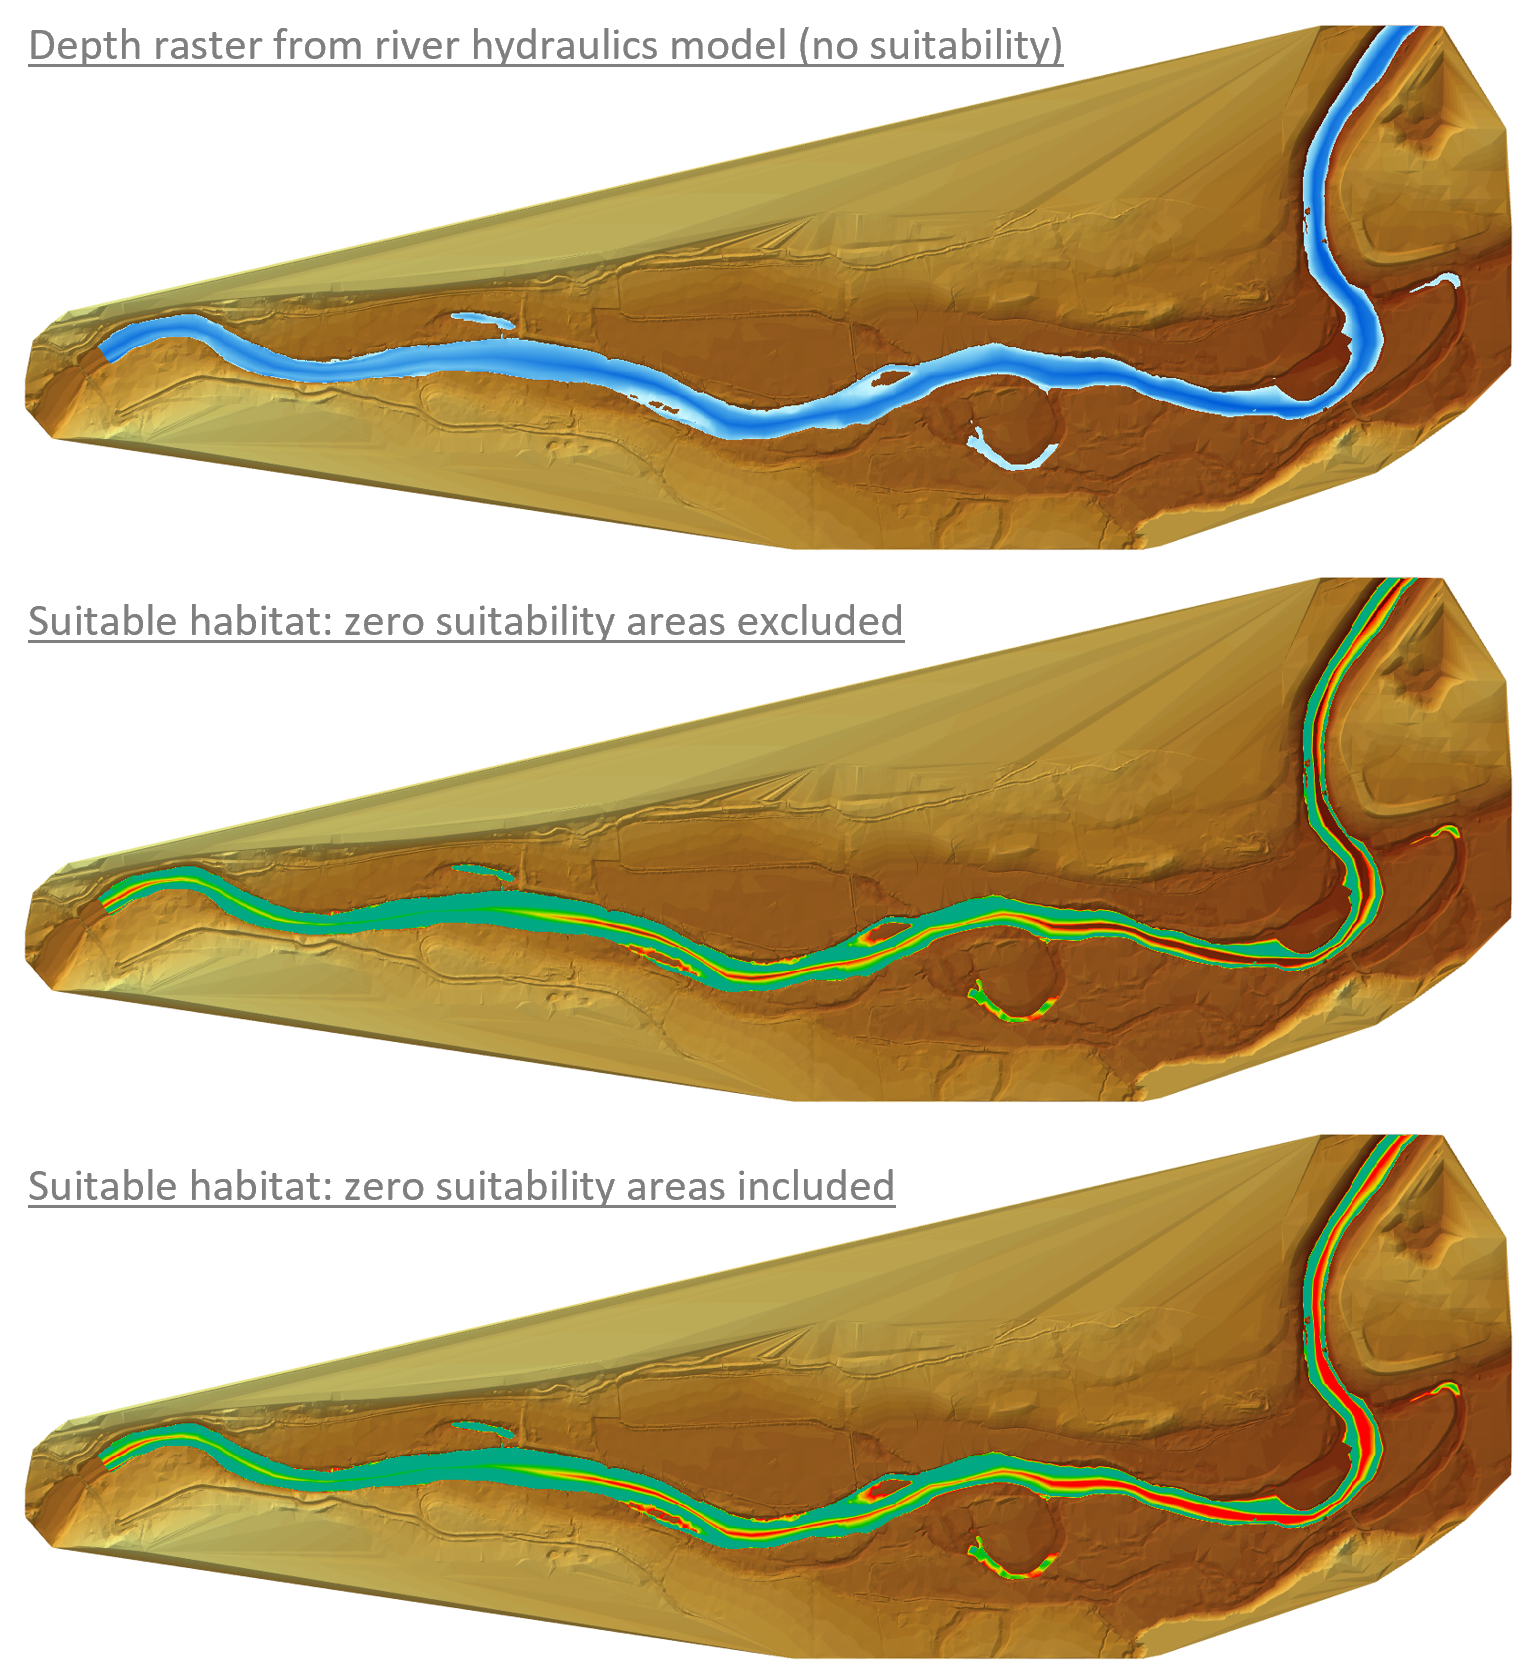
Figure 4. Spatial layers for Little minnow spawning habitat overlaid on land surface topography. Top image shows a depth raster (blue) generated by a river hydraulics model. Middle and bottom images show suitability rasters generated by applying a HSI to the depth raster with zero suitability areas excluded and included, respectively.