Applying a HSI to create a layer of suitable habitat is done via the Reporting - HSI Calculator tool. Initiating the HSI Calculator tool opens an interface that prompts the user to pick an Input Raster, an Input HSI, and to name an Output Raster. Additionally, there is an option to either exclude (checked) or include (unchecked) zero suitability areas from the output raster (Figure 12).

Figure 12. Reporting - HSI Calculator allows users to apply an HSI to compute a suitability raster.
Clicking the Run button translates input raster values to suitabililities according to the selected HSI paired data set and then stores suitability results as output raster values (Figure 13). For example, a value of 2.1 feet from an input raster of water depths (natminnow.tif) would be translated to a suitability of 1.0 based on the “Little minnow spawning - Depth” HSI and then that and other values would be saved to the output raster. A depth value of 5.1 feet would be translated to a suitability of 0.0 and included in the output raster as 0.0 if the Exclude Zero Suitability Areas option was unchecked and as NoData if the option was checked.

Figure 13. Applying the HSI Calculator to compute a suitability raster.
Please note that quality control for application of the HSI Calculator is left wholly to the user. GeoEFM does not verify data, check units, monitor suitability ranges, or enforce ranges. Recommended practices are to 1) make sure that the input raster and the HSIValue use the same variable and units, 2) use suitabilities (SuitabilityValue) that range from 0 to 1, and 3) define HSIs with HSIValue ranges that fully encompass the range of input raster values.
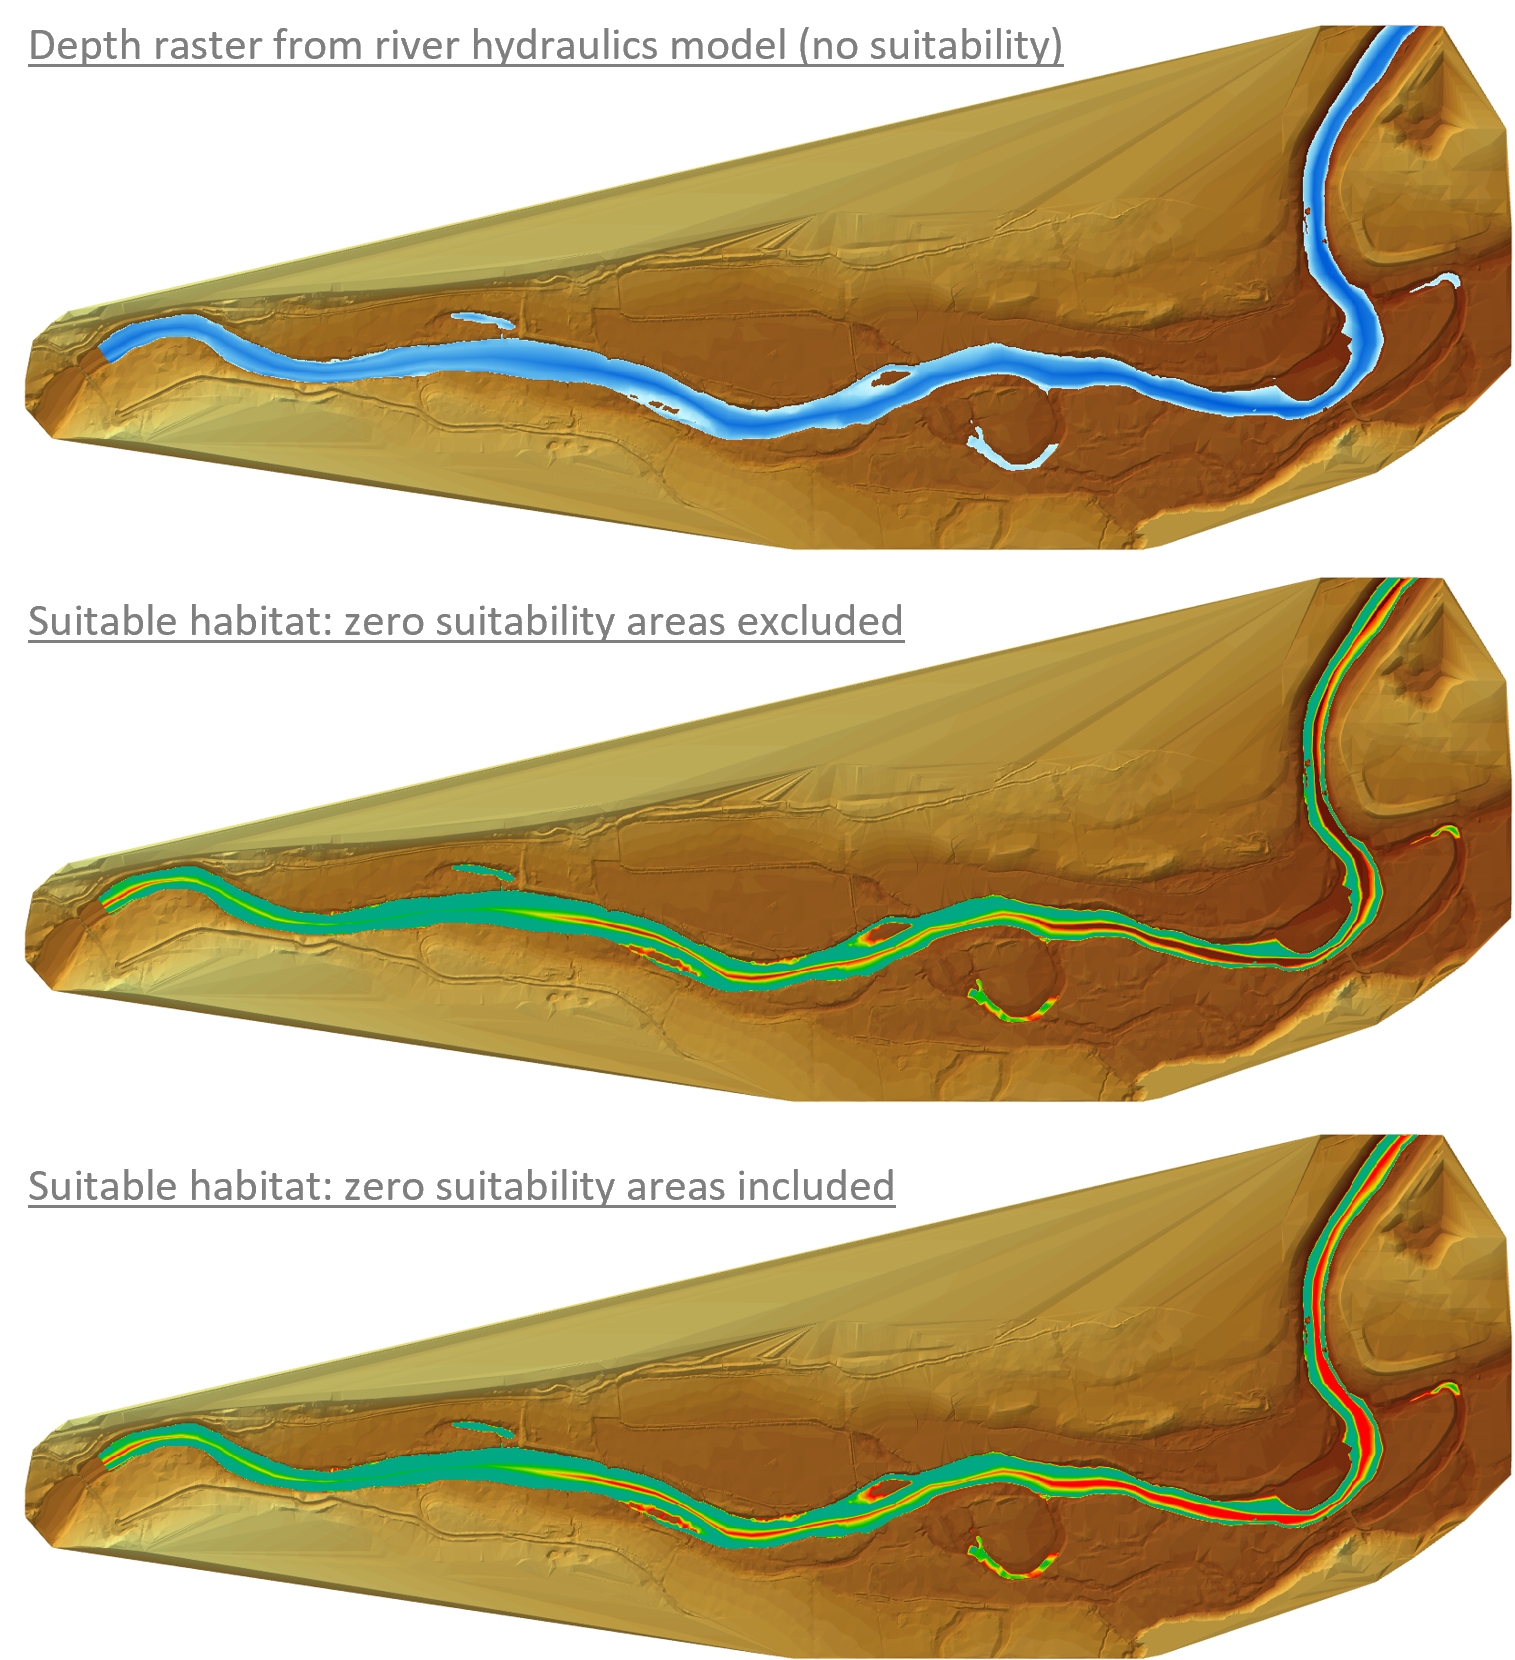
In GeoEFM, HSI are applied only to raster layers. Output layers generated are also rasters. The values of these suitability rasters are a measure of quality and can be used by other GeoEFM tools to investigate the areas and connectivities of suitable habitat. Output rasters are automatically added to map contents of the GeoEFM project and assigned a red-green color ramp (Figure 14).

Figure 14. Spatial layers for Little minnow spawning habitat overlaid on land surface topography. Top image shows a depth raster (blue) generated by a river hydraulics model. Middle and bottom images show suitability rasters generated by applying a HSI to the depth raster with zero suitability areas excluded and included, respectively.