Download PDF
Download page Introduction and Software Requirements.
Introduction and Software Requirements
GeoEFM is a software tool developed to support spatial analyses commonly used during applications of the Ecosystem Functions Model (HEC-EFM). GeoEFM is programmed as a toolbox for ArcGIS Pro 3.0, 3.1, 3.2, and 3.3. Previous versions of GeoEFM are programmed as extensions for ArcMap. Use of GeoEFM 1.0 requires a user license for ArcMap 9.3, 9.3.1, 10.0 or 10.1 (ArcView level license). Use of GeoEFM 2.0 requires a user license for ArcMap 10.1, 10.8.1, or 10.8.2 (advanced level license). Spatial Analyst and 3D Analyst extensions for ArcMap must also be installed and activated for any combination of GeoEFM and ArcMap. Use of GeoEFM 3.0 requires an advanced level license for ArcGIS Pro (Pro).
GeoEFM provides three primary capabilities for users planning ecosystem restoration or water management scenarios: 1) management of spatial data sets, 2) computation and comparisons of habitat areas, and 3) assessment of the habitat functionality via a selection of routines that consider habitat area, connectivity, and distribution.
Additionally, GeoEFM packages spatial functions that are commonly used in EFM applications:
- Entry, import, archival, editing, and viewing of habitat suitability indices
- Application of habitat suitability indices
- Splicing of habitat maps for systems of wetlands, streams, and rivers
This user’s manual provides an overview of GeoEFM and illustrates how the software is applied. Many figures in this document show a GeoEFM project being built and used to assess ecosystem conditions for the Rolling River, which is the fictional river also used in the demonstration project and user guidance for EFM.
Use of GeoEFM follows use of EFM. Therefore, it is important for GeoEFM users to understand EFM and the process that software supports to analyze water and environmental resources. This is true whether GeoEFM is being used to compute habitat areas, assess habitat suitability, splice maps to make habitat mosaics, or investigate the spatial distribution and functionality of habitat in long reaches of river or wetland areas.
A brief description of EFM is provided in Chapter 2 of this manual. Please refer to the EFM Quick Start Guide (USACE 2024) and other user guidance for more background about EFM (https://www.hec.usace.army.mil/software/hec-efm/documentation.aspx). The hydrologic and ecologic scenarios described herein are detailed in the Quick Start Guide. The reference for the Quick Start Guide follows:
U.S. Army Corps of Engineers (USACE). 2024. HEC-EFM: Ecosystem Functions Model - Quick Start Guide. CPD-80a. Hydrologic Engineering Center, Davis, CA.
GeoEFM is part of a group of technologies called the EFM Suite. Collectively, the EFM Suite assists users with tasks common in ecological modeling, including time series analyses, habitat mapping, and simulation of population dynamics, thereby supporting a range of possible applications. The EFM Suite consists of EFM, EFM Plotter, GeoEFM, and EFMSim, as shown in Figure 1 and described in Table 1.
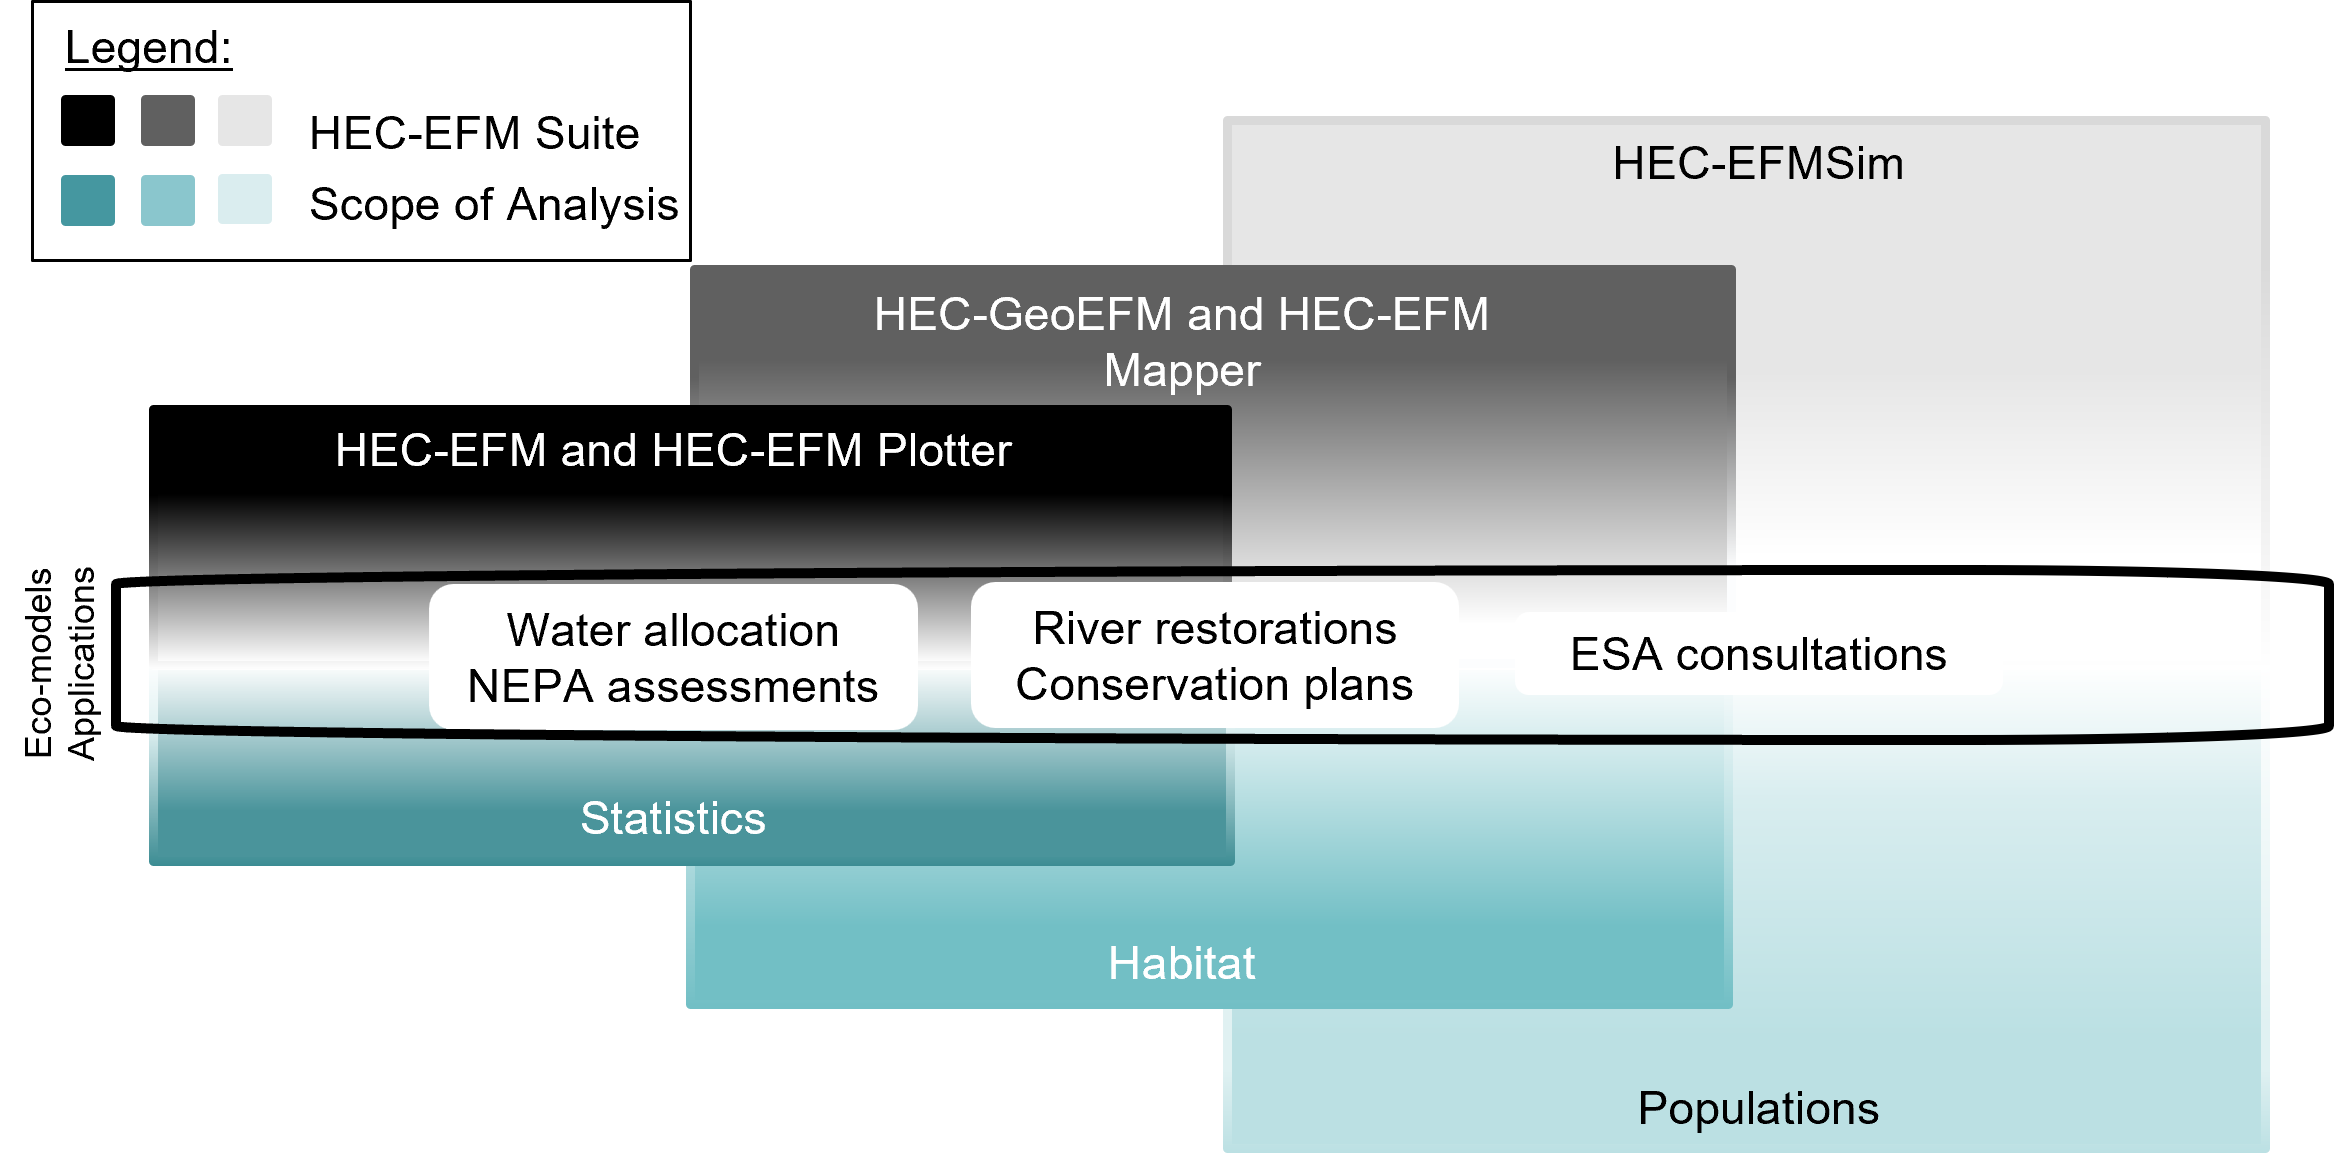
Figure 1. The EFM Suite and the tasks and applications it supports.
Table 1. Software of the EFM Suite.
Software | Description |
HEC-EFM | Used to perform time series analyses to help determine ecosystem responses to changes in the flow regime of a river or connected wetland -https://www.hec.usace.army.mil/software/hec-efm/ |
HEC-EFM Plotter | Displays and assists with interpretation of EFM output. Commonly used in conjunction with EFM - https://www.hec.usace.army.mil/software/hec-efm-plotter/ |
HEC-GeoEFM | ArcMap extension to support habitat mapping and other spatial analyses commonly performed during applications of EFM - https://www.hec.usace.army.mil/software/hec-geoefm/ |
HEC-EFMSim | Performs spatial and temporal simulations of ecosystems. Outputs include animations of ecosystems. Population dynamics model - https://www.hec.usace.army.mil/software/hec-efmsim/ |
Text in this manual has been formatted to help readers keep track of the different types of information presented. Italics are used to identify software features that are available through the user interfaces of GeoEFM. Underlines are used to identify model input data, which includes the names of flow regimes and relationships used in the demonstration project. Bold is used to highlight key information for individual sections of text.