Download PDF
Download page Peaks Over Threshold Analysis in HEC-SSP.
Peaks Over Threshold Analysis in HEC-SSP
By: Avital Breverman, P.E.
Introduction
The Hydrologic Engineering Center's (HEC) Statistical Software Package (HEC-SSP) Version 2.4 will introduce a new analysis type, the Peaks Over Threshold Analysis. This functionality will provide a streamlined approach to performing a peaks over threshold analysis on a variety of hydrologic and meteorologic data. The Peaks Over Threshold Analysis implementation within HEC-SSP was funded by the U.S. Army Corps of Engineers (USACE) Headquarters General Investigations program.
Why Use a Peaks Over Threshold Analysis?
Civil engineering is largely a field of extremes. Hydrologists are often interested in answering questions, such as "What is the probability that river flow exceeds 10,000 cfs?" or "What is the depth of precipitation corresponding to an annual exceedance probability (AEP) of 1/100?". Frequency analyses relate the magnitude of hydrologic and meteorologic events to their frequency, which is expressed as an AEP.
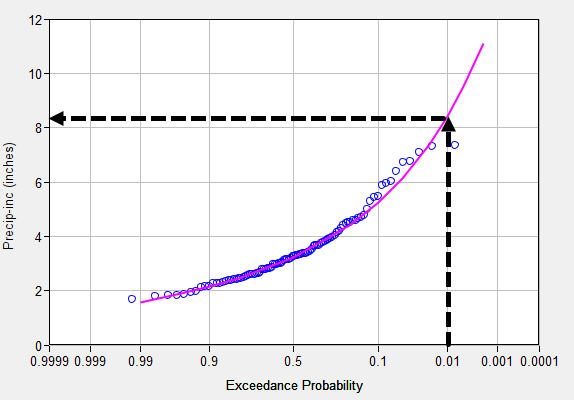
Figure 1. Example of a precipitation frequency curve.
In the United States, federal flood frequency guidelines have been published periodically since 1967 (England et al., 2019). The most recent version, Guidelines for Determining Flood Flow Frequency Bulletin 17C, was published by the Advisory Committee on Water Information Hydrology Subcommittee in 2019. Historically, flood frequency analysis has used the block maxima approach, from extreme value theory, to select flood events (Gumbel, 1958). In the United States, streamflow time series are partitioned into water year blocks, spanning October 1st through September 30th. The peak flows from each yearlong block in the period of record at a streamflow gage are referred to as the annual maximum series (AMS). HEC-SSP allows users to implement a flood frequency analysis of an AMS using Bulletin 17C procedures.
While the block maxima approach to frequency analysis has advantages, hydrologic and meteorologic processes are random and do not follow an annual cycle. In addition, some annual peak events can be considered opportunistic peaks, meaning that they happen to be the largest event in a dry year rather than true extreme events. An alternative to the block maxima approach is the peaks over threshold (POT) method (Balkema & de Haan, 1974; Pickands, 1975). The POT approach is particularly relevant for rivers in arid and semi-arid regions where the largest flow in a dry year may be so small that it provides no relevant information for determination of flood magnitudes (Wang, 1991), in rivers that experience multiple flood events per year, and in rivers that experience floods from a mixed population (Breverman et al., 2023; Breverman, 2023). The peaks over threshold approach postulates that only events above a certain threshold, called a partial duration series (PDS), provide information about floods (Todorovic & Zelenhasic, 1970; Todorovic & Rouselle, 1971; Wang, 1991; Naghettini, 2017). As a result, the events in the PDS can be different than those in the AMS, as illustrated in Figure 2 and Figure 3. Figure 2 provides a conceptual illustration, while Figure 3 provides a historical flow data record from Orestimba Creek in California, a semi-arid watershed.
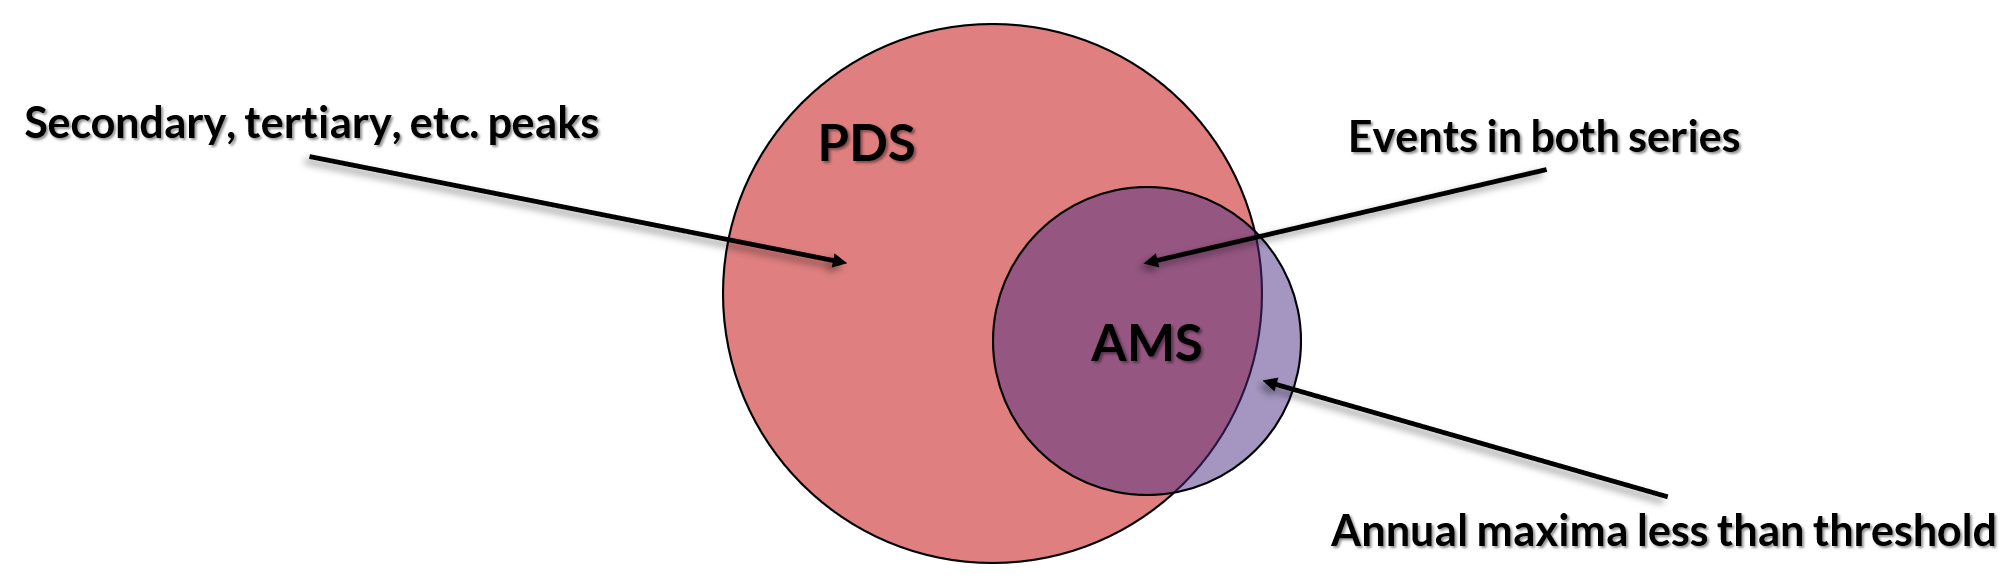
Figure 2. Venn diagram comparison of partial duration series and annual maximum series.

Figure 3. Streamflow annual maximum series versus partial duration series.
The peaks over threshold approach to flood frequency analysis has the potential to increase the predictive capability of flood frequency analysis techniques, partially due to larger flood sample sizes. This consideration is particularly important in rivers that experience mixed populations, or floods caused by multiple causal mechanisms, such as snowmelt and rainfall. HEC is currently collaborating with the Federal Emergency Management Agency (FEMA) and the U.S. Geological Survey (USGS) in an attempt to improve flood frequency methods through the identification and treatment of mixed populations. While Bulletin 17C does not provide "specific guidelines... for defining flood events to be included in a partial duration series" or "for conducting a partial duration frequency analysis," the guidance does allow for deviation from the standard procedure if there are "compelling technical reasons" (England et al., 2019). A number of U.S. Army Corps of Engineers districts have used POT approaches to frequency analyses for ecosystem restoration projects and in arid regions that experience multiple flood events in some years and no flood events in other years.
HEC-SSP Implementation
Some elements of the new Peaks Over Threshold Analysis already exist in HEC-SSP. For instance, users can already filter a dataset to a partial duration series based on a threshold value, time separation, and magnitude differential criteria as shown in Figure 4. However, the Data Filter tool offers no visualizations to aid the user in the selection of a threshold.
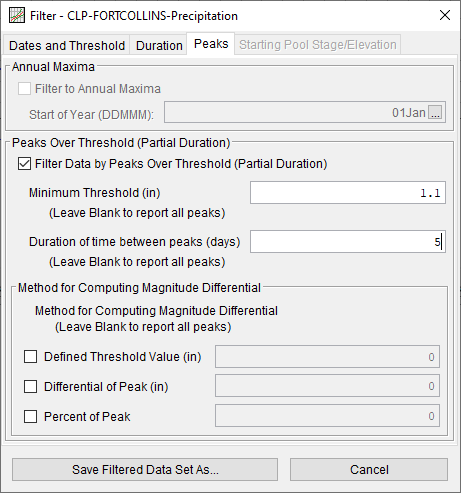
Figure 4. Data Filter partial duration options.
Typically, the most challenging aspect of a POT analysis is selection of an appropriate threshold value. A high threshold ensures that the sample is comprised of extreme events. However, selecting too high of a threshold value results in a small sample size and may violate the assumption that the model is representative of the population. On the other hand, selecting too low of a threshold value means that hydrologic events that are not extreme are included in the sample. In addition, the events in the sample should be independent of each other. To ensure independence, time separation and magnitude differential criteria can be applied. Time separation criteria ensures that enough time has passed between events, while magnitude differential criteria ensures that the hydrograph has sufficiently receded between floods or that two large precipitation depths are not from the same event.
Users can fit a Generalized Pareto distribution to a partial duration series in HEC-SSP's Distribution Fitting Analysis (Figure 5). However, the results of the distribution fitting procedure are not suitable for use in USACE studies; because the probabilities are conditional probabilities, not AEPs.
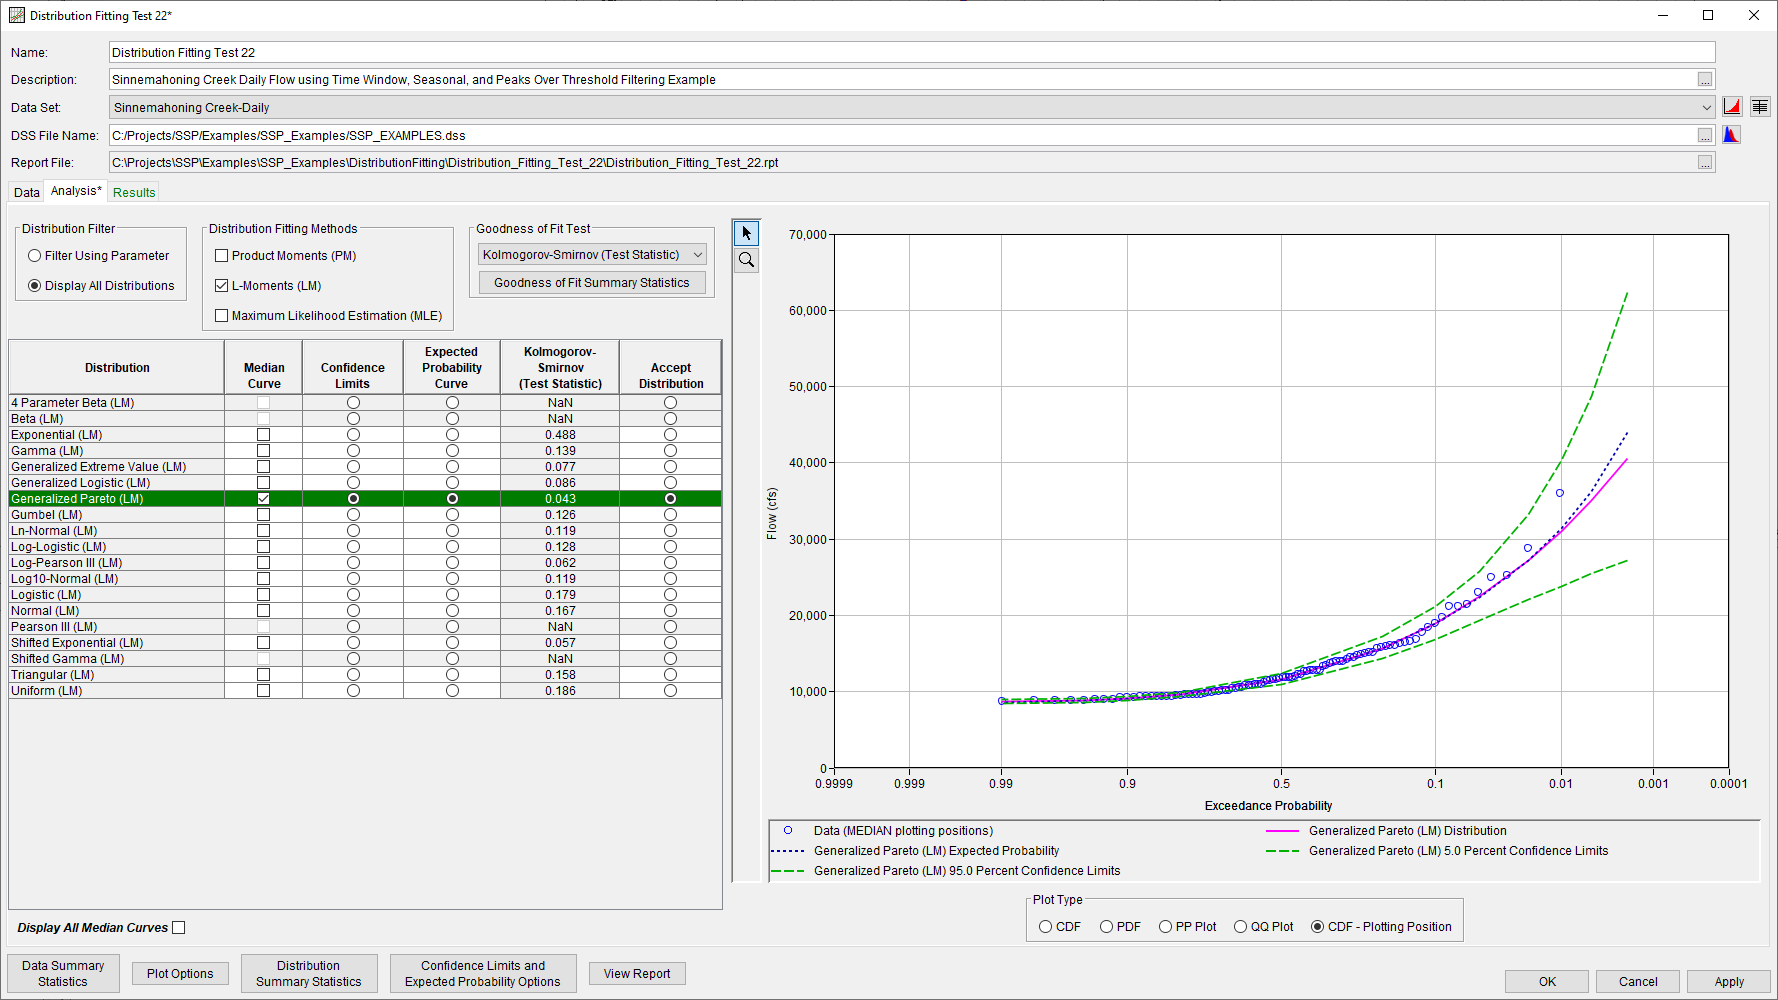
Figure 5. Distribution Fitting Analysis | Analysis tab.
The new Peaks Over Threshold Analysis will allow users to convert partial duration probabilities to AEPs through a process referred to as annualization. Two annualization methods, empirical (Langbein, 1949) and analytical (Madsen et al., 1997a; Madesen et al., 1997b), will be available. Three distribution fitting method choices will be available for use, as shown in Figure 6: Product Moments, L-Moments, and Maximum Likelihood Estimation. As in other HEC-SSP analyses, users will be able to define the year specification, truncate the computational time window, modify the displayed frequency ordinates, and change the output labeling.

Figure 6. Peaks Over Threshold Analysis | General tab.
Users will also be able to compute confidence limits and an expected probability curve, as shown in Figure 7.

Figure 7. Confidence Limits And Expected Probability Options dialog.
The new Peaks Over Threshold Analysis Filtering Tab will provide the same partial duration filtering options as the existing Data Filter, including the option to save the PDS as a new dataset, as shown in Figure 8. A new time separation method that relates time between peaks to drainage area will also be included. This time separation criterion, which originated in the appendices of Bulletin 17, can be used to ensure independence between streamflow events in a PDS (U.S. Water Resources Council, 1976).
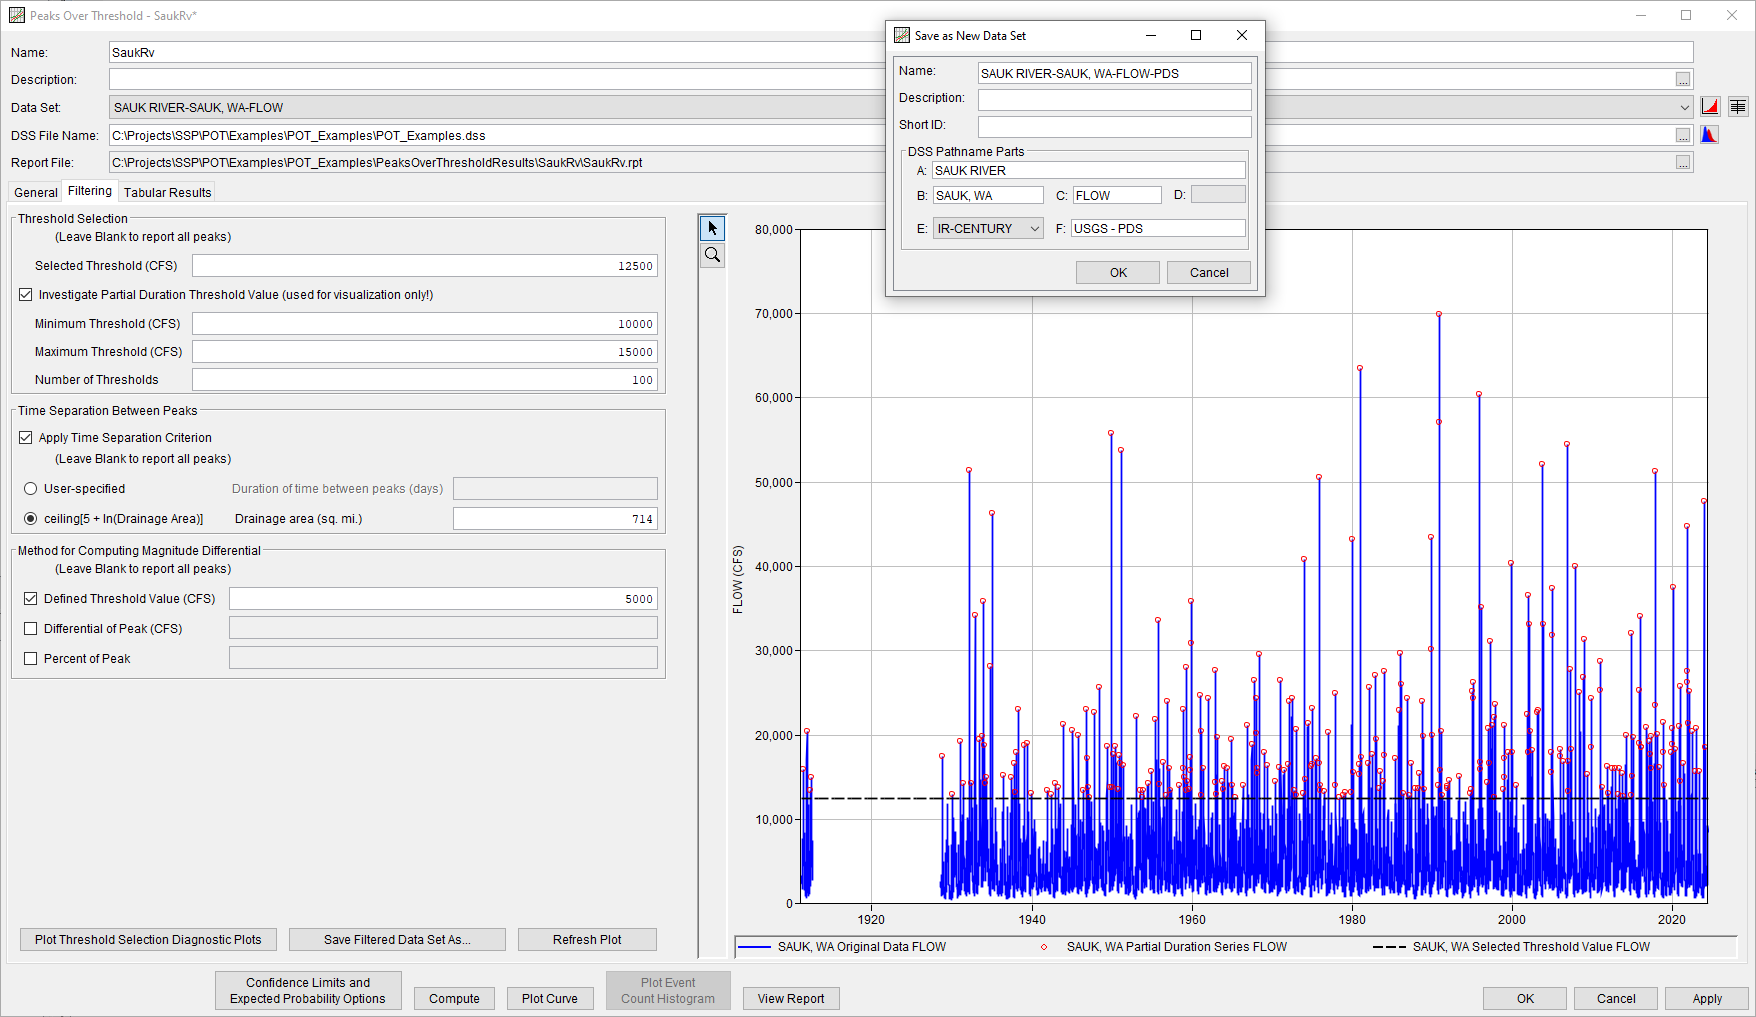
Figure 8. Peaks Over Threshold Analysis | Filtering tab.
The user will be able to generate five diagnostic plots to assist with threshold selection:
- Number of exceedances,
- Rate of exceedances,
- Generalized Pareto distribution shape parameter,
- Mean excess, and
- Anderson-Darling right tail weighted test statistic.
Each of these quantities will be plotted against varying threshold values, as shown in Figure 9.
The Anderson-Darling test statistic is an empirical distribution function statistic which assigns more weight to the tails of the data than similar measures and is available in the existing Distribution Fitting Analysis as a goodness of fit statistic. Sinclair et al. (1990) originally proposed the right tail weighted Anderson-Darling statistic while Solari et al. (2017) proposed the use of the right tail weighted Anderson-Darling statistic as an automated threshold selection method for a partial duration series. In HEC-SSP, users will be able to use the test statistic to help inform the choice of a threshold.
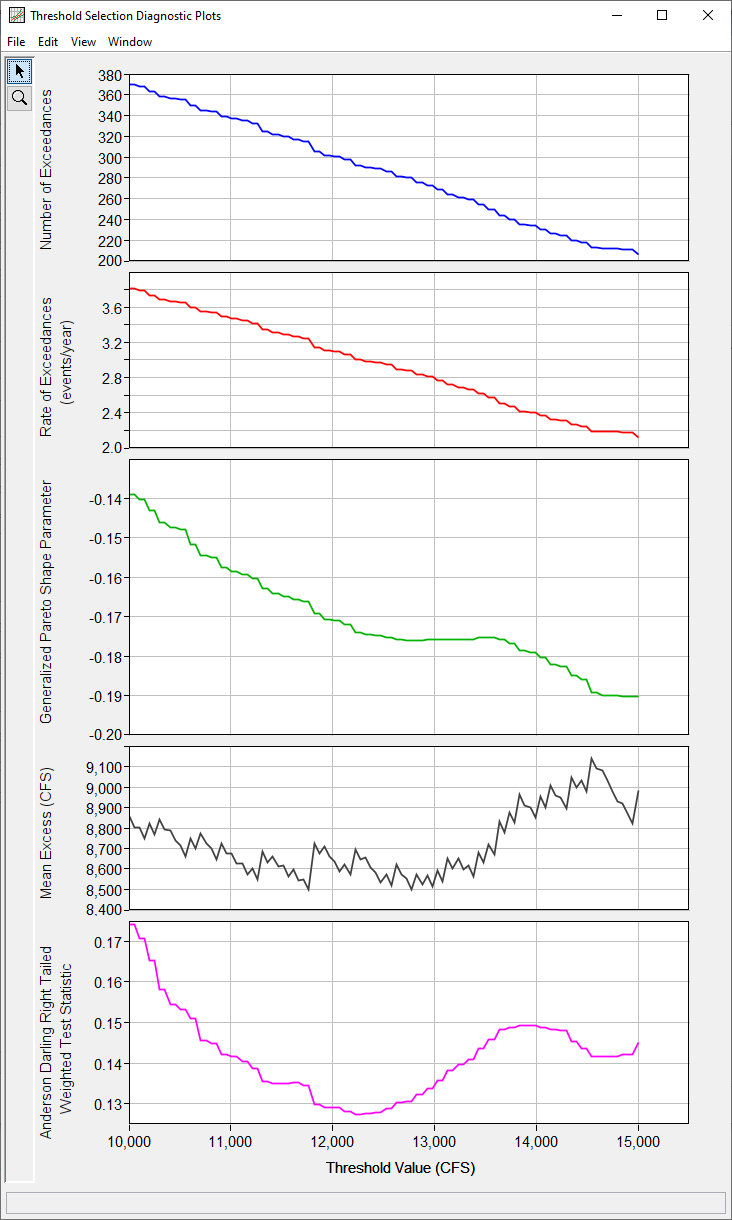
Figure 9. Peaks Over Threshold Analysis | Threshold Diagnostic Data Plots.
The following results will be available to users.
- Tabular results, including:
- Frequency curve quantiles, including confidence limits and expected probability (if selected),
- Generalized Pareto and Generalized Extreme Value distribution parameter values (if the Analytical Annualization Method is selected), and
- Diagnostic data for the selected threshold.
- Annualized frequency curve, including confidence limits and expected probability (if selected).
- Histogram of event count frequency (number of events in each year of the period of record versus frequency), shown in Figure 10.
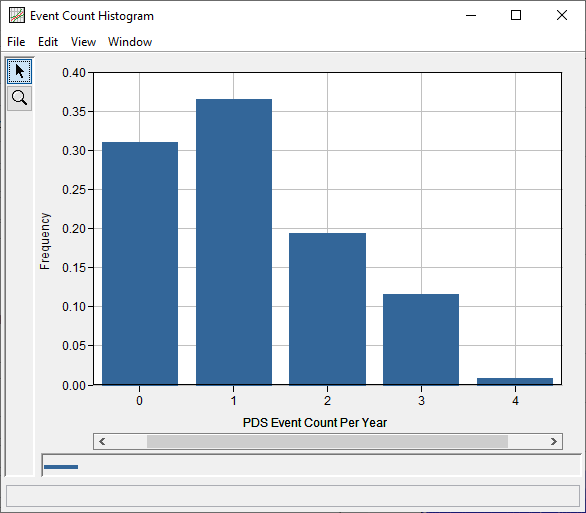
Figure 10. Peaks Over Threshold Analysis | Event Count Histogram.
The new features will be documented in the HEC-SSP User's Manual and Tutorials and Guides when Version 2.4 is released in Fiscal Year 2025. In the meantime, users are encouraged to explore the existing HEC-SSP documentation on partial duration series: Partial Duration Series Workshops Using R and Partial Duration Series using HEC-SSP and Excel.
References
Balkema, A. A., and de Haan, L. (1974). Residual Life Time at Great Age. The Annals of Probability, 2(5), 792-804.
Breverman, A., Bartles, M., Karlovits, G., and Arabi, M. (2023). Addressing Mixed Populations in Flood Frequency Analyses: A Case Study in Eastern Pennsylvania. Sedimentation and Hydrologic Modeling Conference. St. Louis, MO: SEDHYD.
Breverman, A. (2023). Mixed Populations Flood Frequency Analysis in the Mid-Atlantic Region of the United States [Master's thesis, Colorado State University]. Mountain Scholar Digital Collections of Colorado.
England, J. F., Cohn, T. A., Faber, B. A., Stedinger, J. R., Thomas, W. O., Veilleux, A. G., Kiang, J. E., Mason, R. R. (2019). Guidelines for Determining Flood Flow Frequency Bulletin 17C. Reston, VA: U.S. Geological Survey.
Langbein, W. B. (1949). Annual Floods and the Partial-duration Flood Series. American Geophysical Union, 30(6), 879-881.
Madsen, H., Rasmussen, P., and Rosbjerg, D. (1997a). Comparison of annual maximum series and partial duration series methods for modeling extreme hydrologic events 1. At-site modeling. Water Resources Research, 33(4), 747-757.
Madsen, H., Pearson, C., and Rosbjerg, D. (1997b). Comparison of annual maximum series and partial duration series methods for modeling extreme hydrologic events 2. Regional modeling. Water Resources Research, 33(4), 759-769.
Naghettini, M. (2017). Fundamentals of Statistical Hydrology. Cham, Switzerland: Springer International Publishing.
Pickands III, J. (1975). Statistical Inference Using Extreme Order Statistics. The Annals of Statistics, 3(1), 119-131.
Sinclair, C. D., B. D. Spurr, and M. I. Ahmad. (1990). Modified Anderson Darling test, Commun. Stat. Theory Methods, 19(10), 3677–3686, doi:10.1080/03610929008830405.
Solari, S., M. Egüen, M. J. Polo, and M. A. Losada. (2017). Peaks Over Threshold (POT): A methodology for automatic threshold estimation using goodness of fit p-value, Water Resour. Res., 53, 2833–2849, doi:10.1002/2016WR019426.
Todorovic, P., and Rouselle, J. (1971). Some Problems of Flood Analysis. Water Resources Research, 7(5).
Todorovic, P., and Zelenhasic, E. (1970). A stochastic model for flood analysis. Water Resources Research, 6(6), 1641-1648.
U.S. Water Resources Council. (1976). Guidelines for Determining Flood Flow Frequency, Bulletin No. 17. Washington, D.C.: U.S. Water Resources Council, Subcommittee on Hydrology.
Wang, Q. (1991). The POT model described by the generalized Pareto distribution with Poisson arrival rate. Journal of Hydrology, 129, 263-280.