By: Stanford Gibson, Ph.D.
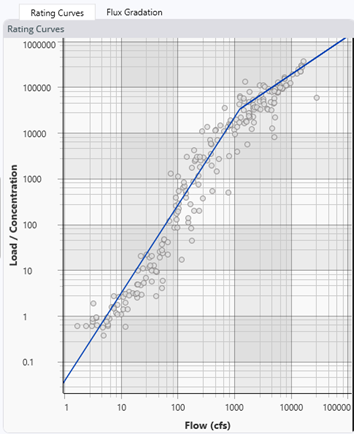
Sediment budgets and sediment transport models often require engineers and scientists to fit flow-load rating curves through sediment data. But sediment measurements can vary by an order of magnitude (or more) for the same flows. These measurements are so variable, sediment practitioners often call them a “data cloud” (see Figures). Because sediment measurements are so variable and non-linear, rating curves can be very sensitive to the statistical assumptions and approaches. The Corps of Engineers and USGS have several rating-curve development best-practices, that are not widely known or always applied on our projects.
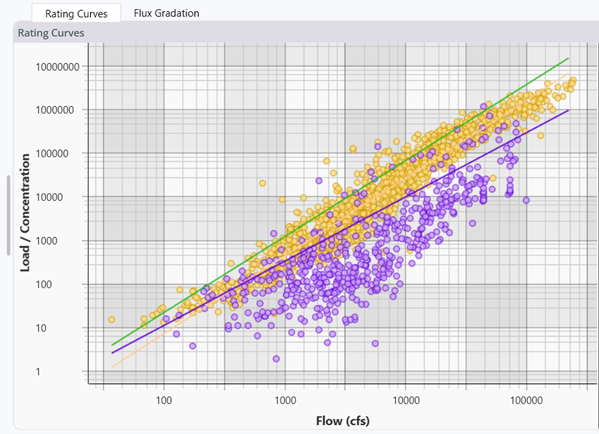
HEC developed a rating curve analysis tool to help users search USGS gages that have sediment data and download suspended-load and gradation data automatically. Then the tool steps users through several statistical best practices. It automatically applies a power-fit, bias correction that can affect results by 20-40% (or more) but is not reflected in most analyses (like excel). It can also find an inflection point and fit a “bent” rating curve when a single-slope fit is not appropriate (Figure 1). The tool helps identify and average replicates, quantify analytical or tabular rating curves, and identify suspended-load gradation trends. It also includes tools to identify temporal trends (non-stationarity, Figure 2) or distinct rising-limb/falling-limb sediment trends (i.e. hysteresis).
HEC has also released accessible, multi-media, tech-transfer tools to help users apply this tool and make sense of these data. In addition to detailed, online, user documentation on each method, HEC has also released several video tutorials and a podcast with the USGS that discusses these sediment data (including new features in HEC-RAS Version 6.4). This tool was funded by the USACE Mississippi River Geomorphology and Potamology R&D program (MRG&P).
Last Modified: 2023-06-09 09:25:26.45