Download PDF
Download page Case Study: La Magüana River Dam, Dominican Republic.
Case Study: La Magüana River Dam, Dominican Republic
Disclaimer
HEC (nor USACE) did not perform this study. As such, we cannot verify accuracy of the study results. However, we are providing this example for others to see exciting applications of HEC-HMS. If you are interested in having your HEC-HMS application posted within this space for others to enjoy and learn from, please contact us: hec.hms@usace.army.mil
Author
Wellman Lake: wellman.lake@gmail.com
Introduction
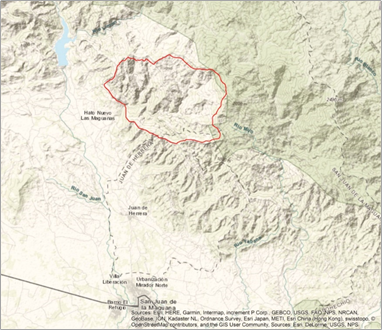
In 2018 a feasibility study was conducted to evaluate the possibility of taking advantage of the water resources of the La Magüana River, a tributary of the San Juan River in the Dominican Republic. The Magüana River basin is located southeast of the San Juan River basin, with the dam site at 263785.00 E and 2097181.00 N. The aforementioned study was carried out using the hydrological model HSPF version 9, analyzing 22 years’ worth of data. This report shows the results of applying the HEC-HMS model to the same basin, taking the HSPF-9 resulting runoff time series as the HEC-HMS calibration goal.
Hydrometeorological Data
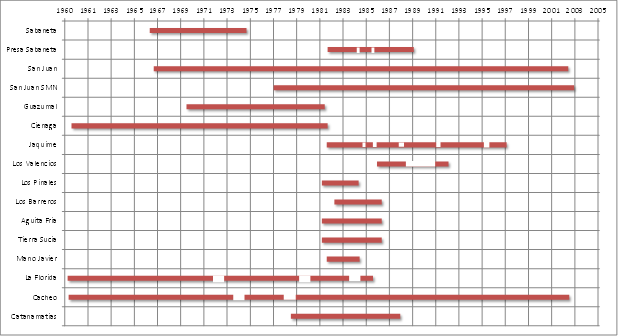
The data for this report is the same used in the original study. The hydrometeorological data available in the basin region was evaluated in order to determine the most appropriate methodology for the purposes of the study. The following table summarizes the availability of rainfall and weather data in the basin region.
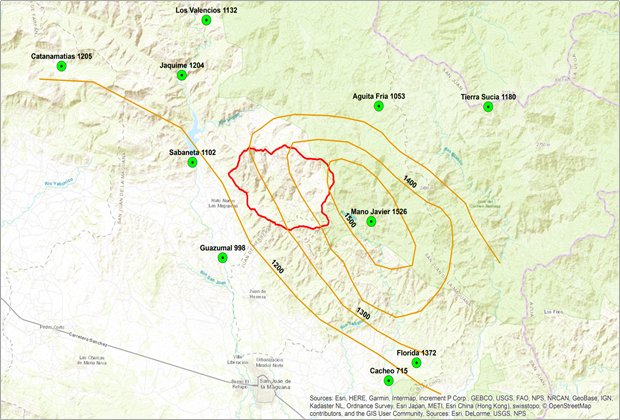
In order to establish the relationship between the areal rainfall over the basin and the punctual rainfall in the Sabaneta station (the closest to the study basin), an isohyets map (illustrated below) was drawn for the period 1983-1986 in which the rainfall data had the best areal coverage, albeit with some missing data.
The modified daily rainfall from Sabaneta station was disaggregated to an hourly format using the patterns of nearby pluviograph stations.
The evaporation data from the San Juan Km-11 station was selected, with adjustments made to consider the higher elevation and increased cloud cover present in the basin area.
The Magüana River basin is ungauged, but the Instituto Dominicano de Recursos Hidraulicos (INDRHI) has carried out several gauging campaigns at specific sites in the basin. These campaigns correspond to three (3) different periods, as shown in the following table. In the absence of continuous flow registration, the gauging campaigns at specific sites provide insight into the order of magnitude of the flow rate of the Magüana River. The capacity at the Magüana and Magüana Arriba sites are affected by the derivations of the Los Santiles canal, on which construction was completed in the early 1970s.
Site | Samples | Period | Flow Rate (cms) |
|---|---|---|---|
El Naranjal | 29 | 1976/10 – 1966/07 | 1.436 |
Magüana | 54 | 1989/03 – 2008/07 | 0.904 |
Magüana Arriba | 3 | 1987/01 – 1987/05 | 0.857 |
Geomorphological Data
Using a satellite image with a resolution of 12.5 m, the HEC-HMS GIS tools were used for the delimitation of the study basin. The basin was divided into 3 sub-basins in order to better reflect the geomorphological conditions. The HEC-HMS also calculated important geomorphological data such as: longest flowpath length, longest flowpath slope and drainage density, among others. In addition, two reaches were defined to simulate the effect of transit through channels in the basin. The following figure shows the subbasins as delineated with the HEC-HMS GIS tools and the reaches.
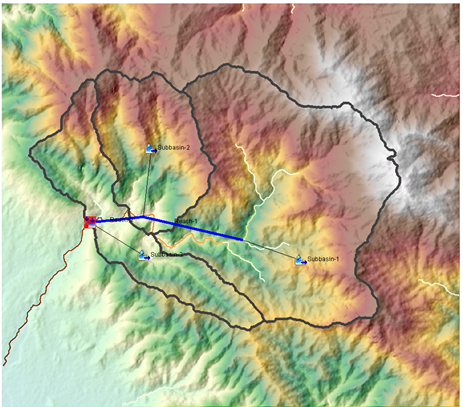
The total area of the study basin is 52.17 km2. Table 3 presents the area of each subbasin.
Element Name | Area (sq km) |
|---|---|
Subbasin 1 | 31.12 |
Subbasin 2 | 10.49 |
Subbasin 3 | 10.56 |
Methodology
For each subbasin the following calculation methods were used:
Parameter | Method |
|---|---|
Canopy | Simple Canopy |
Surface | Simple Surface |
Loss | Soil Moisture Accounting |
Transform | Kinematic Wave |
Baseflow | Linear Reservoir |
For the reaches, Muskingum-Cunge was selected as the routing method. To describe the reaches the eight-point method was used, providing two cross sections, one for each reach.
The period for the reconstruction of the flow series was May 1967- February 1990 (22 years). The years 1979-1980 were chosen as the calibration period.
The precipitation data used was introduced into the model in an hourly format. The runoff time series obtained through the previous simulation using the HSPF was used as the “observed flow” in the HEC-HMS for calibration purposes.
The Linear Reservoir Parameters table, Muskingum-Cunge Reach Routing Parameters table, and the SMA Parameters table show the parameters used for the methods considered most relevant in the simulation with the HEC-HMS. All these parameters were estimated from experience and previous studies in nearby watersheds.
Results
Below is the Statistic Report table produced by HEC-HMS containing data which confirms the high performance rating obtained using the HEC-HMS calibration in comparison to the data obtained with the HSPF.
Computation Point | RMSE Stdev | Nash Sutcliffe | Percent Bias | R2 |
|---|---|---|---|---|
Sink-1 | 0.38 | 0.86 | -1.03 | 0.86 |
According to the article Model Evaluation Guidelines for Systematic Quantification of Accuracy in Watershed Simulations by Moriasi et al (2007), these values fall within the "Very Good" category for model performance on a daily and weekly time step.
Performance Rating | R2 | NSE | RSR | PBIAS |
|---|---|---|---|---|
Very Good | 0.65<R2≤1.00 | 0.65<NSE≤1.00 | 0.00<RSR≤0.60 | PBIAS≤±15 |
Good | 0.55<R2≤0.65 | 0.55<NSE≤0.65 | 0.60<RSR≤0.70 | ±15≤PBIAS<±20 |
Satisfactory | 0.40<R2≤0.55 | 0.40<NSE≤0.55 | 0.70<RSR≤0.80 | ±20≤PBIAS<±30 |
Unsatisfactory | R2≤0.40 | NSE≤0.40 | RSR>0.80 | PBIAS≥±30 |
Element Name | Baseflow Fraction | Number Reservoirs | Routing Coefficient | Initial Flow/Area Ratio |
|---|---|---|---|---|
Subbasin - 1 | ||||
Layer 1 | 0.3 | 2 | 30 | 0 |
Layer 2 | 0.7 | 1 | 800 | 0.01 |
Subbasin - 2 | ||||
Layer 1 | 0.3 | 1 | 30 | 0 |
Layer 2 | 0.7 | 2 | 1200 | 0.01 |
Subbasin - 3 | ||||
Layer 1 | 0.3 | 1 | 30 | 0 |
Layer 2 | 0.7 | 2 | 1200 | 0.01 |
Element Name | Method | Channel | Length (M) | Energy Slope | Mannings n | Left Mannings n | Right Mannings n | Cross Section Name | Initial Variable | Space - Time Method | Index Parameter Type | Index Celerity | Maximum Depth Iterations | Maximum Route Step Iterations |
|---|---|---|---|---|---|---|---|---|---|---|---|---|---|---|
Reach - 1 | Muskingum Cunge | 8 - point | 4449.13 | 0.1 | 0.05 | 0.05 | 0.05 | Reach_1 | Combined Inflow | Automatic DX and DT | Index Celerity | 1.52 | 20 | 30 |
Reach - 2 | Muskingum Cunge | 8 - point | 2311.31 | 0.1 | 0.05 | 0.05 | 0.05 | Reach_2 | Combined Inflow | Automatic DX and DT | Index Celerity | 1.52 | 20 | 30 |
Element Name | Percent Impervious Area | Initial Soil Storage Percent | Initial Gw1 Storage Percent | Initial Gw2 Storage Percent | Soil Maximum Infiltration | Soil Storage Capacity | Soil Tension Capacity | Soil Maximum Percolation | Groundwater 1 Storage Capacity | Groundwater 1 Routing Coefficient | Groundwater 1 Maximum Percolation | Groundwater 2 Storage Capacity | Groundwater 2 Routing Coefficient | Groundwater 2 Maximum Percolation |
|---|---|---|---|---|---|---|---|---|---|---|---|---|---|---|
Subbasin - 1 | 0 | 0 | 0 | 0 | 6 | 150 | 17 | 29 | 50 | 12 | 5 | 160 | 100 | 0.7 |
Subbasin - 2 | 0 | 0 | 0 | 0 | 6 | 150 | 17 | 29 | 50 | 12 | 5 | 160 | 100 | 0.7 |
Subbasin - 3 | 0 | 0 | 0 | 0 | 6 | 150 | 17 | 29 | 50 | 12 | 5 | 160 | 100 | 0.7 |
The following figure presents the comparison between HEC-HMS and HSPF daily hydrographs for the calibration period.
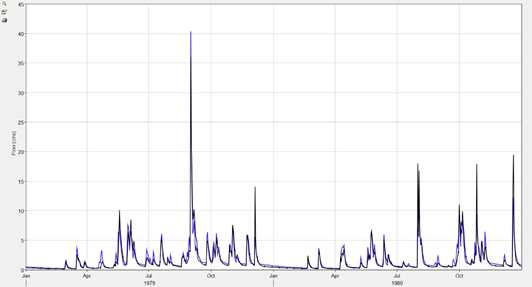
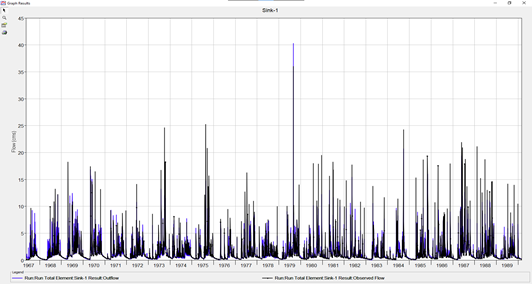
With the set of parameters resulting from the calibration process, the model was run throughout a period of 22 years. HEC-HMS produced a statistics report measuring the performance metrics of the HEC-HMS results versus the HSPF results.
Computation Point | RMSE Stdev | Nash Sutcliffe | Percent Bias | R2 |
|---|---|---|---|---|
Sink-1 | 0.43 | 0.82 | -4.44 | 0.82 |
As observed in the results from the previous table, the performance metrics of the model falls within the "Very Good" category proposed by Moriasi et al. The average flow obtained with HEC-HMS for the entire period is 1.36 m3/s. The average flow obtained with HSPF for the same period was 1.42 m3/s. The following figure shows the HEC-HMS runoff time series vs the HSPF’s runoff time series for the entire study period.
The flow duration curve was calculated for both time series. Points of interest in the curves are also compared specifically, flow rate with probability of exceedance of 50%, 80% and 95%.
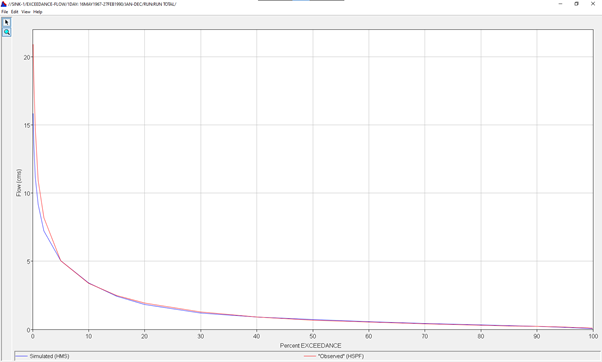
Exceedance | HSPF (cms) | HMS (cms) |
|---|---|---|
50% | 0.68 | 0.71 |
80% | 0.30 | 0.33 |
95% | 0.16 | 0.14 |
Conclusions
- HEC-HMS satisfactorily reproduces the results obtained with the HSPF in the basin of the La Magüana River dam site in the Dominican Republic during an approximate 22 year period.
- The mean flow value obtained with HEC-HMS corresponds adequately to the data received from INDRHI in El Naranjal, the dam site.
- The HEC-HMS kinematic wave method has been successfully applied for the rain-runoff transformation in a rural watershed.