Download PDF
Download page Case Study: Estimating Sediment Yield in the Upper North Bosque River Watershed (UNBRW).
Case Study: Estimating Sediment Yield in the Upper North Bosque River Watershed (UNBRW)
The purpose of this case study is to illustrate surface soil erosion and sediment routing computations through reservoirs and the stream network using HEC-HMS. This case study does not reflect an actual project.
Watershed Description
The surface soil erosion and sediment routing capabilities for HEC-HMS were applied to UNBRW, approximately 359.8 square miles (931.9 km2), located in Central Texas as shown in the following figure. The UNBRW is defined as the contributing area above Hico, Texas (Saleh, 2004).
The UNBRW is 98 percent rural. Primary land uses include rangeland (43 percent), forage fields (23 percent), and dairy waste application fields (seven percent) (McFarland, 1999). Dairy production is the dominant agricultural activity in this watershed. Other agricultural activities include peanut, range-fed cattle, pecan, peach, and forage hay production. Soils in the UNBRW are classified as fine sandy loams with sandy clay subsoil, calcareous clays, and clay loams (Ward, 1992). Elevation in the watershed above Hico (stream gage BO070) ranges from 981 feet (299 meters) to 1624 feet (495 meters).
Average annual precipitation is 29.53 inches (750 mm) and the average daily temperature ranges from 42.8 degrees Fahrenheit (6 degrees Celsius) in winter to 82.4 degrees Fahrenheit (28 degrees Celsius) in summer (McFarland, 1999). Continental polar fronts produce low-intensity, long-duration storms in winter and fall and high intensity, short-duration squall-line thunderstorms occur in spring and summer (Saleh, 2004).
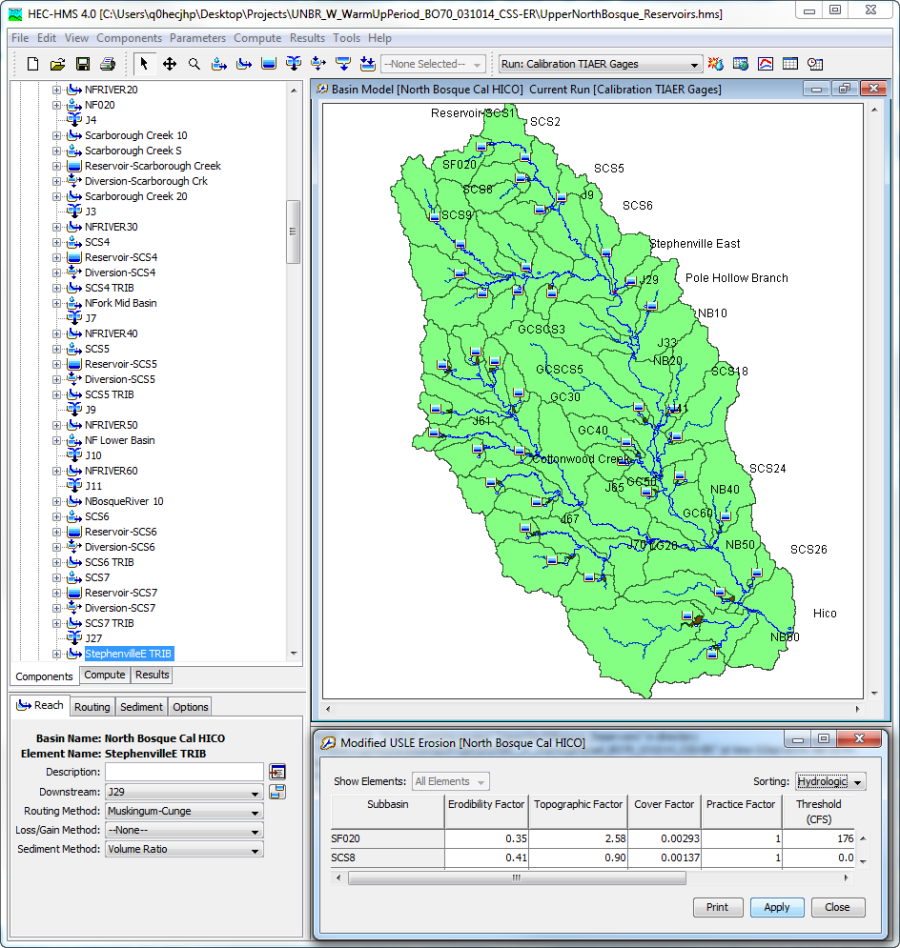
For this study, the watershed model was divided into 68 sub-watersheds upstream of Hico as shown below. There are fourteen precipitation and five stream gage locations within the watershed which were used for model calibration and validation. 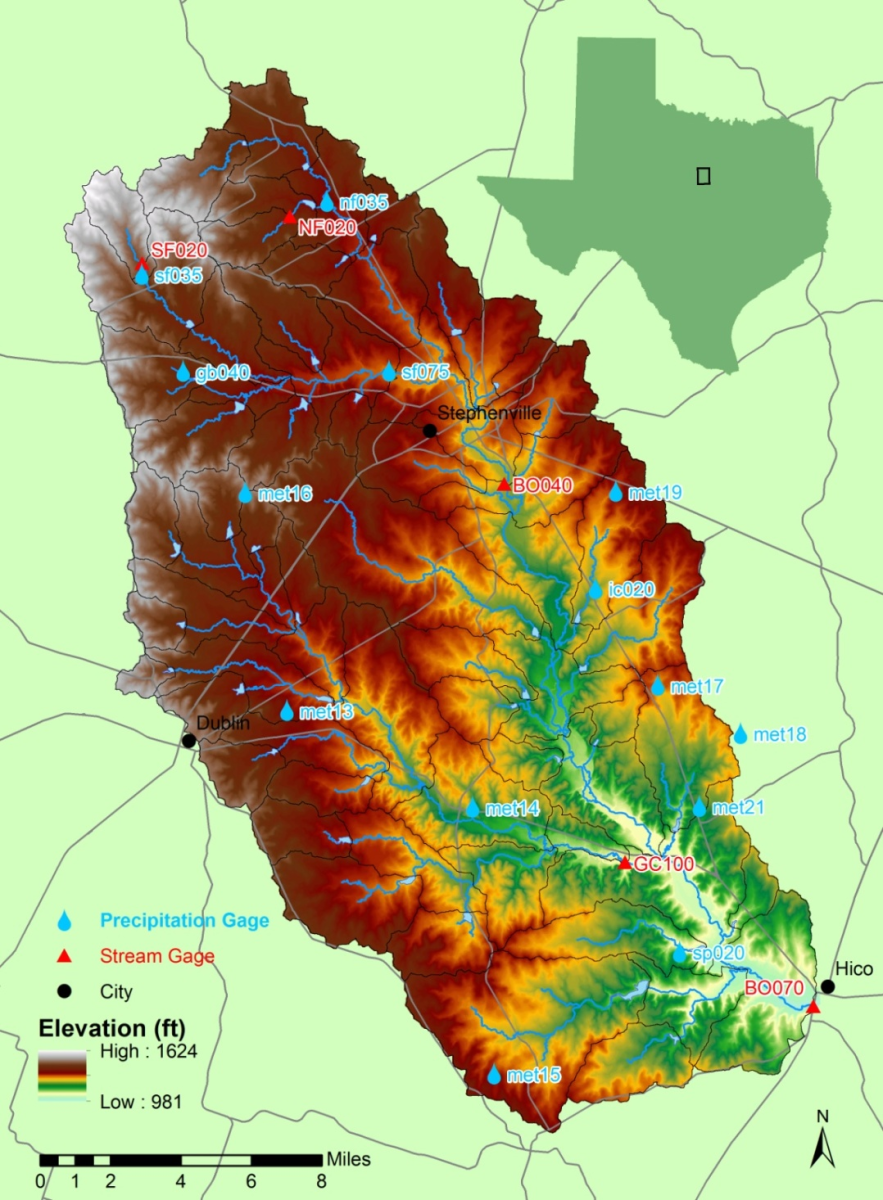
Decisions Required
In an effort "to restore and maintain the chemical, physical, and biological integrity of the Nation's waters", the Clean Water Act establishes a process to identify impaired waters and set TMDL's to achieve pollution reduction goals (33 U.S.C §1251(a)). The EPA defines TMDL as "a calculation of the maximum amount of a pollutant that a waterbody can receive and still meet water quality standards". TMDLs are used to identify how a waterbody is impaired, what caused the degradation, and pollutant load reduction necessary to meet water quality standards (EPA, 2003).
Because of intensive agricultural production in the UNBRW, primarily from the dairy industry, state government officials have expressed concerns with the degradation of local water quality (McFarland, 1998). In this case study, suspended sediment load was the target pollutant investigated to inform TMDL decisions in the UNBRW. To establish a TMDL the following decisions must be addressed as they relate to water quality objectives:
- What are the major nonpoint source contributors in the watershed?
- What is the total suspended solids (TSS) load within the watershed over a given analysis period?
- What are the expected siltation rates for reservoirs in the watershed?
Information Required
To address questions listed above, the following information is required:
- The average annual sediment load.
- The average annual siltation amount for each reservoir in the watershed.
- Sediment time series (sedigraph) for each grain class at each analysis point over a given analysis period.
To provide this information, a watershed hydrology and sediment model will be used to compute the average annual sediment yield for a sediment budget analysis. HEC-HMS will be used to model surface erosion and sediment transport. To develop the HEC-HMS sediment model, the following data will be used:
- A calibrated precipitation-runoff model including observed stream flow data.
- Observed TSS data.
- Average monthly evapotranspiration values from Appendix H in EM 1110-2-5027 (USACE, 1987).
- Precipitation gage data from the Texas Institute for Applied Environmental Research (TIAER) and the NWS.
- Stream cross section data from field surveys.
- Stream bed sediment data from field surveys.
- DEM terrain data (illustrated in the previous figure).
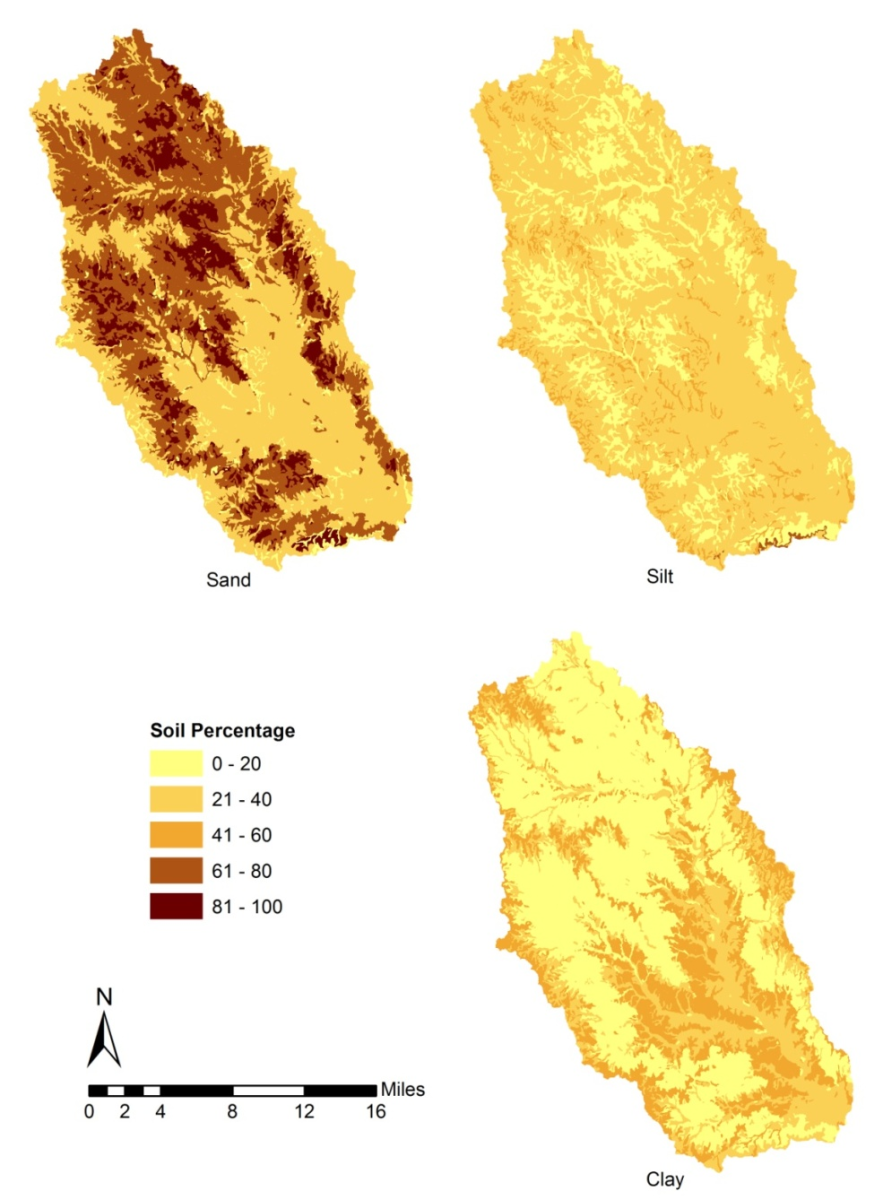
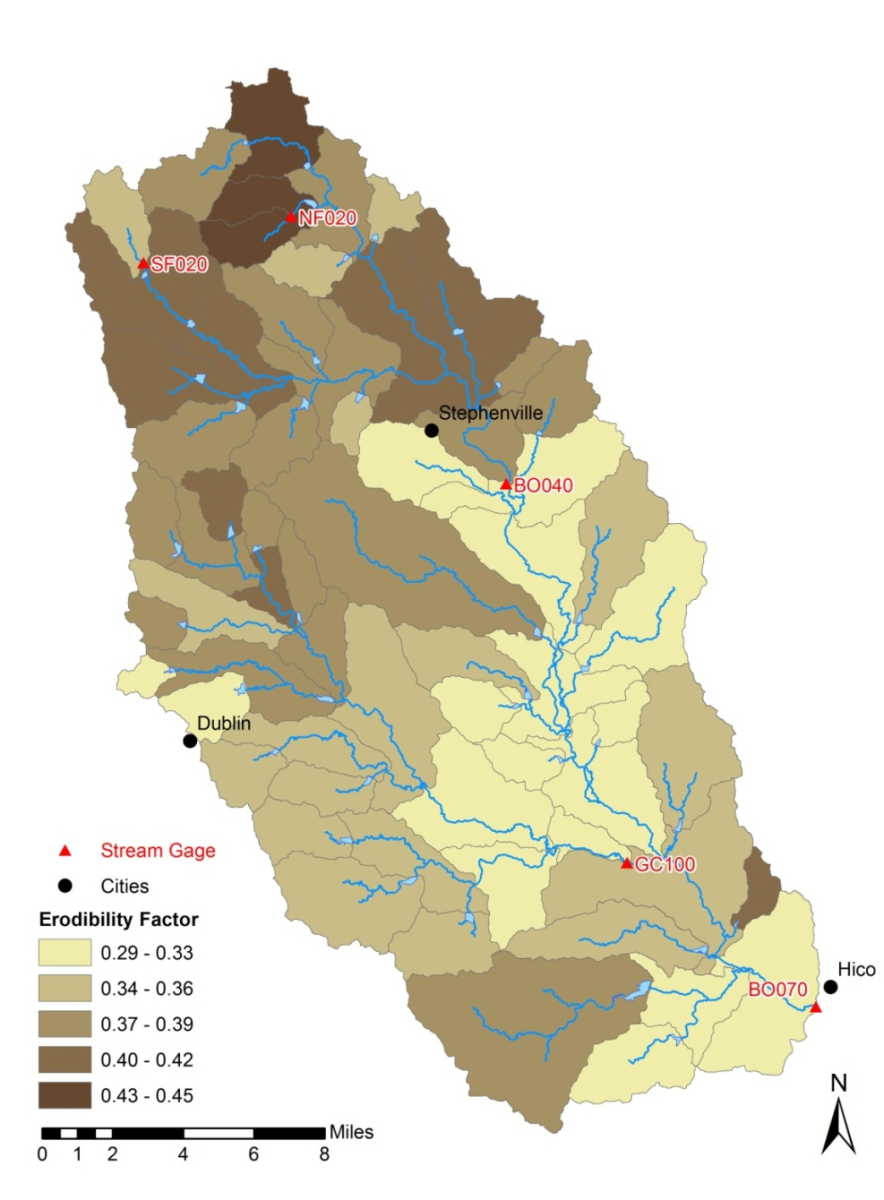
- SSURGO data from the Natural Resources Conservation Service (NRCS) website: http://www.soils.usda.gov/survey/geography/ssurgo/ (The SSURGO database is used to estimate the soil gradation and erodibility factor in each subbasin using GIS. The following figures show the percentage of surface soil components and the basin average erodibility factors in UNBRW, respectively.).
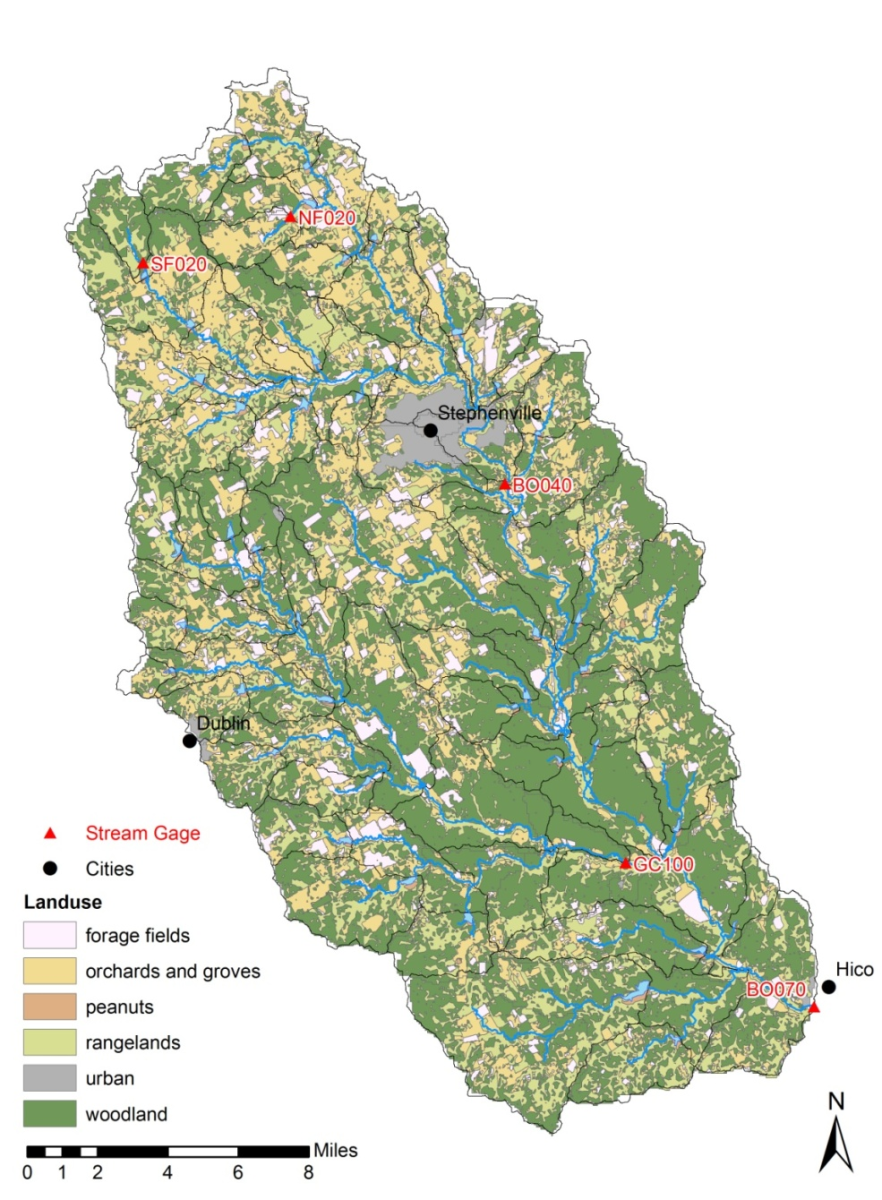
- Land use spatial data for the watershed, as shown below (Land use data are used to estimate percent impervious area and cover and management factors for use in the Modified Universal Soil Loss Equation (MUSLE) equation).
Data is collected, then analyzed and prepared for implementation in HEC-HMS using HEC-DSSVue, HEC-GeoHMS, GIS, and spreadsheet applications.
Model Selection and Fitting
For this analysis HEC-HMS was used to perform surface soil erosion and sediment routing computations through the subbasins, reservoirs, and stream network of the UNBRW. The following figure illustrates the completed basin model schematic of the UNBRW. Watershed data collected were used to develop subbasin, reach, and reservoir elements of the watershed sediment model. The following discussion describes detailed surface erosion and sediment routing processes for the three main elements, subbasin, reach, and reservoir, used in the development of the UNBRW sediment model (Pak, 2008: Pak, 2010). Note: the HEC-HMS User's manual lists all methods available to perform surface soil erosion and sediment routing for subbasin, reach, and reservoir elements.
1. Subbasin Element: The subbasin element represents drainage basins, simulating precipitation, infiltration, surface runoff and erosion processes. HEC-GeoHMS delineated the stream and subbasin boundary network based on USGS DEM data, but also forced sub-basins at reservoir and stream gage locations as calibration points. The MUSLE surface erosion method was chosen to simulate sediment yield processes from a pervious land segment. This method was selected because it was developed for agricultural applications corresponding to the rural/agricultural nature of the UNBRW. Sediment yield from a pervious land segment using the MUSLE Equation is calculated as shown in Equation 11 (Williams, 1975).
\big(11\big) \hspace{5cm} Sed=95 \cdot \big(Q_{surf} \times q_{peak}\big)^{0.56}\times K \times LS \times C \times P
where:
Sed is the sediment yield for a given event (tons)
Qsurf is the surface runoff volume (acre feet)
Qpeak is the peak runoff rate (cubic feet per second)
Kis the soil erodibility factor
LSis the topographic factor
C is the cover and management factor, and
P is the support practice factor
A detailed description of each of the MUSLE parameters is included in the following table.
Parameter or Method | Description | Source | Initial Range or Method |
| Subbasin | |||
Erosion Method | The erosion method computes the total sediment load transported out of the subbasin. This calculation process is repeated for each event during the simulation time window. | n/a | Modified USLE |
Erodibility Factor (K) | The erodibility factor describes the difficulty of eroding the soil. The factor is a function of the soil texture, structure, organic matter content, and permeability. Typical values range from 0.05 for unconsolidated loamy sand to 0.75 for silty and clayey loam soils. | SSURGO data | .29 - .45 |
Topographic Factor (LS) | The topographic factor describes the surface's susceptibility to erosion due to length and slope. It is based on the observation that long and steep slopes have more erosion than short and flat slopes. Typical values range from 0.1 for short and flat slopes to 10 for long or steep slopes. | DEM data | .78 - 5.61 |
Practice Factor (P) | The practice factor describes the effect of specific soil conservation practices, sometimes called best management practices. Agricultural practices could include strip cropping, terracing, or contouring. Construction and urban practices could include silt fences, hydro seeding, and settling basins. It is difficult to establish general ranges for these practices as they are usually highly specific. | n/a | 1 |
Cover & Management Factor (C) | The cover factor describes the influence of plant cover on surface erosion. Bare ground is the most susceptible to erosion while a thick vegetation cover significantly reduces erosion. Typical values range from 1.0 for bare ground, to 0.1 for fully mulched or covered soils, to as small as 0.0001 for forest soils with a well developed soil O horizon (surface organic layer) under a dense tree canopy. | Land use data | 0.00291 - 0.02796 |
Threshold (CFS) | Only some precipitation events will cause surface erosion. The threshold can be used to set the lower limit for runoff events that cause erosion. Events with a peak flow less than the threshold will have no erosion or sediment yield. | n/a | 0 |
Exponent | The exponent is used to distribute the sediment load into a time-series sedigraph. A small value flattens the sedigraph compared to the hydrograph. A large value heightens the sedigraph compared to the hydrograph. | n/a | 0.75 |
Gradation Curve | The gradation curve defines the distribution of the total sediment load into grain size classes and subclasses at each subbasin outlet. The gradation curve is defined as a diameter-percentage function in the HEC-HMS Paired Data Manager. | Soil sample, SSURGO | n/a |
Reach | |||
Transport Potential Method | Sediment processes within a reach are directly linked to the capacity of the stream flow to carry eroded soil. The transport capacity of the flow can be calculated from the flow parameters and sediment properties. If the stream can transport more sediment than is contained in the inflow, additional sediment will be eroded from the stream bed and entrained in the flow. However, if the flow in the reach cannot transport the sediment of the inflow, sediment will settle and be deposited to the reach bed. The sediment transport capacity is calculated using the transport potential method. | n/a | Laursen-Copeland |
Sediment Routing Method | The volume ratio method links the transport of sediment to the transport of flow in the reach using a conceptual approach. For each time interval, sediment from upstream elements is added to the sediment already in the reach. The deposition or erosion of sediment is calculated for each grain size to determine the available sediment for routing. The proportion of available sediment that leaves the reach in each time interval is assumed equal to the proportion of stream flow that leaves the reach during that same interval. This means that the all grain sizes are transported through the reach at the same rate, even though erosion and deposition are determined separately for each grain size. | n/a | Volume Ratio |
Initial Bed Curve | The initial bed curve defines the distribution of the bed sediment by grain size at the beginning of the simulation. | Soil sample | n/a |
Bed Width (ft) | The width of the sediment bed must be specified. The width should be typical of the reach and is used in computing the volume of the upper and lower layers of the bed model. | Field survey | 5 - 70 |
Bed Depth (ft) | The depth of the bed must be specified. The depth should be typical of the total depth of the upper and lower layers of the bed, representing the maximum depth of mixing over very long time periods. | Field survey | 10 |
Active Bed Factor | The active bed factor is used to calculate the depth of the upper layer of the bed model. At each time interval, the upper layer depth is computed as the d90 of the sediment in the upper layer, multiplied by the active bed factor. | n/a | 2 |
Reservoir | |||
Trap Efficiency Method | The trap efficiency of a reservoir is the sediment load retained in the reservoir divided by the total sediment load entering the reservoir. The trap efficiency can be estimated by comparing the settling velocity of the sediment to a critical settling velocity (Chen, 1975). | n/a | Chen Sediment Trap |
Fall Velocity Method | The deposition of sediment from the water column to the stream bed requires time. The fall velocity of the grain size class provides a physical basis for determining how much time is required for sediment in excess of the transport capacity to settle from the water column. The settling velocity is calculated and multiplied by the time interval to determine the settling distance in one time interval. This settling distance is then compared to the water column depth calculated during reservoir routing in order to determine the fraction of calculated deposition which is actually permitted during a time interval. | n/a | Van Rijn |
Source: HEC-HMS User's Manual
HEC-HMS uses the MUSLE method to determine sediment yield over a multiyear simulation. To utilize the MUSLE method for event analyses, HEC-HMS also requires a "Threshold" parameter which defines the flow rate below which no erosion occurs.
The particle size distribution of source material in the subbasin (on the land surface) will vary from the particle size distribution within the stream channel at the basin outlet due to changing hydrodynamic forces as water flows over the land surface and concentrates within streams and channels. The degree of clay and silt enrichment in the suspended sediment is largely the result of preferential deposition of the courser fraction during the transport and delivery of sediment from its source to basin outlet. A quantity known as the enrichment ratio is used to convert the watershed particle-size distribution to an outlet particle-size distribution (Slattery, 1996). The enrichment ratio is calculated as shown in the following equation.
\big(12\big) \hspace{5cm} ER = \frac{percent \ sediment \ in \ a \ given \ size \ class \ in \ outlet}{percent \ sediment \ in \ a \ given \ size \ class \ in \ watershed}
where ER is the enrichment ratio. The numerator, percent sediment in a given size class in outlet, can be determined from a suspended sediment sample near the subbasin outlet. The denominator, percent sediment in a given size class in watershed, comes from the SSURGO soil data. Suspended sediment samples near the subbasin outlet are rare for all subbasins in a given study watershed. For the UNBRW, the enrichment ratio was generated for select subbasins with suspended sediment samples near the basin outlet. These enrichment ratios were used to estimate the enrichment ratio of neighboring subbasins without suspended sediment samples near the basin outlet. For the UNBRW, enrichment ratios were calculated in a spreadsheet and final subbasin outlet grain size distributions were input into HEC-HMS as the gradation curve parameter.
2. Reach Element: The reach element connects other reach and subbasin elements, routing flow and sediment downstream. The reach element includes multiple methods for modeling sediment transport and erosion/deposition within a channel. Several sediment transport potential equations and sediment routing methods are available to route sediment through the stream network. For the UNBRW model, Laursen-Copeland (Copeland, 1989) was selected as the transport potential method during the calibration process for its applicability over the range of grain sizes present in the UNBRW and its ability to reproduce measured data well. The volume ratio method was chosen as the sediment routing method because it models relatively large distances between calculation points well. In addition to the transport potential method and sediment routing method, several additional parameters are required in the reach element. These parameters include the initial bed material gradation curve, bed width, bed depth, and active bed factor. For detailed explanation of these parameters see the Initial Parameters and Methods for Sediment Model table.
3. Reservoir Element: The HEC-HMS reservoir element contains four methods to determine the sediment trap efficiency and compute sediment deposition in the reservoir. Trap efficiency represents the percentage of incoming sediment retained by the reservoir (e.g., (sediment inflow - sediment outflow)/sediment inflow). To model reservoir sedimentation in HEC-HMS, a trap efficiency method and fall velocity method must be selected. The Initial Parameters and Methods for Sediment Model table includes detail on these methods. For UNBRW model, the Chen trap efficiency method with the Van Rijn fall velocity method was selected. Chen's (1975) trap efficiency method was selected because the critical settling velocity, defined based on an ideal rectangular pond, is theoretically appropriate for the HEC-HMS conceptual reservoir system. The Van Rijn (1993) fall velocity method was selected for its theoretical robustness in using Reynolds number and wide use in practice. Chen's (1975) trap efficiency only works with a user-defined elevation-area relationship. HEC-HMS routes water through a reservoir with a storage-discharge curve, computing storage from the elevation-area curve using a conic shape simplification. After routing, HEC-HMS computes the elevation and surface area for each time step. Based on the calculated discharge, surface area, and settling velocity, the trap efficiency is then calculated. After calculating sediment deposition based on the trap efficiency, the remaining suspended reservoir sediment is discharged through the reservoir based on a volume ratio of the flow discharge.
Boundary Conditions and Initial Conditions
The boundary conditions required by HEC-HMS for this study were generated based on the precipitation data provided by the TIAER. Model initial parameters and initial conditions were adjusted through the calibration process with the warm-up period.
Surface Runoff Model Calibration and Verification
The primary modeling component of HEC-HMS is the hydrology module. The hydrology model simulates precipitation-runoff processes for dendritic watershed systems. Before preparing the surface erosion and sediment transport model, the surface runoff model must be calibrated to available data. The quality of a sediment simulations are contingent on the quality of the hydrology model, so a carefully calibrated flow model is a necessary pre-requisite for an HEC-HMS sediment model. The UNBRW HEC-HMS hydrology model was calibrated using measured five-minute flow data, fifteen-minute rainfall data, and monthly pan evaporation data during the period 1 January 1995 through 31 December 1996. Hydrology model calibration parameters are contained in the following table. The range of values indicated in the "Range or Method" column is the calibrated range of values specified for all elements in the UNBRW model. The reasonable ranges of calibrated values vary depending on the application. After calibration, the HEC-HMS model was then independently validated with a separate two-year dataset for the period 1 January 1997 through 31 December 1998. Statistics (mean, standard deviation (SD), and mean error (ME)) of daily flow at five sample sites within UNBRW during calibration and validation periods are shown in the Statistics (Mean, SD, and ME) of Daily Flows at Five Sampling Sites during Calibration and Validation Periods table. As evident in the results, the standard deviation is much larger than the average flow. This is attributed to flows at the observation points having a few relatively large peak flow values within a record of significantly smaller peak flow values. The relationship between mean and standard deviation can be a function of watershed size, watershed regulation, and the precipitation pattern. This chapter assumes that a calibrated hydrology model for the watershed has been established. Further information on the calibration of a hydrology model can be found in Chapter 6 of the HEC-HMS User's Manual.
Parameter or Method | Description | Range or Method | Notes |
Subbasin | |||
Canopy Method | Simple Canopy | ||
Canopy Storage | canopy interception storage (inches) | 0.1 | |
Surface Method | Simple Surface | ||
Surface Storage | surface depression storage (inches) | 0.5 - 0.6 | This value was adjusted during calibration. |
Loss Method | Soil Moisture Accounting | ||
Soil Storage | total water storage in rooting zone (inches) | 6 | |
Tension Storage | water held in tension storage in rooting zone (inches) | 4 | |
Maximum Infiltration Rate | maximum infiltration rate from surface into the soil (inches/hour) | 0.4 - 1.2 | This value was adjusted during calibration. |
Soil Percolation | percolation rate from soil layer into Groundwater 1 Layer (inches/hour) | 0.3 - 0.5 | This value was adjusted during calibration. |
Groundwater 1 Storage | water storage in Groundwater 1 Layer (inches) | 3 | |
Groundwater 1 Percolation | percolation rate from Groundwater 1 Layer into Groundwater 2 Layer (inches/hour) | 0.3 - 0.5 | |
Groundwater 1 Coefficient | Groundwater 1 linear reservoir coefficient (hour) | 3.7 - 32.4 | This value was adjusted during calibration. |
Groundwater 2 Storage | water storage in Groundwater 2 Layer (inches) | 10 | |
Groundwater 2 Percolation | percolation rate from Groundwater 2 Layer into deep aquifer (inches/hour) | 0.06 - 0.1 | This value was adjusted during calibration. |
Impervious Area % | percentage of subbasin directly connected to the stream network | 0 - 5 | |
Groundwater 2 Coefficient | Groundwater 2 linear reservoir coefficient (hour) | 200 - 400 | This value was adjusted during calibration. |
Transform Method | Clark Unit Hydrograph | ||
Time of Concentration | travel time along the longest flow path (hour) | 0.9 - 8.1 | Values were determined from TR-55 method and adjusted during calibration. |
Storage Coefficient | linear reservoir coefficient (hour) | 0.9 - 8.1 | This value was adjusted during calibration. |
Baseflow Method | Linear Reservoir Baseflow | ||
Groundwater 1 Coefficient | groundwater 1 linear reservoir coefficient (hour) | 2 | This value was adjusted during calibration. |
Groundwater 1 # of linear reservoirs | number of linear reservoirs | 1 | |
Groundwater 2 Coefficient | Groundwater 2 linear reservoir coefficient (hour) | 500 - 1,000 | This value was adjusted during calibration. |
Groundwater 2 number of linear reservoirs | number of linear reservoirs | 1 | |
Reach | |||
Routing Method | Muskingum-Cunge | ||
Reach Length | channel reach length (feet) | 1,200 - 33,000 | |
Reach Slope | channel energy slope (feet/feet) | 0.0009 - 0.0215 | |
Channel n | channel Manning's n value | 0.035 | |
Overbank n | left and right Manning's n value | 0.05 | |
Channel Shape (cross section) | eight-point cross section of channel | Field Measurements | |
Reservoir | |||
Storage Method: | Elevation-Area-Discharge | ||
Elevation-Area curves | elevation versus area curve for reservoir pool | ||
Elevation-Discharge curves | elevation versus. discharge relationship including low level outlets and spillway | ||
Gage Name | Hydrology Analysis: Flow (ft3/s) | ||||||
Calibration (01Jan1995 to 31Dec1996) | Validation (01Jan1997 to 31Dec1998) | ||||||
Mean | SD | ME | Mean | SD | ME | ||
NF020 | Measured | 0.94 | 5.00 | - | 1.78 | 11.14 | |
HMS | 1.29 | 6.23 | 0.35 | 2.00 | 8.79 | 0.22 | |
SF020 | Measured | 1.35 | 7.69 | - | 1.23 | 7.63 | |
HMS | 1.66 | 9.78 | 0.31 | 1.76 | 10.76 | 0.53 | |
BO40 | Measured | 33.79 | 99.11 | - | 34.65 | 131.43 | |
HMS | 32.56 | 123.94 | -1.23 | 42.50 | 128.91 | 7.85 | |
GC100 | Measured | 30.83 | 92.80 | - | 57.21 | 183.11 | |
HMS | 31.61 | 127.48 | 0.78 | 40.42 | 162.30 | -16.79 | |
BO070 | Measured | 102.02 | 303.04 | - | 149.96 | 479.31 | |
HMS | 107.97 | 432.24 | 5.94 | 142.08 | 453.57 | -7.88 | |
HEC-HMS includes a collection of modeling components to simulate land surface erosion, simplified channel transport, and reservoir routing. After the HEC-HMS model was calibrated to the observed stream flow data, sediment model was initialized in HEC-HMS by activating the sediment feature on the component editor for the basin model. Detailed instruction for sediment model initialization is contained in the HEC-HMS User's Manual. An overview of sediment model initialization steps includes the following:
- Select sediment methods (transport potential, fall velocity, and grade scale) and enter parameter data (specific gravity and density) that will be applied to all elements within the basin model.
- Select a surface erosion method for each subbasin element.
- Select a channel sediment routing method for each reach element.
- Select a sediment trap efficiency method for each reservoir element.
Surface Erosion and Sediment Routing Model Calibration and Verification
The subbasin, reach, and reservoir elements were parameterized using available data from the SSURGO soil database, field sediment sample data, and reservoir rating curves. The model was calibrated using measured TSS data. Specific surface erosion, transport potential, sediment routing, trap efficiency, and fall velocity methods were selected among the available options during the calibration process as described in the "Model Selection and Fitting" section above. The UNBRW calibration assumed that TSS included all clay, silt, and sand and excluded gravel. Therefore, TSS data were compared to the sum of the clay, slit, and sand sediment load outputs from HEC-HMS. A summary of calibrated sediment model parameters and methods is included in the following table. Parameters were adjusted within the applicable range during the sediment model calibration process. The "Calibrated Range or Method" column displays the calibrated range of values used in the UNBRW model. The reasonable range of values will vary depending on the particular application. The model parameters used during the validation simulation were identical to the parameters determined during model calibration.
Parameter or Method | Calibrated Range or Method | Calibration Notes |
Subbasin | ||
MUSLE Method: Cover & Management Factor (C) | 0.00137 - 0.03492 | The Cover & Management factor was the only MUSLE factor selected for calibration. The Cover & Management factor is the least physically based MUSLE factor. Cover & Management values were adjusted to 47-179% of initial values during calibration. |
Threshold (cfs) | 0 - 176 | Threshold values were calibrated to measured data. A threshold value of 0 was used for all basins with the exception of SF020 for which a value of 176 cfs was used. |
Reach | ||
Transport Potential Method | Laursen-Copeland | The Laursen-Copeland (Copeland, 1989) method was selected for its broad spectrum of gradation applicability (developed for use inclusive of the silt range) and physical basis. |
Sediment Routing Method | Volume Ratio | |
Bed Gradation Curve | 75% - 86% | The percentage of gravel was adjusted during calibration. |
Reservoir | ||
Trap Efficiency Method | Chen Sediment Trap | The Chen (1975) Sediment Trap method was selected for its physical basis. |
Fall Velocity Method | Van Rijn | The Van Rijn (1993) method selected for its theoretically robustness and wide use in practice. |
The model calibration progressed from small, single sub-basin elements upstream, to larger, more complex, watershed components downstream, with the former informing the later. Single subbasin elements were calibrated to measured TSS data, at stations NF020 and SF020 by adjusting the MUSLE cover & management factor (C) for the two subbasins within 70 to 90 percent of initial values. In addition, the model at SF020 was calibrated by adjusting the threshold flow to 176 cfs. The model at stations BO040, GC100, and BO070 were then calibrated based on adjusted parameters from upstream stations (NF020 and SF020) and measured TSS data. The MUSLE cover and management factors were adjusted to 47 to 179 percent of initial values. The bed gradation curves were adjusted to 75 to 86 percent of initial percentage of gravel.
Results and Discussion
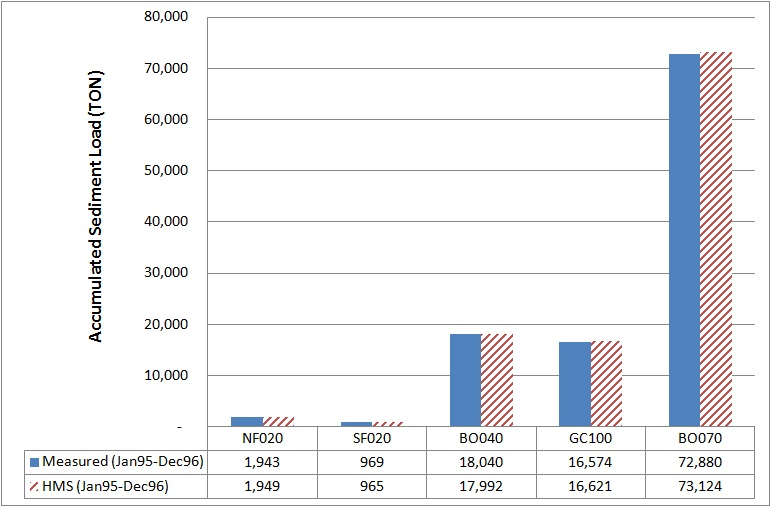
A comparison of accumulated sediment load at each stream gage location over the duration of the calibration period is included in the figure below. HEC-HMS approximated measured TSS data for the calibration period well.
Accumulated computed sediment load at each stream gage location is compared to the cumulative TSS over the duration of the validation period in the following figure. While the validation results diverge from measured TSS data more than the calibration results, the model still provides a reasonable approximation (-30% ~ 12%) of measured TSS data for the validation period.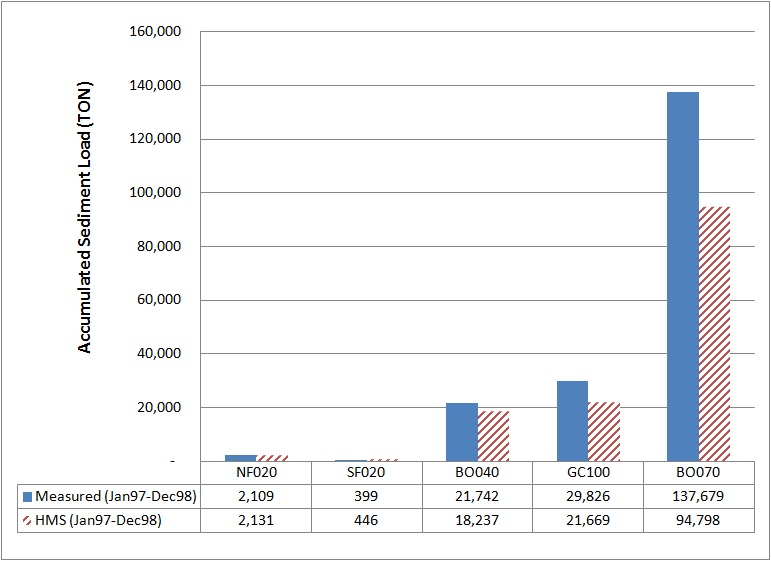
Reservoir trap efficiency rates were also computed and compared to measured values for both North Fork Reservoir (Scarborough) and South Fork Reservoir (SCS8) in the following figure, the only reservoir locations with measured data in the UNBRW. An HEC-HMS computed average reservoir trap efficiency of 88 percent for the two reservoirs was very close to the observed value of 85 percent. These results are consistent with a Schreiber and Rausch study (1979) which concluded that the average trap efficiency was also 88 percent for a flood detention reservoir located in an agricultural area near Columbia, Missouri (4,167 feet long by 230 feet wide with a mean depth of seven feet and a maximum depth of sixteen feet).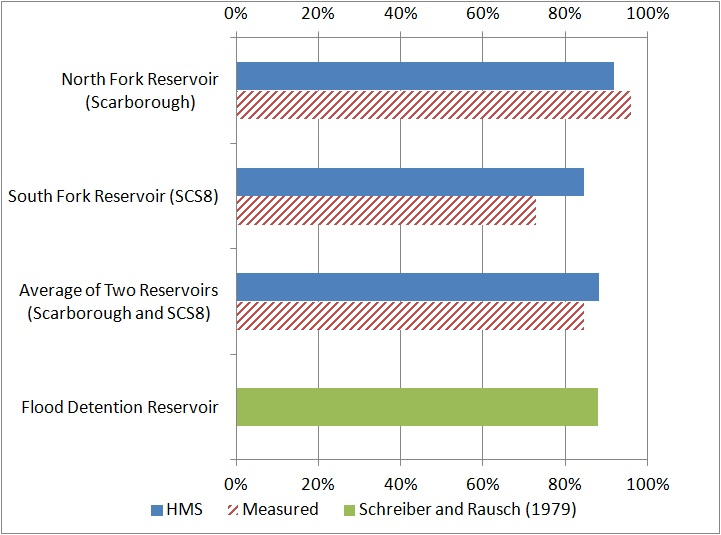
GIS was utilized to visualize sediment results of the UNBRW modeling as shown below, displaying HEC-HMS sediment results for each subbasin, reservoir, and reach element. The 68 subbasin elements are displayed with three categories for the estimated unit sediment yield rate (ton/mi2/yr). The 84 reach elements are displayed with two categories to indicate predictions of aggradation and degradation in channels. The forty reservoir elements are displayed with four categories of reservoir trap efficiency rates. The five stream gage locations are displayed with a pie chart representing soil gradation of cumulated sediment loads for four grain classes (clay, silt, sand, and gravel) at each gage location. These data were generated from the HEC-HMS model and retrieved using HEC-DSSVue. Subbasin sediment yield rates provide an indication to watershed management officials of major non-point sediment source contributors in the watershed. 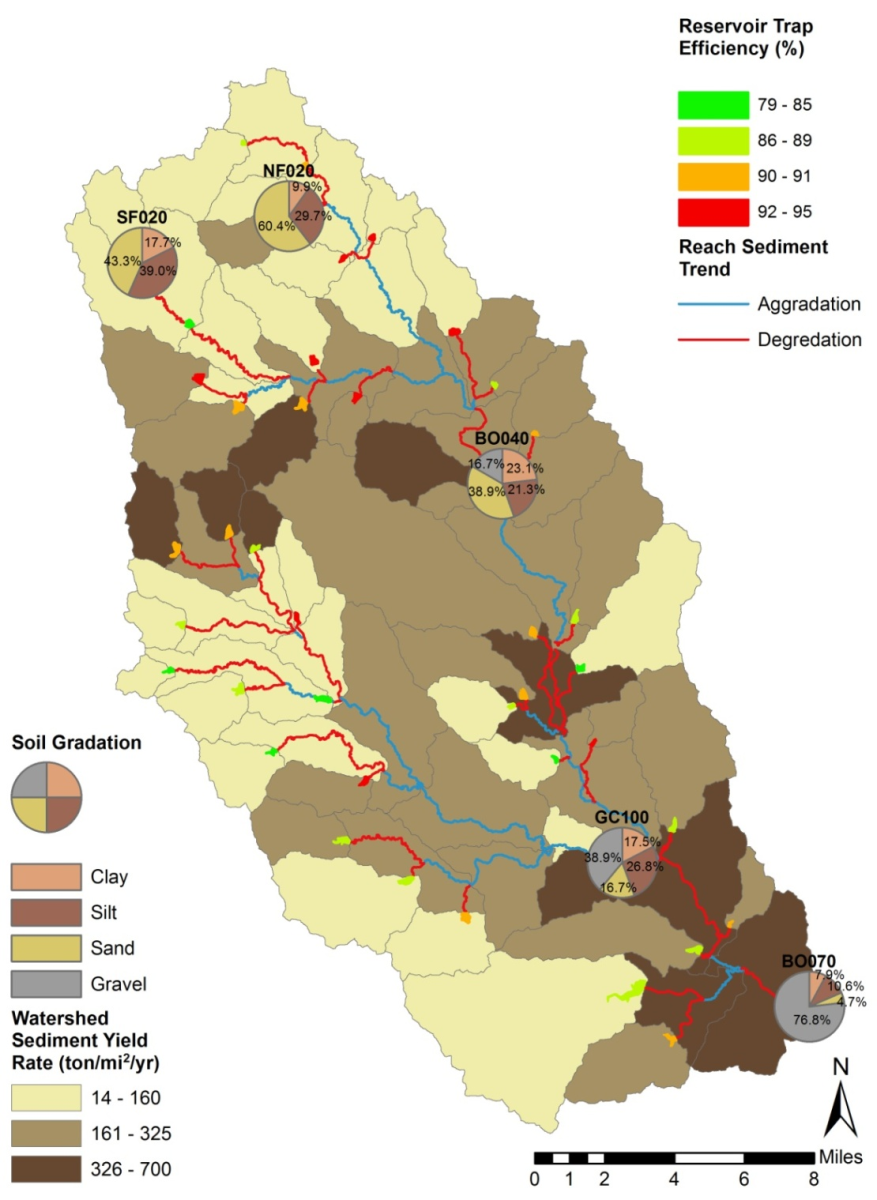
Reach sediment trends (aggradation/degradation) indicate that reach bed sediment is building up (aggradation) or eroded away (degradation). Reservoir trap efficiency rates help estimate reservoir life expectancy and plan reservoir maintenance.
These results indicate major non-point source contributors, long term TSS trends, and reservoir sedimentation rates that can inform watershed managers and local government decisions, basing TMDL and water quality standards on quantifiable data.
Additional analysis
In general, if sediment aggradation/degradation trends for a reach are desired, then HEC-HMS is a sufficient model. If quantity and location of sediment deposition within the reach is desired, then HEC-RAS is a more applicable model. If a more detailed channel sediment routing analysis is warranted HEC-HMS can be used to compute local sediment loads to the main channels, then using HEC-DSS, local sedigraphs for all grain classes (clay, silt, sand, and gravel) can be supplied as input boundary conditions to the HEC-RAS sediment model.