Download PDF
Download page Case Study: Estimating Impacts of Urbanization in the CRS SRS Watershed.
Case Study: Estimating Impacts of Urbanization in the CRS SRS Watershed
Watershed Description
The Chicken Ranch Slough and Strong Ranch Slough (CRS/SRS) watershed is an urban watershed of approximately 15 square miles within Sacramento County, in northern California. The watershed and surrounding area are shown in the following image. The SRS and Sierra Branch portion of the watershed is 7.1 square miles and the CRS portion is approximately 6.8 square miles. The watershed is developed primarily for residential, commercial, and public uses. The terrain in the watershed is relatively flat. The soil is primarily of sandy loam. It exhibits a high runoff potential. 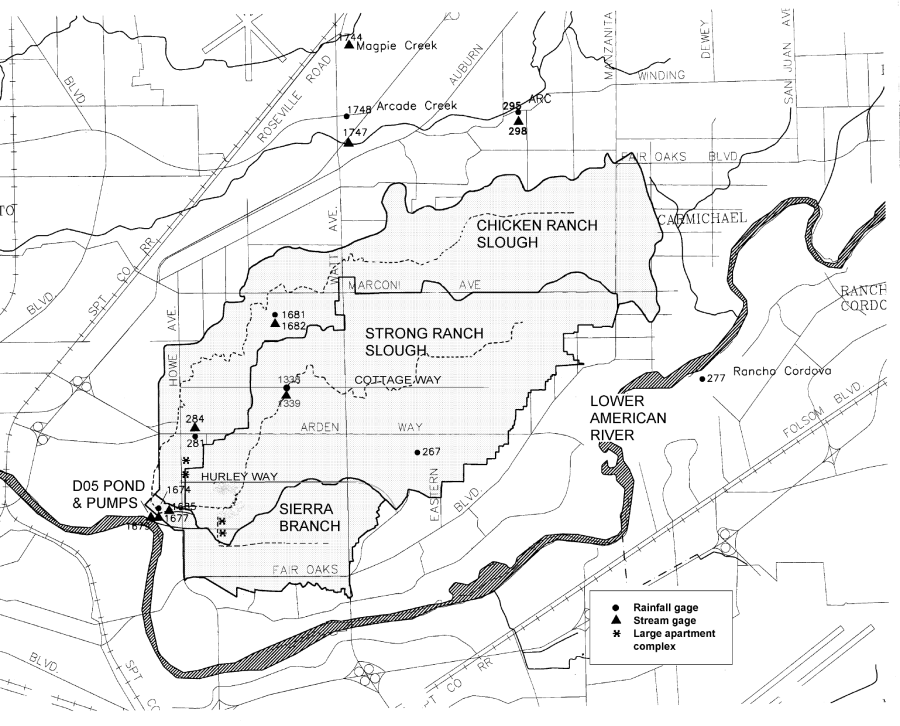
As shown in the image above, the watershed is near the Lower American River (LAR). Levees along the LAR protect the watershed from the adverse impacts of high river stages. However, this line of protection restricts the natural flow from CRS and SRS into the LAR. To prevent interior flooding due to this restriction, the D05 interior-drainage facility was constructed. This facility collects interior runoff from the sloughs in a 100 acre-feet pond. From there, the water discharges to the LAR through either gravity outlets or pumps.
The CRS/SRS watershed is a good example of the problem often encountered in an interior watershed. As the LAR rises, the gravity outlets are ineffective at removing water from the pond. Once the LAR rises to the same elevation as the top of the pond, pumping is the only means to remove water from the pond. The pumping station has a total capacity of 1,000 cfs. This is less than the inflow to the pond for even small events. As a consequence, small interior events are likely to cause flooding because water in the pond creates a backwater effect in the channels, thus reducing their flow capacity. Subsequently, flow spills over the channel banks and causes flood damage. For the same storm, if the LAR was low (not restricting the flow through the gravity outlets), the flow would not build up in the pond. The effective flow capacity of the channels would then be greater, thus reducing the likelihood that flood damage would occur.
There are fifteen precipitation and stream gages in and adjacent to the CRS/SRS watershed, their locations are shown in the previous figure. All gages are automatic-reporting ALERT (Automated Local Evaluation in Real Time) gages. The most recent flood events occurred 1995 and 1997. The data from these events will be useful for calibration of the watershed and channel model.
Decisions Required
Located in the headwaters of CRS is a 320-acre (0.5 square mile) undeveloped area. As a result of increasing land values, the owners of the land are petitioning to rezone their land and develop it for new homes and businesses. In order for development to be allowed, the owners must mitigate for any increased runoff caused by the development. In this case, that requirement is imposed by the local authorities. However, a similar requirement is commonly included as a component of the local cooperation agreement for Federally-funded flood-damage-reduction projects. This ensures that future development in a watershed be limited so the protection provided by the project is not compromised. This requirement is especially important in the CRS/SRS watershed because there is already a flood risk near the outlet of the watershed (near the D05 facility).
In the previous reconnaissance phase of this project, a Federal interest in the watershed was identified. Therefore, USACE has now moved on to the feasibility phase. In this phase, USACE has been tasked with answering the questions:
- Will the development of the open area increase the peak runoff in the CRS watershed for the 0.01 AEP event?
- If so, how significant is the increase in flow, volume, and peak stage?
Information Required
To answer the questions above, the following information is required:
- The without-development peak runoff for the selected event.
- The with-development peak runoff for the selected event.
To provide that information, USACE will use a watershed model to compute the peak flow for the different watershed conditions; HEC-HMS will be used. To develop the rainfall-runoff relationship, information on the watershed will need to be collected, such as:
- Soil types and infiltration rates.
- Land use characteristics and the percent of impervious area due to development.
- Physical characteristics of the watershed including lengths and slopes.
- Local precipitation patterns.
- Drainage patterns of the study area.
- Drainage channel geometry and conditions.
For this study, the information required was found using results of previous drainage studies in the area, USGS topographic and soils maps, and field investigations.
Spatial and Temporal Extent
The study team is interested in evaluating the increase in runoff from CRS only. So, the portion of the watershed that contributes flow to SRS will not be analyzed in this phase of the study. In the reconnaissance phase, the study team identified the portion of the CRS watershed downstream of Arden Way as being influenced by backwater from the D05 pond. The flow in this lower portion of the watershed is a function of both the channel flow and downstream channel stage. So, this lower portion will also not be included in this phase of the study. Therefore, the study area for this phase will be the portion of the watershed that contributes flow to CRS upstream of Arden Way.
Now that the study area has been defined, the next step is to use the information collected to divide the study area into subbasins. By doing so, the analyst will be able to compute the flow at critical locations along CRS. To delineate the subbasins and measure the physical parameters of the watershed, the USGS quadrangle map (1:24000 scale) of the watershed was used.
If a detailed digital elevation model (DEM) were available, the analyst could use the HEC-GeoHMS (Geospatial Hydrologic Modeling Extension) tools to delineate the subbasins, establish the flow paths, and calculate physical parameters of the watershed (such as length, centroid location, and average slope). However, the best DEM available for the watershed is a 30-meter DEM available from the USGS. (A DEM is a grid-cell representation of the topography. A 30-meter DEM is comprised of grid cells measuring 30-meters on each side. Each grid cell has a single associated elevation for its entire area). In this case, the topographic data source of the DEM is the same as the USGS quadrangle map. However, the quadrangle map provides contour lines that offer an additional degree of refinement that the DEM does not provide. This additional refinement is useful for flat terrain and for smaller watersheds. If the watersheds were larger and located in a hilly area where there was significant relief, the 30-meter DEM may be useful for a feasibility-level study.
Because gage data from historical events were available, the headwater subbasin was delineated such that the outlet point was at the Stream Gage 1682, located at Corabel Lane. These data will be useful in the calibration of the headwater subbasin in the watershed model. The study area was further delineated near points where flow-frequency data may be useful for future planning, at Fulton Avenue and at Arden Way. Once the subbasins were established, the analyst measured the areas (A), slopes (S), flow path length (L), and length to the centroid (Lc), from the topographic maps. These are watershed properties that are useful for estimation of the model parameters. The values are included in the following table.
Description | ID | A | S | L | Lc |
CRS upstream of Corabel gage | COR | 4.22 | 15.84 | 4.43 | 2.24 |
CRS downstream of Corabel gage, upstream of Fulton Avenue | FUL | 0.30 | 12.67 | 0.61 | 0.07 |
CRS downstream of Fulton Avenue, upstream of Arden Way | ARD | 1.00 | 11.62 | 1.9 | 0.67 |
Model Selection
Once the watershed data were collected and the spatial and temporal extents had been determined, the analyst began constructing the HEC-HMS model. As shown in the Summary of Simulation Methods Included in HEC-HMS table, several methods are available for runoff-volume, direct-runoff, and channel routing. In all cases, two or more of the methods would work for this analysis.
Infiltration. The analyst chose the initial and constant-rate runoff-volume method. It is widely used in the Sacramento area. Regional studies have been conducted for estimating the constant loss rate. The studies, based upon calibration of models of gaged watersheds, have related loss rates to soil type and land use. Surveys of development in the region provide estimates of percent of directly impervious area as functions of land use. The following table is an excerpt of the results of those studies. Other jurisdictions have similar results available.
Land Use | Percent Directly Impervious | Soil Group | ||
B | C | D | ||
Commercial, offices | 90 | 0.16 | 0.08 | 0.05 |
Residential: 4-6 du/acre | 40 | 0.18 | 0.10 | 0.07 |
Residential: 3-4 du/acre | 30 | 0.18 | 0.10 | 0.07 |
The following table lists the estimates of percent of directly connected impervious area for CRS watershed.
Description | Identifier | Estimated | Percent Directly Impervious |
CRS upstream of Corabel gage | COR | 1.78 | 50 |
CRS downstream of Corabel gage, upstream of Fulton Avenue | FUL | 0.22 | 60 |
CRS downstream of Fulton Avenue, upstream of Arden Way | ARD | 0.75 | 50 |
Other loss methods could have been selected, such as the SCS curve number method or Green and Ampt. Because this analysis considers only a single precipitation event, a soil moisture accounting model designed for continuous simulation would be less useful. Those models would require additional parameter estimates and would not help to answer the questions any better.
Direct-runoff transform. The analyst used Snyder's unit hydrograph direct-runoff transform method. This method is widely used in the Sacramento area. As with the loss method, regression studies have been conducted in Sacramento to estimate the lag of watersheds as a function of watershed properties. The regression equation is:
\big(1\big) \hspace{5cm} T_{lag}=1560n {\big( \frac{LL_{c}}{S^{0.5} }\big)}^{0.33}
where:
Tlag = Snyder's standard lag, in minutes
S = watershed slope, in feet/mile
L = length of longest watercourse, in miles
Lc = length along longest watercourse to centroid, in miles
N = basin n coefficient
The basin n coefficient is a function of the percent imperviousness and the land use of the watershed. The following table is an excerpt of study results that estimated basin n values in the Sacramento area. Similar tables and equations are available for other jurisdictions. The lag value from Equation 1 is virtually the same as the value for the U.S. Bureau of Reclamation's (USBR) dimensionless unit hydrograph for urban basins (Cudworth, 1989). Using Equation 1, the lag was estimated; values are shown in the previous table.
Basin Land Use | Channelization Description | |
Developed | Undeveloped | |
Commercial, offices | 0.031 | 0.070 |
Residential: 4-6 du/acre | 0.042 | 0.084 |
Residential: 3-4 du/acre | 0.046 | 0.088 |
Because the headwater basin is gaged, calibration can be used to estimate the Snyder peaking coefficient, Cp. During the calibration process, refinements to the lag estimate can be made as well.
Baseflow. Baseflow was not included in this analysis. It is not critical in most urban watersheds.
Routing. The analyst used the Muskingum-Cunge channel routing method because channel geometry and roughness values were available from previous studies. A primary advantage of the method is that it is physically based, which is useful because there are no downstream data available for calibration. If the study area was defined such that it extended to the D05 pond, the modified Puls method would have been used to model the portion of the CRS channel influenced by backwater from the pond.
Temporal Resolution
The analyst needed to decide upon a temporal resolution for the analysis. Decisions required include selection of the time step to use and the hypothetical precipitation event duration. In earlier watershed programs, the selection of the time step required was more critical due to array limitations and program computation time. These considerations are no longer needed when using HEC-HMS on a modern computer for a short duration storm. The analyst could use a one-minute time step; however this may provide unnecessary resolution. However, if the program were used for longer duration events or for continuous simulation, a larger time step would prevent excess data and would reduce computation time. To find the upper limit of an appropriate time step, the analyst must ensure that the peak of the hydrograph is captured. A time step that yields between five to ten points on the rising limb of the unit hydrograph for each subbasin is usually adequate. Using the approximate relationship that the lag time equals sixty percent of the time of concentration from EM 1110-2-1417 (USACE, 1994a), the analyst computed the time of concentration for each basin (based upon the lag time calculated with the regression equation) and divided the minimum of these values by ten points. This yielded a minimum approximate time step of two minutes, as follows:
\big(2\big) \hspace{5cm} \big(0.22\ hrs \times 60\ min/hr\big)\ /\ \big(0.6 \times 10\ points\ on\ rising\ limb\big)\ =\ 2\ min\ time\ step
The most common duration for hypothetical events in urban areas is 24 hours. The National Weather Service (NWS) found that most runoff-producing storms in the contiguous United States are greater than twelve hours (NWS, 1972). It is important that the storm duration is long enough that the entire watershed contributes to the runoff. This means it must be greater than the sum of the time is takes to satisfy the initial loss and the time of concentration. A general estimate for this time is four times the time of concentration of the watershed. Using this estimate yielded a twelve-hour event. However, the analyst decided that the time of concentration was likely underestimated because the headwater subbasin had a large drainage length in proportion to its area, so a larger 24-hour event was selected. If after calibration, the analyst's assumption proved incorrect and the lag was not underestimated, the analyst would change back to the 12-hour event. An alternative method to selecting the storm duration is to use a variety of storm durations with the completed model. Select the storm with the greatest peak flow.
Model Calibration and Verification
Based upon the methods selected, the following parameters are required:
- Initial and constant loss rates and percent directly connected impervious area for the runoff-volume method.
- Lag time and peaking coefficient for the runoff transform.
- Roughness values for the channel routing method.
In addition, channel properties such as reach length, energy slope, and channel geometry need to be measured for the channel routing method.
The lag time and percent impervious area were estimated as described above. The initial loss, constant loss rate, and peaking coefficient will be estimated using calibration. The initial estimate for the constant loss rate is based upon regional relationships. It is 0.07 inch/hour. Because the watershed is developed and has a high percent of impervious area, the runoff hydrograph is expected to rise and fall over a short period of time. As an initial estimate for the peaking coefficient, the upper limit suggested by the HMS Technical Reference Manual (HEC, 2000) of 0.8 was used.
The magnitude and AEP of historical events used for calibration should be consistent with the intended application of the model. Three significant events have occurred since the installation of the gages in the CRS/SRS watershed. The events are:
- January 10, 1995. This is about a 0.04 to 0.01 AEP event.
- January 22, 1997. This is about a 0.10 to 0.04 AEP event.
- January 26, 1997. This is about a 0.20 to 0.04 AEP event.
The first two of these events were used to refine the parameter values and the third was used to verify the final values. The analyst used the HEC-HMS Optimization Manager for the parameter estimation. To do so, the analyst:
- Created a new Basin Model with a single Subbasin for COR, the subbasin to be used for the calibration and verification process.
- Edited the subbasin to select the appropriate methods for Loss, Transform, and Baseflow, and entered the initial estimates for each method.
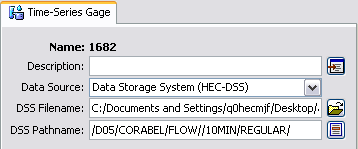
- Added the observed flow by selecting the Time Series Data Manager from the Components menu. Then the analyst selected the Discharge Gages data type and clicked New. In this case, the observed values were in DSS (HEC's Data Stroage System) format, so in the Component Editor the Data Storage System (HEC-DSS) was selected as the Data Source, as shown in the following image. Then the DSS filename and pathname were selected. Additional instructions on adding a gage are included in the HEC-HMS User's Manual.
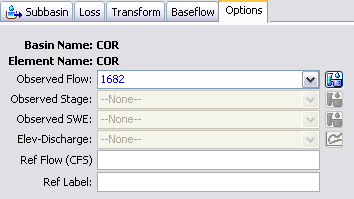
- Associated the observed flow gage with the subbasin element. First the analyst selected the subbasin in the basin model map.
- Then selected the Options tab in the Component Editor. The appropriate gage was selected, as shown below.
- Created a new Meteorologic Model for the historical event. To do so, gaged precipitation data were entered. The Meteorologic Model used the user-specified gage weighting option. Gage weights for the recording ALERT gages were determined with Thiessen polygons. Refer to the HEC-HMS User's Manual for instructions on creating a Meteorologic Model.
- Created new Control Specifications for the historical event. To do so, specify the Time Interval and the starting and ending dates and times. Refer to the HEC-HMS User's Manual for instructions on creating control specifications.
- Created a new Simulation Run by selecting the Create Simulation Run option from the Compute menu. The simulation run must be created before an optimization trial can be created. The analyst computed the simulation run to make sure all model parameters were entered.
- Created a new Optimization Run by selecting Create Optimization Trial option from the Compute menu.
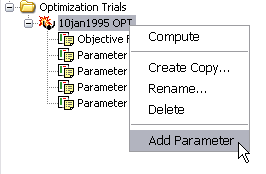
- Navigated to the Optimization Trial by selecting the Watershed Explorer, Compute Tab and expanding the Optimization Trials folder. Parameters to be included in the 10 January 10 1995 calibration event were the Snyder time to peak, Snyder peaking coefficient, initial loss, and constant loss rate. A parameter is added to the optimization trial by placing the mouse on top of the optimization trial name and clicking the right mouse button. Then select the Add Parameter option, as shown below. Additional instructions are included in the HEC-HMS User's Manual.
- In the Component Editor, the analyst set the optimization trail time window to correspond with the rising and falling limb of the primary runoff hydrograph. This allowed the program to calibrate to the flood hydrograph and focus the optimization function on matching the peak flow.
- Once the initial parameter values were specified, clicked Optimize to begin the computations.
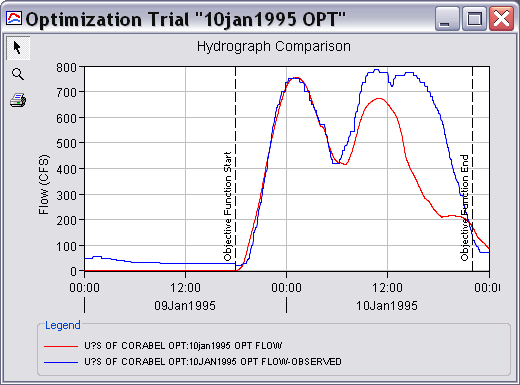
- Studied the plots of the results, revised initial estimates as needed and repeat Step 11. The results from several iterations of adjusting the time window and fixing different parameters are shown below. The computed hydrograph appears to track with the observed flows. However, the computed peak flow is approximately ten percent less than the observed peak flow.
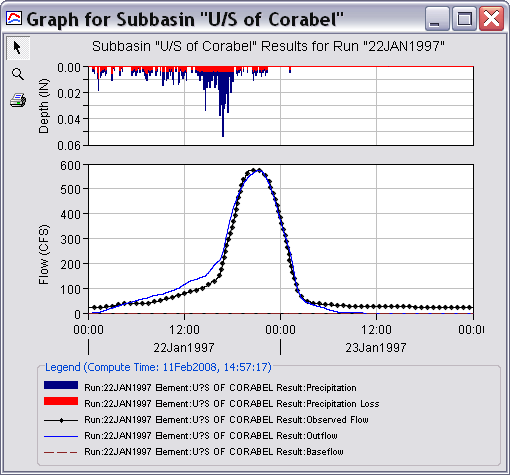
- This process was repeated for the 22 January 1997 event. The calibration results for the 22 January 1997 event are shown below. This plot shows that the computed hydrograph matches well with the observed flows for that event, especially the peak flows.
The parameter estimates resulting from the calibration to the January 10, 1995 event and the 22 January 1997 event are summarized in the following table. The values were averaged and verified using the observed precipitation and flow data for the 26 January 1997 event. To do so, the average lag and peaking value were input to the Basin Model and the Optimization Trial was computed again. This time, only the loss rate parameters were adjusted as specified in Step 9 above.
Calibration Event | Snyder Lag (hr) | Snyder Cp |
10 January 1995 | 5.42 | 0.68 |
22 January 1997 | 4.68 | 1.00 |
26 January 1997 | 4.55 | 1.00 |
Final average value | 4.88 | 0.89 |
The results from the verification process are shown in the following image. Because the rising limb of the observed data occurs earlier than the rising limb of the computed data, the analyst reasoned that the Snyder lag value may be too great. The lag value was added to the Parameter list in the Optimization Trial for the 26 January 1997 event, and the optimization process was repeated. HEC-HMS computed a value of 4.55 hours, which was similar to the parameter value computed for the 22 January 1997 event. 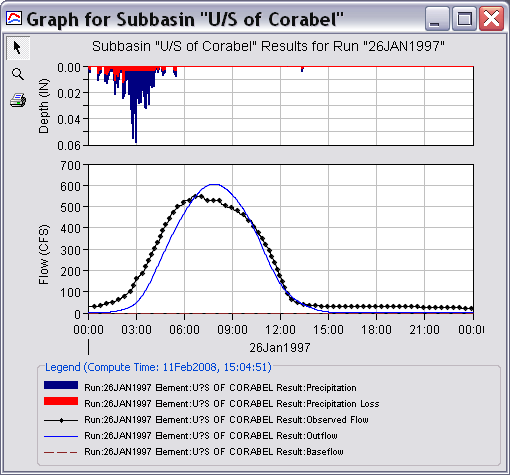
The average parameter estimates from the first two events did not compare well with the third event. Consequently, the analyst averaged the parameter values from all three events. By doing so, all three events are incorporated into the calibration of the model parameters. This provided the estimates shown in the previous table. The averages of the three values were used to represent the existing condition. However, the analyst may have chosen not to weight the parameter values evenly. Based on the quality of precipitation data, magnitude of the event, or other factors, more weight may be given to a particular historical event.
The Snyder lag values for subbasins FUL and ARD were adjusted from the values predicted with Equation 1 consistent with the calibration. The logic followed is that Equation 1, when compared to the calibration results, under predicts the lag for subbasins in the CRS watershed. By adjusting the parameters, the analyst fits the equation to basins found in this watershed. The resulting values are included in the following table. The Snyder peaking coefficient, Cp, is usually taken as a regional value. As the subbasins are similar in slope and land use, the calibrated value was used for the other two subbasins.
Identifier | Adjusted Snyder | Adjusted Snyder |
COR | 4.88 | 0.89 |
FUL | 0.60 | 0.89 |
ARD | 2.06 | 0.89 |
The channel properties and parameter values needed for the Muskingum-Cunge routing method must be defined also. The reach length, energy slope, and cross section geometry were estimated from available maps and survey data. The Manning's roughness parameter was estimated using published tables of values (Barnes, 1967). The Manning's roughness value could be refined through calibration if reliable gage data were available. There is a downstream gage at Arden Way. However, due to the backwater conditions from the D05 pond, the assumption of a single relationship between stage and flow is not appropriate. Further, the observed stages at the gage are influenced by a variety of other downstream factors such as pump operation and commingled water from SRS. The following image shows the values used for the routing reach that extends from Fulton Avenue to Arden Way.
Application
Once the without-development condition parameters were established, the analyst was ready to complete the HEC-HMS input and produce the information needed for decision making. For the comparison of land use conditions, the analyst used the 0.01 AEP storm event to estimate the 0.01 AEP flood. This is a standard procedure often used by the local authorities for evaluating land use changes. 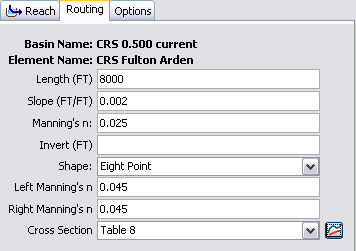
The initial loss values estimated during calibration were storm specific. The initial loss values used for hypothetical events are based upon studies in the Sacramento area. Values for a range of hypothetical events have been estimated and are shown in the following table. Other jurisdictions may have similar tables.
AEP | Initial Loss (in) |
0.500 | 0.40 |
0.200 | 0.25 |
0.100 | 0.20 |
0.040 | 0.15 |
0.020 | 0.12 |
0.010 | 0.10 |
0.004 | 0.08 |
0.002 | 0.06 |
Calibration showed that the constant loss rate, which is a function of the soil characteristics and land use, is under predicted by the regional studies for the CRS watershed. The calibrated value will be used. The loss parameters to be used in the analysis are included in the following table. The values were added to the basin model.
Subbasin | Initial Loss | Constant Loss |
COR | 0.10 | 0.23 |
FUL | 0.10 | 0.23 |
ARD | 0.10 | 0.23 |
Adding the routing reaches and ungaged subbasins, as shown in the following figure, completed the input. Steps followed to complete the Basin Model are included in the HEC-HMS User's Manual. New Meteorologic Models and Control Specifications were added. 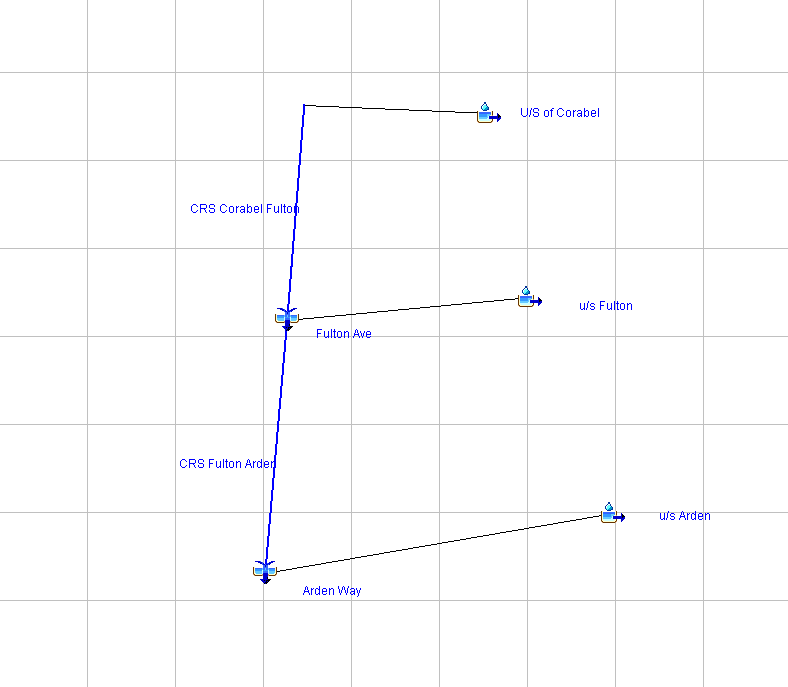
In order to complete the Meteorologic Model for the 0.01 AEP event, as shown in the following figure, the analyst used depths from locally-developed Depth-Duration-Frequency (DDF) functions. The DDF functions are based upon data from a NWS gage with a long period of record. 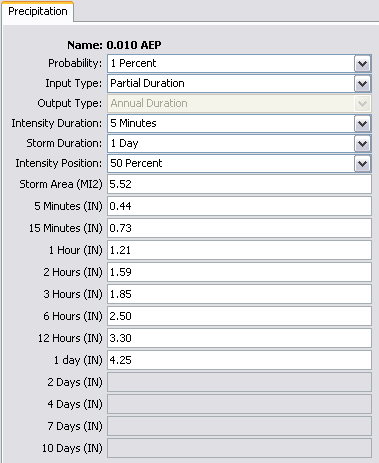
Once completed, the analyst computed a simulation run to calculate the combined outflow hydrograph at Arden Way for the 0.01 AEP event. The resulting peak flow and total runoff volume are included in the following table.
Condition | Peak Flow | Runoff Volume |
Existing (without development) | 941 | 794.2 |
Future (with development) | 1,003 | 828.8 |
Percent increase | 6.6% | 4.4% |
To account for the development of the open area in the COR subbasin, the analyst modified the percent of impervious area, unit hydrograph, and loss rate values. Based on current and proposed land uses, the analyst estimated that the impervious area for the entire subbasin would increase from 50 to 55 percent.
Intuitively, the analyst expected that the unit hydrograph lag would decrease and Cp would increase. Using relationships from the Denver Lag Equation (http://www.ems-i.com/wmshelp/WMSHELP.htm), an increase from 50 to 55 percent impervious area would increase the Cp value by eight percent. This results in a modified value of 0.96 for the COR subbasin. Using Equation 1 (the regional lag equation), an increase of five percent of impervious area decreases the lag by four percent. This results in a modified lag of 4.68 hours. The loss rates are a function of the soil type. The soil type will not change with the development. So, the loss values will not change.
A duplicate basin model was created, and the percent impervious, Snyder's unit hydrograph lag, and Cp, were modified. Using the same boundary and initial conditions as the existing condition input, the future peak flow was calculated. The resulting peak flow and total runoff volumes are summarized in the previous table.
Sensitivity Analysis
The model results should be verified to determine that they agree reasonably well with related analyses and with expected results. Independent data sources and parameter values from HEC-HMS input should be used for an unbiased comparison. Alternatives include comparison to other regional studies, regional estimates of flow per unit area, nearby gage statistics, and the USGS regional regression equations. The analyst chose the USGS regional regression equations for the comparison. The equations estimate peak flow for AEP events ranging from the 0.5 to 0.01. The USGS publishes these equations for locations all over the United States. For example, equations related to the state of Washington are published in Magnitude and Frequency of Floods in Washington (Sumioka, 1998).
The regression equations for California are published in Magnitude and Frequency of Floods in California (Waananen, 1977). There are six sets of equations for California. Each set is applicable to a specific region of the state. Sacramento lies in the Sierra flood-frequency region. The flood-frequency equation for the 0.01 AEP event in this region is:
\big(3\big) \hspace{5cm} Q_{1\%} = 15.7 A^{0.77}P^{1.02}H^{-0.43}
where:
Q1%= the flow for the 0.01 AEP event, in cf
A = the drainage area, in square miles
P = the mean annual precipitation, in inches
H = the average main channel elevation at ten and 85 percent points along the main channel length, in 1,000 feet
The application of the USGS equations is limited to a specified range of watershed characteristics. The range is based upon the characteristics of the watersheds used in developing the equations. For example, the equation for the Sierra flood-frequency region is applicable to watersheds that have a mean elevation between 100 to 9,700 feet, a mean annual precipitation between seven to 85 inches, and a drainage area between 0.2 to 9,000 square miles. In addition, the equations are not generally applicable to streams in urban areas affected by development. However, factors that account for urbanization have been developed and published by Rantz (1971), Sauer (1983), and Jennings (1994).
The CRS/SRS watershed is below the applicable range of mean elevation for the Sierra equation. So, for comparison sake, an elevation of 1,000 feet was assumed. Using an area of 5.5 square miles and a mean annual precipitation of eighteen inches, the analyst computed a 0.01 AEP peak flow of 1,113 cfs. If the urbanization factor by Rantz (1971) is applied, the peak flow is increased to 1,500 cfs. Considering the uncertainty and variance in the USGS regional equations, this compares reasonably to the approximately 1,000 cfs computed with HEC-HMS. Procedures for evaluating model and regression results are described in Evaluation of Flood Frequency Estimates for Ungaged Watersheds (Thomas, 2001). Using the functions developed by Rantz (1971), an increase in developed watershed of five percent will reasonably increase the peak runoff of the 0.01 AEP event by six percent.
Processing of Results
To determine how significant this increase in flow is to the peak stage in CRS, a channel model can be used to compute stage. To do so, the analyst could use the peak flow values from the HEC-HMS results as input to the HEC-RAS computer program. Using channel geometry and roughness data, the program computes water surface elevations based upon the flow input.