Download PDF
Download page Introduction to the Debris Yield Methods.
Introduction to the Debris Yield Methods
Subbasin Sediment/Debris Yield
A subbasin represents a catchment where precipitation falls and causes surface runoff. Within the subbasin, erosional processes can occur from a combination of several different physical processes. Raindrops can cause erosion when they strike the ground surface and break apart the top layer of the soil, dislodging soil particles and move with overland flow. Overland flow also generates erosive energy to the ground surface further breaking apart the topsoil layer. As the overland flow rate increases, flow concentrates in rills increasing the erosive energy on the surface. Total erosion is closely linked to the precipitation rate, land surface slope, and post-wildfire condition. The debris yield methods within HEC-HMS require meteorologic and hydrologic inputs along with parameters to estimate debris. Not all methods are equally adept at representing a particular watershed.
- LA Debris Method EQ 1: Event simulation for use in watershed areas 0.1 to 3.0 mi2 when flow data is not available. Based on maximum 1-hr rainfall intensity, relief ratio, drainage area, and fire factor (Gatwood_2000_Los Angeles District Debris Method.pdf).
- LA Debris Method EQ 2-5: Event simulation for use in watershed areas 3.0 to 200 mi2. Based on the peak discharge, relief ratio, drainage area, and fire factor (Gatwood_2000_Los Angeles District Debris Method.pdf).
- Multi-Sequence Debris Prediction Method (MSDPM): Event and continuous simulation for use in watershed areas 0.1 to 3.0 mi2 when flow data is not available. Based on the maximum 1-hr rainfall intensity, relief ratio, drainage area, and fire factor (Pak&Lee_2008_ A Statistical Sediment Yield Prediction Model Incorporating the Effect of Fires and Storm Event.pdf).
- USGS Emergency Assessment Debris Model: Event simulation for use in watershed areas 0.004 to 12.7 mi2 when flow data is not available. Based on maximum 1-hr rainfall intensity, relief, drainage area, and burn area ( Gartner_2014_EmpModelsPredictDF.PDF).
- USGS Long-Term Debris Model: Continuous simulation for use in watershed areas 0.004 to 12.7 mi2 when flow data is not available. Based on maximum 15-min rainfall intensity, relief, drainage area, and burn area ( Gartner_2014_EmpModelsPredictDF.PDF).
The available methods for debris yield prediction following fire events can be a useful to schedule cleanout operations for debris basins, and develop an emergency response strategy for semi-arid areas where plentiful sediment supplies exist and frequent fires occur. Predicting debris yields under post-wildfire conditions are important for hazard mitigation and flood risk planning. Debris flows can block access to roads and bridges inhibiting emergency responders, as well as greatly damaging a community's water supply and property. Current prediction efforts are aimed at estimating the volume and distribution of debris flows. Predicting debris yield volume, estimating debris basin capabilities, and developing yield mitigation alternatives is essential information needed for mitigating against flood and debris hazards.
Tutorial Overview
In this workshop, you will become familiar with several debris yield methods that are available within HEC-HMS. Specifically, you will:
- Enter initial parameter values within a basin model, create a simulation run, and compute the simulation.
- Calibrate model parameter values to achieve a better fit to provided data.
- Repeat for additional debris yield methods.
- Compare and contrast the differences between each debris yield method.
In terms of application, all tasks are similar but different in level of detail for each task.
- Task 1: A simple field level application with a single storm event based on field data easily accessed from the field office (Rainfall data, BAER Fire Severity map, USGS quad map, Google map, etc.)
- Task 2: An application with multiple storm events based on GIS processing data (DEM, Rainfall data, USGS quad map, Google map, etc.)
- Task 3: An application with multiple storm events based on GIS and Debris basin data (Debris basin structure data, DEM, Rainfall data, USGS quad map, Google map, etc.)
- Task 4: An application including 3-subbasins and 1-reach elements with multiple storm events based on GIS (Channel geometry data, DEM, Rainfall data, USGS quad map, Google map, etc.)
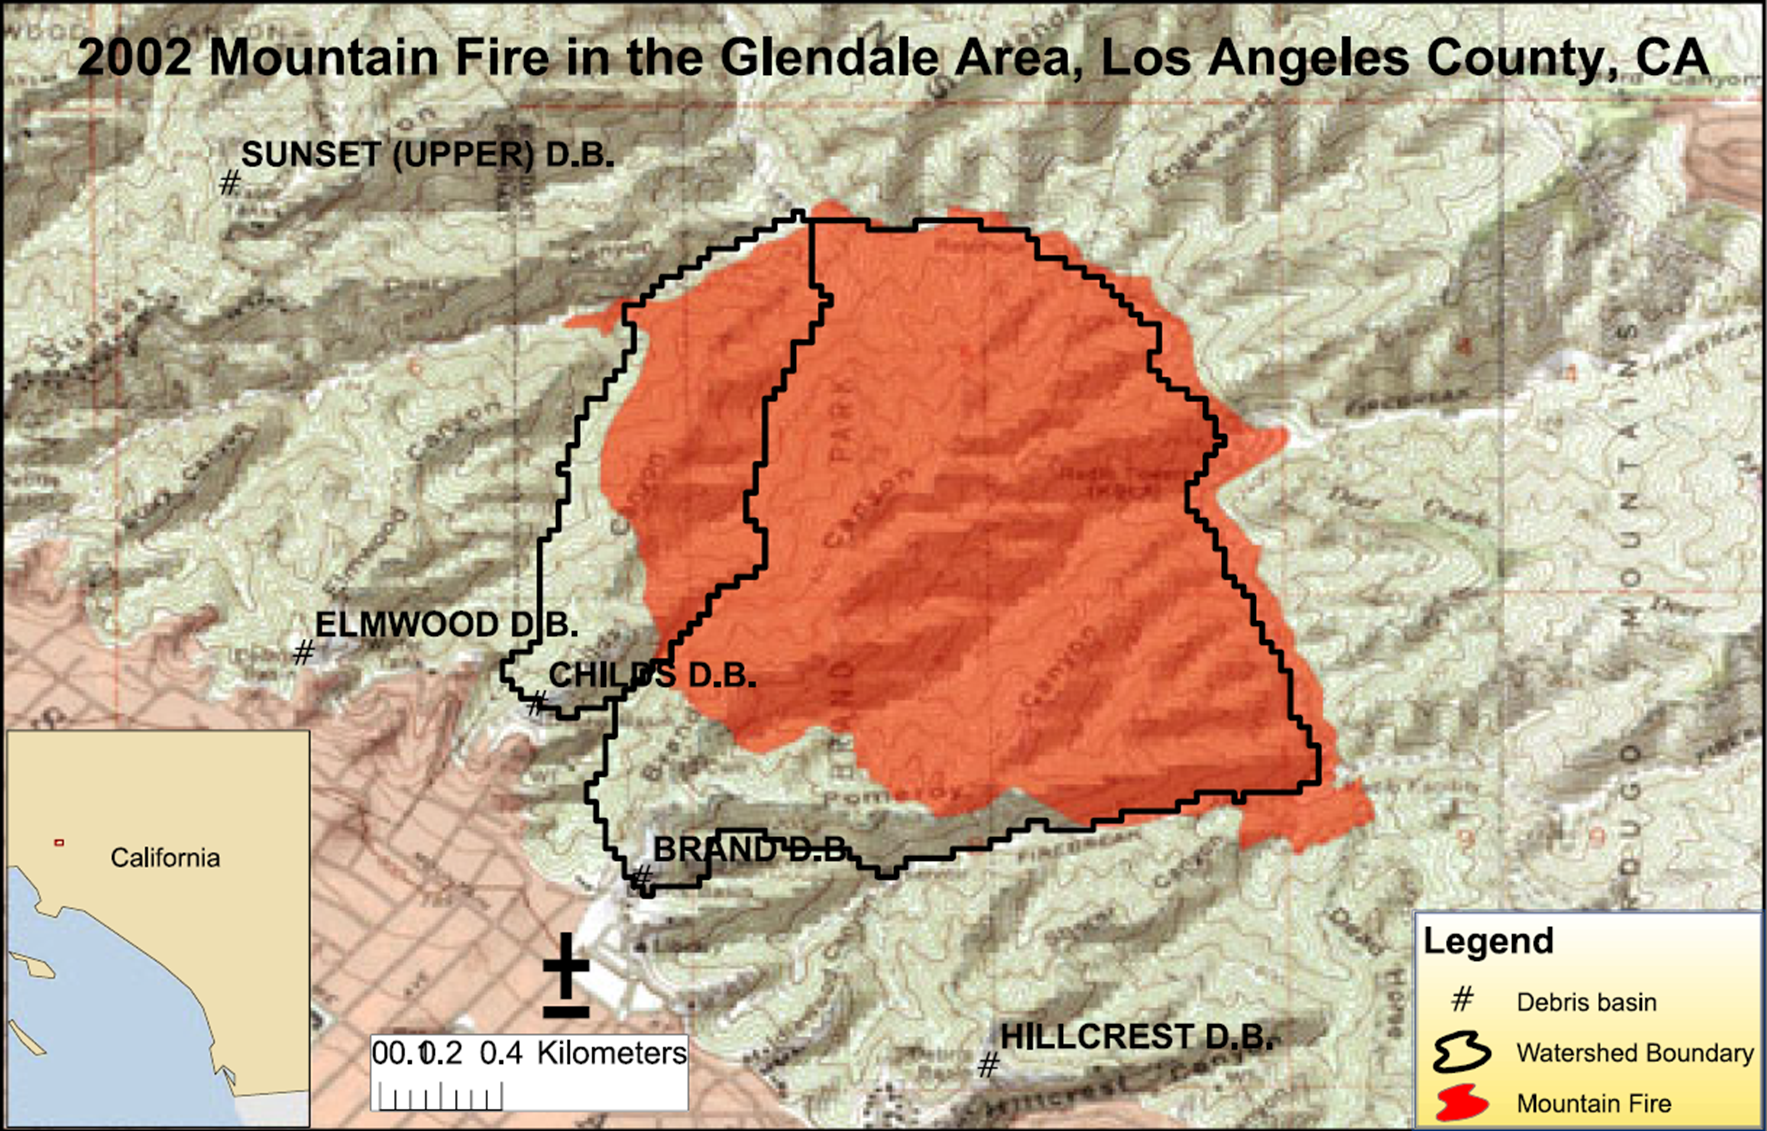
Tasks 1-3: This workshop uses the Brand Canyon watershed located upstream of the town of Glendale, California, shown in the Figure below. The "Mountain Fire" occurred in the Glendale area on September 9, 2002 and burned over 303 ha (749 acres) (LACDPW, 2003, Storm Report Los Angeles County 2002-2003). An existing debris dam called the Brand Debris Basin was put in place to provide debris flow control for the downstream community. Brand Debris Basin was built in 1965 and consists of a rolled earth-filled embankment about 400 feet long and 45 feet in height. A storm event between November 8, 2002, and April 2, 2003 triggered a debris flow event. The debris yield was measured to be 81,385 m3 for the Brand debris basin.
You will be using the Brand Canyon Watershed HEC-HMS model for this debris yield modeling application. Three precipitation gages [Childs Canyon Debris Basin, Downtown Los Angeles Federal Building, and Brand Park (Gage No. 210C)] are located in the vicinity of the Mountain Fire area. The Childs Canyon Debris Basin precipitation gage was chosen for the data analysis because its precipitation data was most reliable compared to the other gages.
Task 4: This workshop uses the Deer Creek Canyon watershed located in San Bernardino County. On October and November, 2003, the Padua Fire, Grand Prix Fire, and Old Fire in the San Gabriel Mountains and San Bernardino Mountains burned nearly 36,826 ha including the watershed of Deer Creek Debris Basin. Precipitation data were collected from three precipitation gages [Demens Creek Debris Basin (DCDB), Mt. Baldy (MTBY), and San Antonia Dam (SNTO)], located in the vicinity of the Grand Prix Fire area. After analyzing data from three precipitation gages, the Mt. Baldy (MTBY) precipitation gage was selected for the data analysis because its data were the most reliable and its elevation is closer to the average elevation of watersheds. The watershed upstream of the Deer Creek debris basin was burned 100% by the Grand Prix Fire (Pak and Lee, 2012).