Download PDF
Download page Applying New Frequency Storm Enhancements.
Applying New Frequency Storm Enhancements
Using the Precipitation-Frequency Grid Importer, Depth Calculator, and User-Specified Depth-Area-Reduction
Overview
In this tutorial, you will learn how to apply new Frequency Storm precipitation options that were added to HEC-HMS 4.10. You will 1) use the precipitation-frequency grid import tool to bring gridded NOAA Atlas 14 point precipitation-frequency data into an HEC-HMS model. You will then learn how to 2) use the Precipitation-Frequency Depth Calculator tool. The Precipitation-Frequency Depth Calculator tool automates the process of calculating average precipitation-frequency depths for the entire watershed or for individual subbasins. HEC-HMS offers two options for calculating average point precipitation-frequency depths, uniform for all subbasins and variable by subbasin. The uniform for all subbasins option generates a bounding polygon that includes all subbasins in the basin model. The program will intersect the precipitation-frequency grids with the bounding polygon to calculate the watershed average precipitation-frequency depth. For watersheds with higher precipitation variability among individual subbasins, the variable by subbasin option calculates the average point precipitation-frequency values for each individual subbasin. Both options will be covered in this tutorial. Finally, you will learn how to 3) apply the user specified depth-area-reduction option. The user specified depth-area-reduction method allows you to use custom depth-area-reduction curves for reducing point precipitation depths.
Download the initial HEC-HMS project files - Village_Creek_HMS_start.zip
Download the Precipitation-Frequency grids - Data.zip
Importing Precipitation-Frequency Grids
- Download the Village Creek HEC-HMS model as well as the Precipitation-Frequency Dataset and unzip the files.
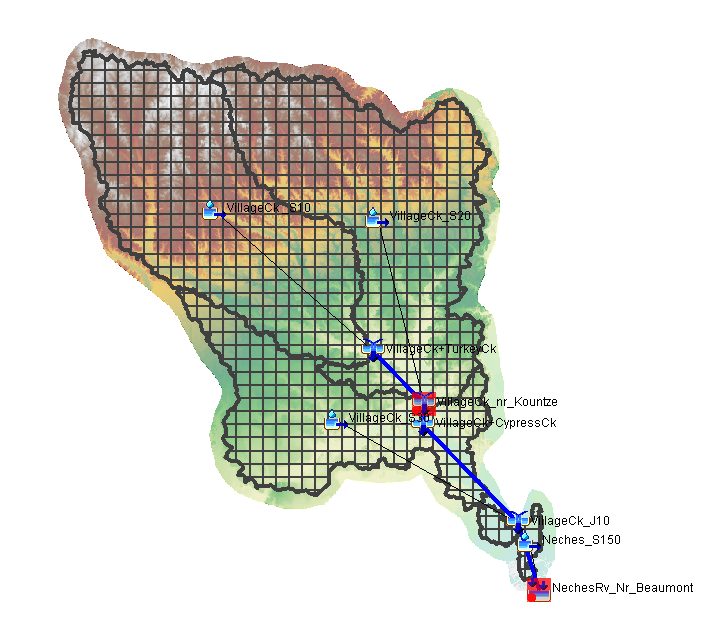
- Start HEC-HMS (version 4.10 beta 1 or newer) and open the Village_Creek project. Open the basin model by expanding the basin model folder in the Watershed Explorer and clicking on the Village_Creek basin model. The basin model map should look similar to the figure below.
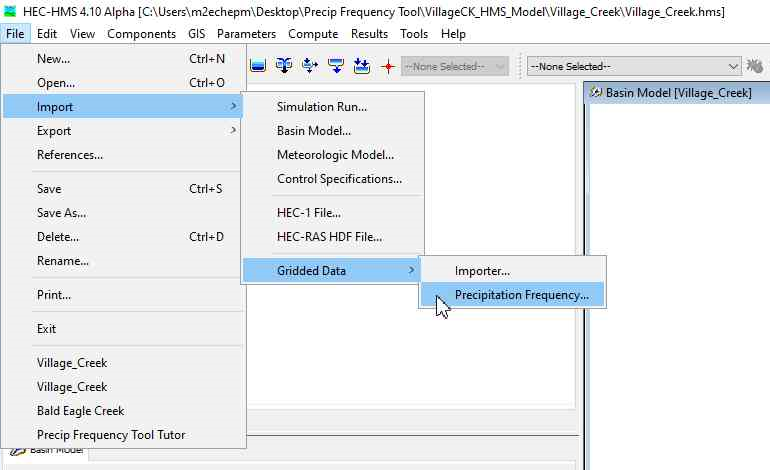
Import the gridded precipitation-frequency ascii files. The 1 percent point precipitation-frequency grids were downloaded from the NOAA Atlas 14 website. As shown below, select the File | Import |Gridded Data | Precipitation Frequency menu option to open the Precipitation-Frequency Grid Importer.
NOAA Atlas 14 point precipitation-frequency grids
The region-specific NOAA Atlas 14 point precipitation-frequency grid files were generated by NOAA's Hydrometeorological Design Studies Center. These files can be downloaded from the Precipitation-Frequency Data Server (PFDS) (https://hdsc.nws.noaa.gov/hdsc/pfds/pfds_gis.html) via a pull-down menu. For the purposes of this tutorial, precipitation-frequency estimates of a partial duration series and a 1 percent annual exceedance probability were downloaded for durations that range from 1 hour to 4 days.
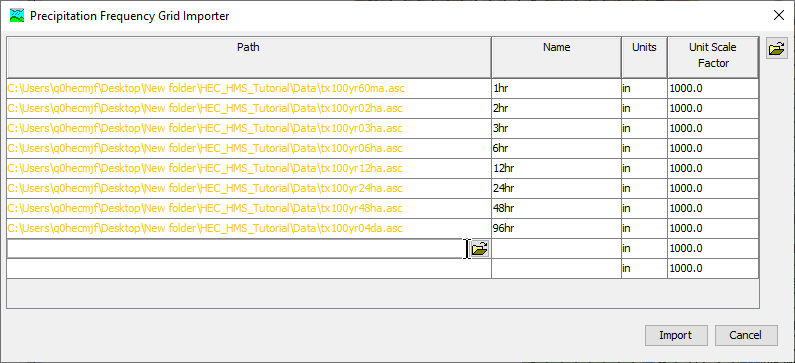
- In the Precipitation Frequency Grid Importer editor, select the unzipped precipitation-frequency ascii files in the cells in the Path column by clicking the open folder icon on the right side of the cell. Replace the Name of each file with the corresponding hourly value. The units will remain in inches. The NOAA Atlas 14 precipitation-frequency grid values are scaled by a factor of 1000 to decrease the file sizes. Set the Unit Scale factor to 1000 for each file. When completed, the Precipitation-Frequency Grid Importer editor will look similar to the figure shown below.
The orange pathname font color indicates a file that is located outside of the HEC-HMS project directory. Click Import and a new message window will appear as shown below. When using the importer tool, HEC-HMS will make copies of the precipitation-frequency grids and place the copies in the project's data folder. Select OK. New grid data components have now been added to Village Creek HEC-HMS project.
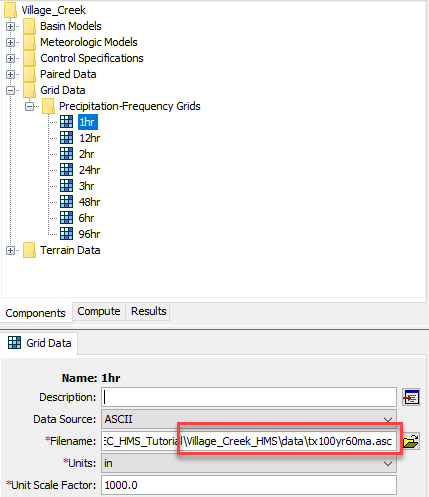
- Within the Watershed Explorer, expand the Grid Data and Precipitation-Frequency Grids folders. Select and view the Component Editor for the 1hr precipitation-frequency grid to ensure the grid was imported properly. You should notice the pathname indicates the grid was copied to the project data folder as shown below.
Precipitation-Frequency Depth Calculator (Uniform for All Subbasins)
In the main Watershed Explorer window, expand the Meteorologic Models and Frequency Storm Uniform folders, and select Frequency Storm node to open the Component Editor.
Linking a Basin Model
The Village_Creek basin model has already been linked to the Frequency Storm Uniform meteorologic model. The Precipitation-Frequency Depth Calculator button will only be activated when a basin model with georeferenced subbasins has been linked to the meteorologic model.
Take care when linking basin and meteorologic models. Once scenario to avoid is linking multiple basin models where each has different geometry but use similar subbasin elements names. HEC-HMS will allow this to happen, but it might get confusing to the modeler or reviewer which basin model and elements have appropriate precipitation depths. You can avoid this confusion by using different subbasin names when modifying basin model geometries.
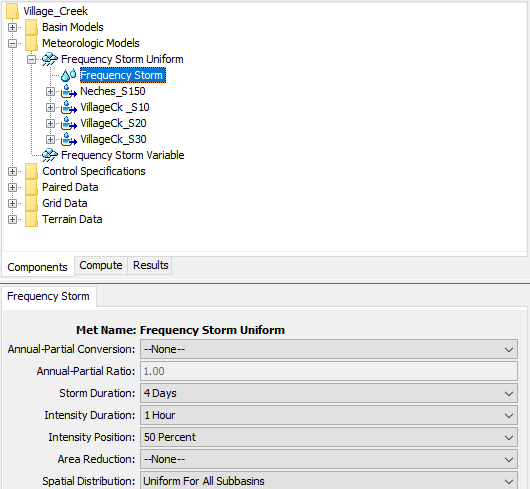
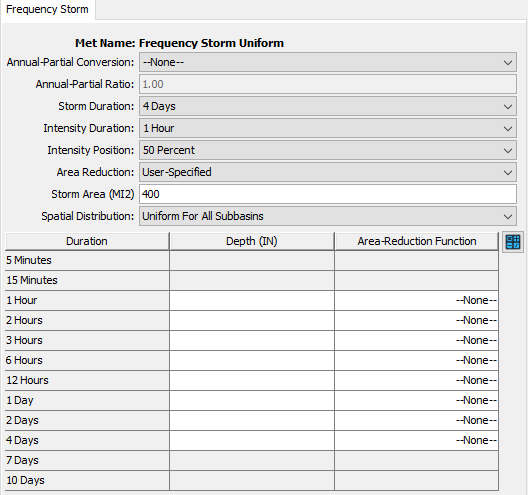
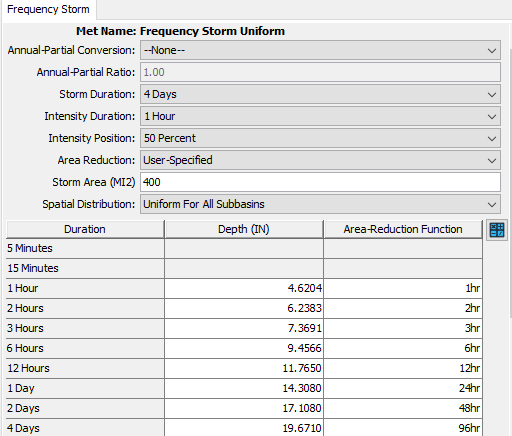
- As shown below, you will see the Storm Duration was set to 4 Days and the Intensity Duration was set to 1 Hour. Change the Area Reduction option to User-Specified and input 400 square miles for Storm Area. Leave the Spatial Distribution as Uniform for All Subbasins.
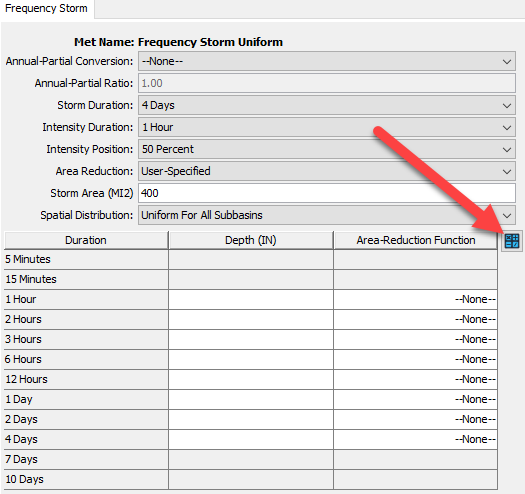
- As shown below, select the Precipitation-Frequency Depth Calculator icon located to the right of the Area-Reduction Function column header to open the Frequency Precipitation Calculator editor.
- As shown below, assign the corresponding precipitation-frequency grid to each duration and select Calculate.
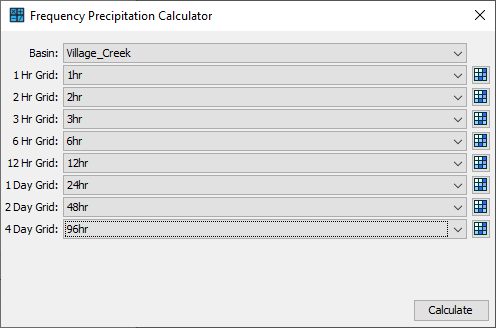
As shown below, a new window will open with the average point precipitation-frequency depths calculated for the total watershed's bounding polygon. Select Apply to copy the point precipitation-frequency values to the Frequency Storm Component Editor.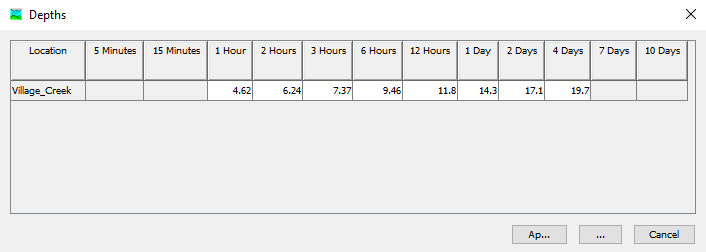
Area-reduction functions were already added to the project using the Paired Data Manager. The figure below shows the 1-hour depth-area reduction curve.
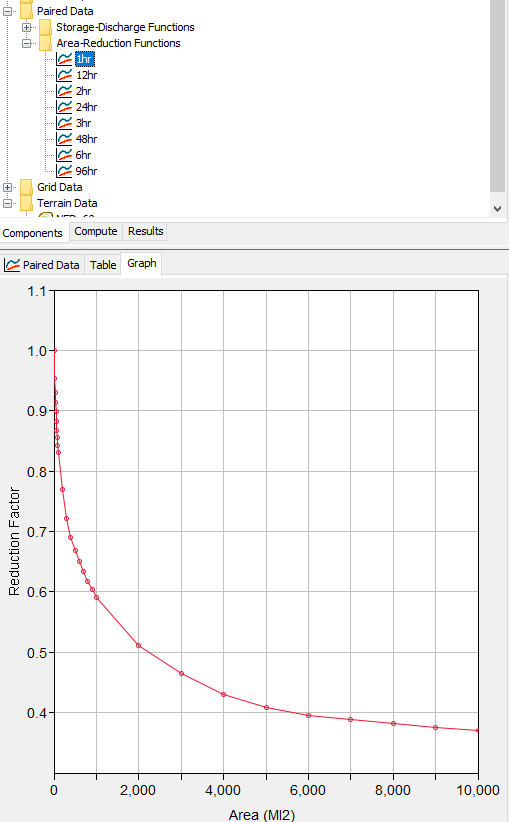
Assign the Area-Reduction Function corresponding to the appropriate storm duration in the Frequency Storm Component Editor as shown below. When running a simulation, HEC-HMS will use the storm area to lookup the appropriate depth-area reduction factor for each duration and then adjust the point precipitation-frequency values.Precipitation Depth Precision
By default, HEC-HMS will round precipitation depths to the fourth decimal place when transferring the computed values from the Calculator's depth table to the Frequency Storm Component Editor.
Storm Area
Take care when setting the storm area, results from a simulation using the frequency storm precipitation method will be most accurate at the location in the basin model with a drainage area that is like the storm area. If you need to estimate flow-frequency information at many locations in the basin model, then consider using the Depth-Area Analysis compute type. The Depth-Area Analysis compute allows you to choose multiple locations in the basin model and the program will automatically use the drainage area at each analysis point and compute a frequency storm with a storm area that is set to the drainage area.
Depth-Area Reduction
It is important to note that point precipitation-frequency data, such as NOAA Atlas 14, does not in any way represent what a hypothetical storm may look like over a larger area. Storms typically have an intense center(s) but generally decrease in intensity as you get further away from the center. For this reason, it is extremely important to reduce the point precipitation depths when applying them over a larger area. Using point precipitation-frequency data without reduction will likely lead to applied precipitation depths that are considerably overestimated.
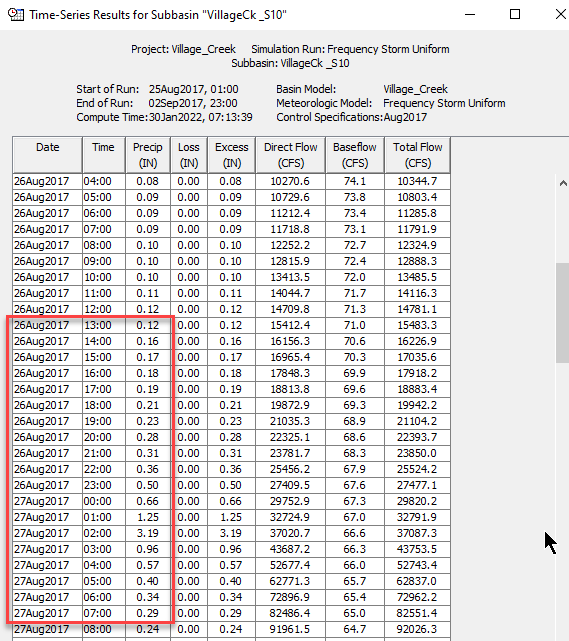
Select the Run: Frequency Storm Uniform option from the Compute toolbar's dropdown menu and select the Compute All Elements button to run the simulation. You can view the hyetograph for any subbasin in the basin model, time-series results should be similar to those in the figure below (hyetograph will be the same for all subbasins).
Results
The figure below shows the maximum 1-hour precipitation is 3.19 inches. This value was computed by multiplying the point 1-hour precipitation frequency value, 4.6204 inches, by the 1-hr depth area reduction factor for a 400 square mile storm, 0.69.
Precipitation-Frequency Depth Calculator (Variable by Subbasin)
The example shown above used the same point precipitation depth values for all subbasins in the basin model. For some watersheds, precipitation can vary significantly from the headwaters to the outlet. Examples include watersheds that flow from inland areas to the coast and watersheds with significant mountainous areas in headwater locations. The Frequency Storm precipitation method contains an option to vary the precipitation depths per subbasin.
- In the Watershed Explorer, expand the Meteorologic Models and Frequency Storm Variable folders and select the Frequency Storm node to open the Component Editor.
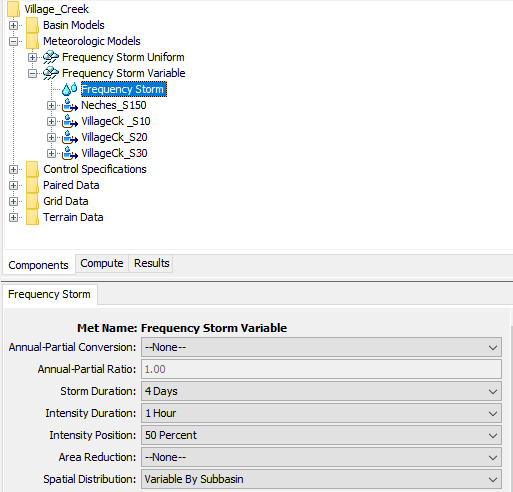
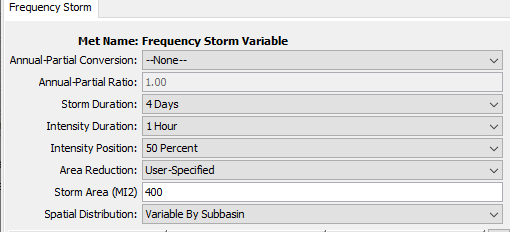
- As shown below, you will see the Storm Duration was set to 4 Days and the Intensity Duration was set to 1 Hour. Change the Area Reduction option to User-Specified and input 400 square miles for Storm Area. Leave the Spatial Distribution as Variable By Subbasins.
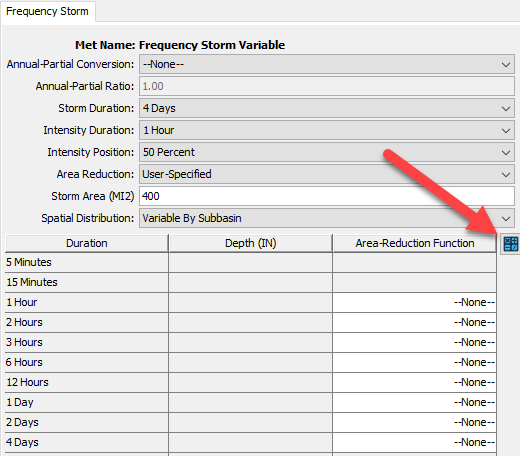
- As shown below, select the Precipitation-Frequency Depth Calculator icon located to the right of the Area-Reduction Function column header to open the Frequency Precipitation Calculator editor.
- As shown below, assign the corresponding precipitation-frequency grid to each duration and select Calculate.

As shown below, a new window will open with the average point precipitation-frequency depths calculated for each individual subbasin in the Village_Creek basin model. Select Apply to copy the point precipitation-frequency values to the Subbasin level Frequency Storm Component Editors. The second figure below shows the Neches_S150 subbasin's precipitation-frequency depths.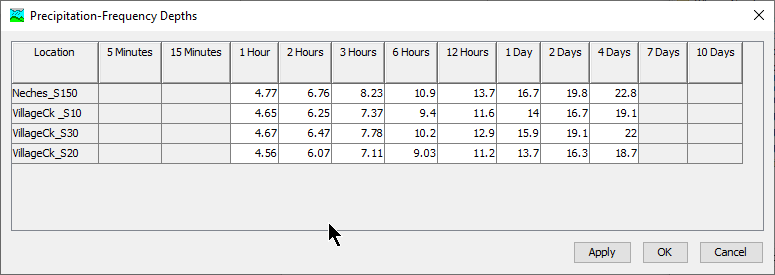
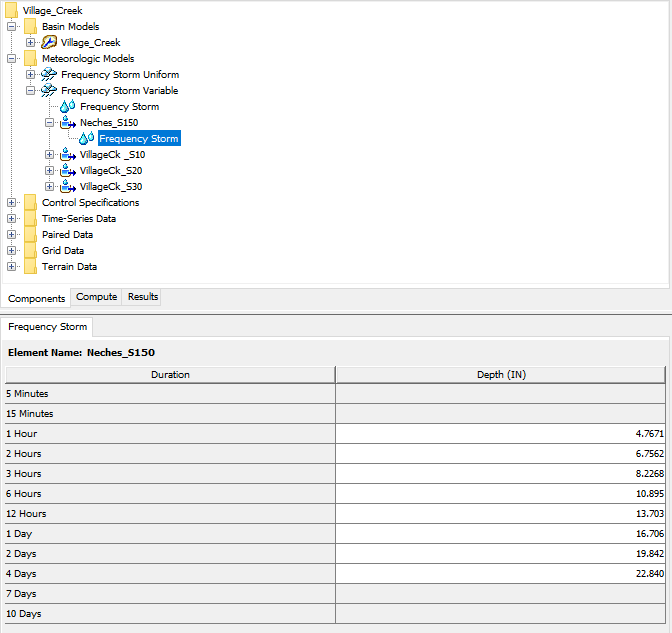
- Assign the Area-Reduction Function corresponding to the appropriate storm duration in the Frequency Storm Component Editor as shown below. When running a simulation, HEC-HMS will use the storm area to lookup the appropriate depth-area reduction factor for each duration and then adjust the point precipitation-frequency values.
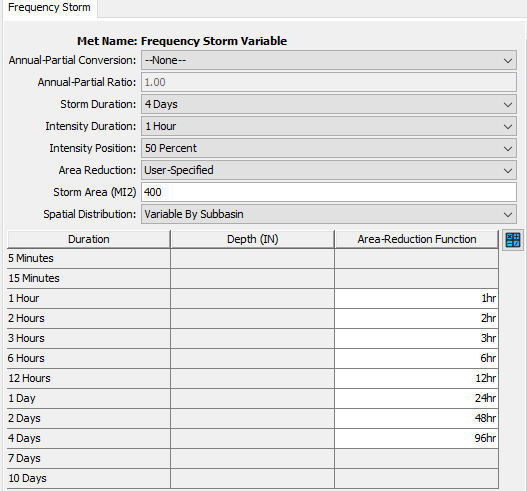
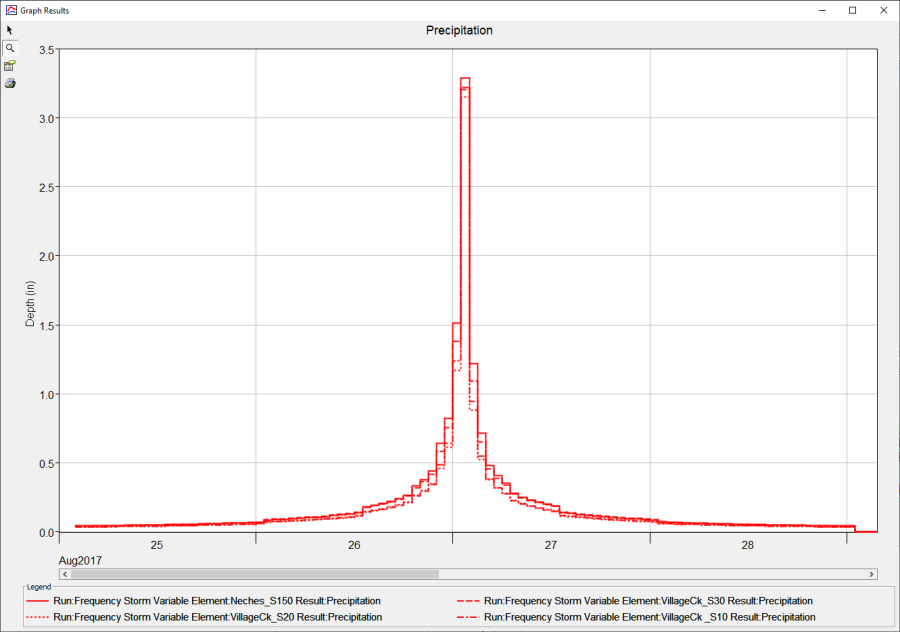
- Select the Run: Frequency Storm Variable option from the Compute toolbar's dropdown menu and select the Compute All Elements button to run the simulation. You can view the hyetograph for any subbasin in the basin model. As shown in the figure below, the precipitation time-series results are slightly different for each subbasin in the model because the variable by subbasin option was used in the Frequency Storm precipitation model.
