Download PDF
Download page Applying New Hypothetical Storm Enhancements.
Applying New Hypothetical Storm Enhancements
HEC-HMS version 4.11 beta 1 was used to develop this tutorial.
Download the initial HEC-HMS project files here - Village_Creek_HMS_initial.zip
Introduction
In this tutorial, you will learn how to apply a new Hypothetical Storm precipitation option that was added to HEC-HMS 4.11. You will start with the same model developed for the tutorial - Applying New Frequency Storm Enhancements. The Applying New Frequency Storm Enhancements tutorial highlighted new capability for the Frequency Storm precipitation method. This tutorial highlights a new option to vary precipitation-frequency information spatially across subbasins when using the Hypothetical Storm precipitation method. Prior to HEC-HMS version 4.11, all subbasins would have the same hyetograph when using the Hypothetical Storm precipitation method. The total storm Hypothetical Storm depth can vary for each subbasin starting in HEC-HMS version 4.11.
The Hypothetical Storm automates the process of calculating average precipitation-frequency depths for the entire watershed or for individual subbasins. HEC-HMS offers two options for calculating average precipitation-frequency depths, uniform for all subbasins and variable by subbasin. The uniform for all subbasins option generates a bounding polygon that includes all subbasins above a user-defined computation point. The program will intersect the precipitation-frequency grid with the bounding polygon to calculate the area average precipitation-frequency depth. For watersheds with higher precipitation variability among individual subbasins, the variable by subbasin option can be used to apply average point precipitation-frequency values for each individual subbasin. Both options will be covered in this tutorial. You will learn how to 1) use the variable by subbasin option within the Hypothetical Storm and 2) define what is needed to allow HEC-HMS to compute precipitation depths from Atlas 14 raster data (the program can use any raster dataset containing precipitation depths).
Become Familiar with the Project
The following steps should help you become familiar with the example project.
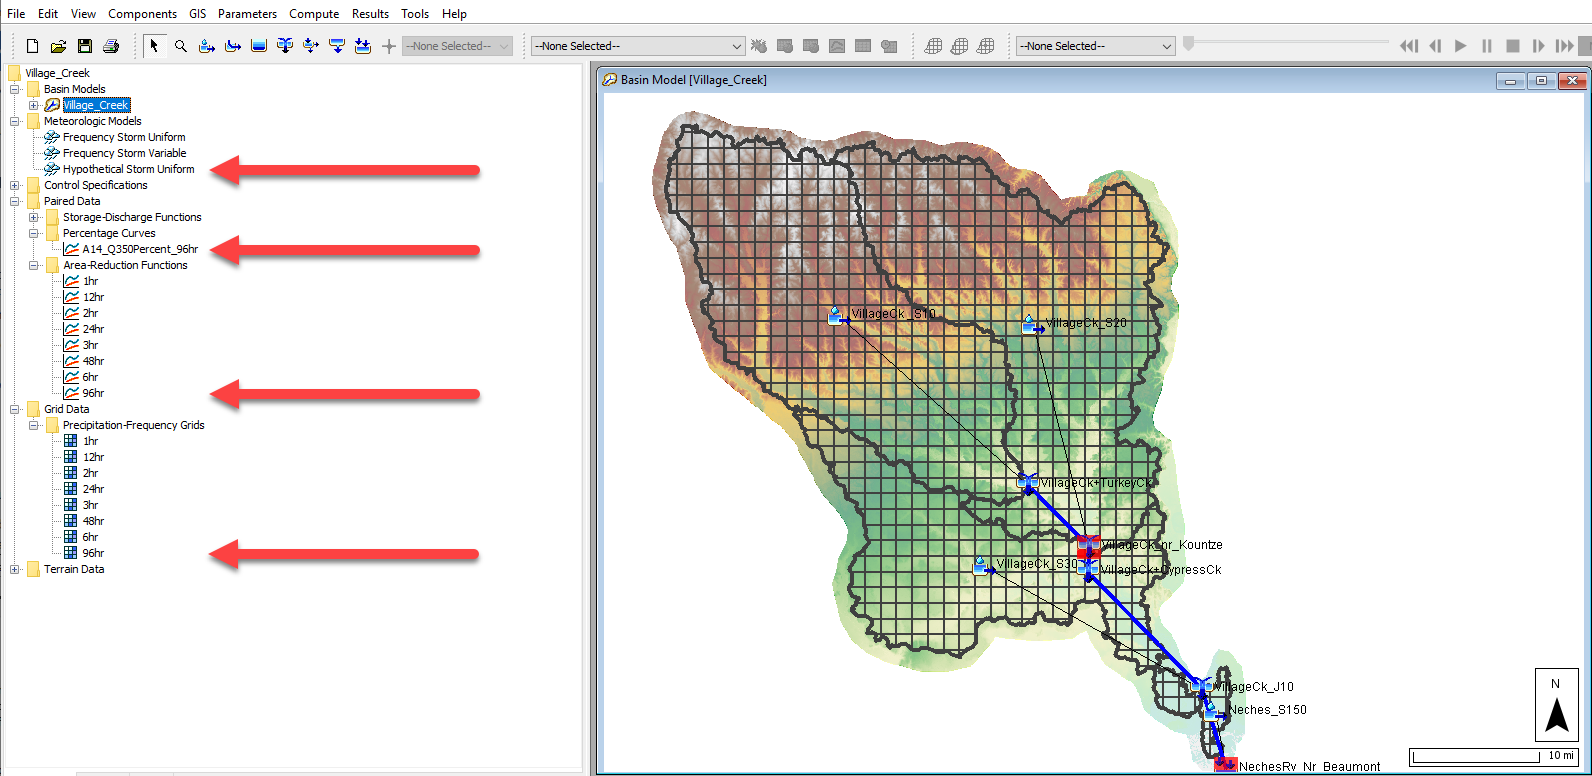
- Open the project. You should see that the project has three meteorologic models already created for you. There are two frequency storm meteorologic models and there is already one hypothetical storm meteorologic model. The existing hypothetical storm model is configured to compute a 96 hour storm hyetograph. It uses the option to distribute a uniform precipitation depth for all subbasins in the Village_Creek basin model. There is one percentage curve, A14_Q350Percent_96hr. This percentage curve represents one of the 96 hour temporal patterns from Atlas 14 (it is the 3rd quartile 50 percent pattern developed for the geographic region where the example watershed is located). There is a area-reduction function for the 96 hour storm duration, named 96hr, and a 96 hour precipitation-frequency grid that was imported from the Atlas 14 website, named 96hr.
- Open the Hypothetical Storm Component Editor for the Hypothetical Storm Uniform meteorologic model as shown below. You should notice the Storm Pattern is set, the storm duration is 96 hours, the 96hr Atlas 14 precipitation-frequency grid is selected, the 96hr user-defined area reduction curve is selected, a Storm Area of 1130.1 square miles was entered, and the Uniform For All Subbasin option is selected. You do not have to enter a storm area if a computation point is selected. When a computation point is selected, the program will automatically compute the drainage area above the computation point and use this area when computing the area reduced precipitation depth. In this case, the NechesRv_Nr_Beaumont element is the computation point. This location has a drainage area of 1130.1 square miles.
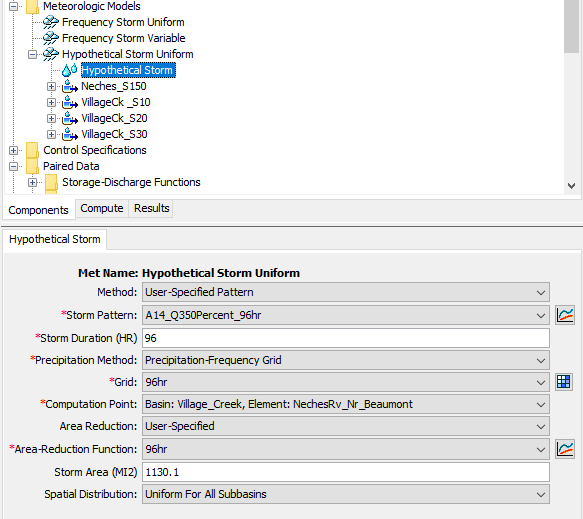
- When computing the simulation, the program will automatically extract the average precipitation-frequency raster value, using the 96hr grid, for all grid cells located in the watershed upstream of the NechesRv_Nr_Beaumont element. This watershed average depth is then reduced by applying the area-reduction factor for the computed/defined storm area. Then, the area reduced total storm depth is applied to the temporal pattern to compute the hyetograph for each subbasin.
- Run the Hypothetical Storm Uniform simulation. You should see the following three notes in the message log. The computed total watershed 96 hour precipitation depth was 19.671 inches. The total depth was reduced to 14.176 inches after applying the area reduction factor that converted this depth from a single point (no storm area) to a storm with an area of 1130.1 square miles.
NOTE 23406: Hypothetical storm depth: 19.671 in.
NOTE 23407: Hypothetical storm area: 1,130.1 mi².
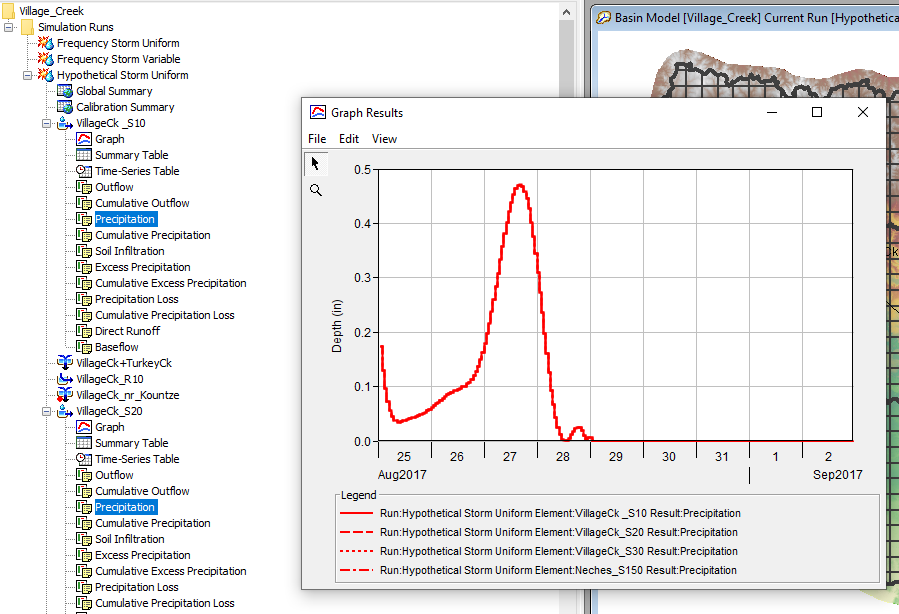
NOTE 23409: Area-reduced hypothetical storm depth: 14.176 in. - View the subbasin hyetographs and summary results for the Hypothetical Storm Uniform simulation at each of the four subbasin elements. As shown below, you should see the same hyetographs for all four subbasins. Also, the subbasin results show all four subbasin have a total storm depth of 14.176 inches (as expected).
Use the Variable by Subbasin Option in the Hypothetical Storm
- Create a copy of the Hypothetical Storm Uniform meteorologic model and name it Hypothetical Storm Variable.
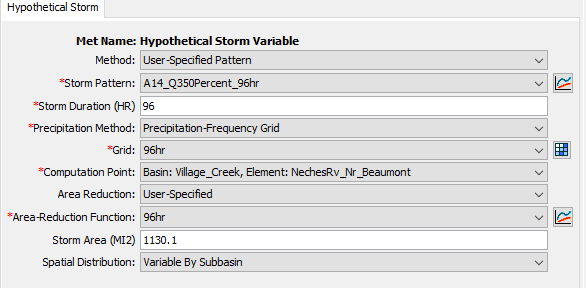
- Open the Hypothetical Storm Component Editor in the Hypothetical Storm Variable meteorologic model. As shown below, change the Spatial Distribution option to Variable by Subbasin.
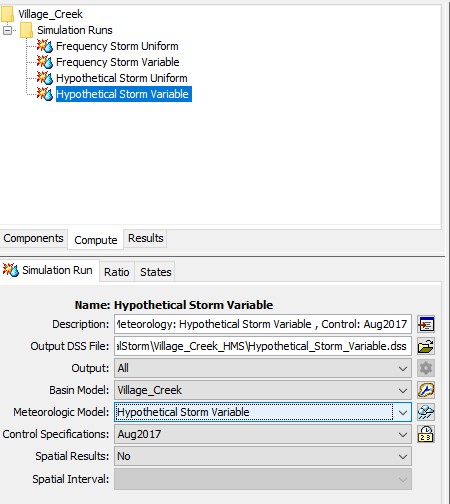
- Create a copy of the Hypothetical Storm Uniform simulation and name it Hypothetical Storm Variable. Make sure you select the Hypothetical Storm Variable meteorologic model within the new Hypothetical Storm Variable simulation as shown below.
- Run the Hypothetical Storm Variable simulation. You should notice the following messages in the message log. You can see the subbasin average precipitation depth values and the values after the precipitation was reduced for a storm area of 1130.1 square miles. The program automatically computed the subbasin average depth values using GIS operations and the precipitation-frequency raster and subbasin polygons.
NOTE 23407: Hypothetical storm area: 1,130.1 mi².
NOTE 23414: Hypothetical storm depth for subbasin VillageCk _S10: 19.111 in.
NOTE 23409: Area-reduced hypothetical storm depth: 13.772 in.
NOTE 23414: Hypothetical storm depth for subbasin VillageCk_S20: 18.742 in.
NOTE 23409: Area-reduced hypothetical storm depth: 13.506 in.
NOTE 23414: Hypothetical storm depth for subbasin VillageCk_S30: 22.029 in.
NOTE 23409: Area-reduced hypothetical storm depth: 15.875 in.
NOTE 23414: Hypothetical storm depth for subbasin Neches_S150: 22.84 in.
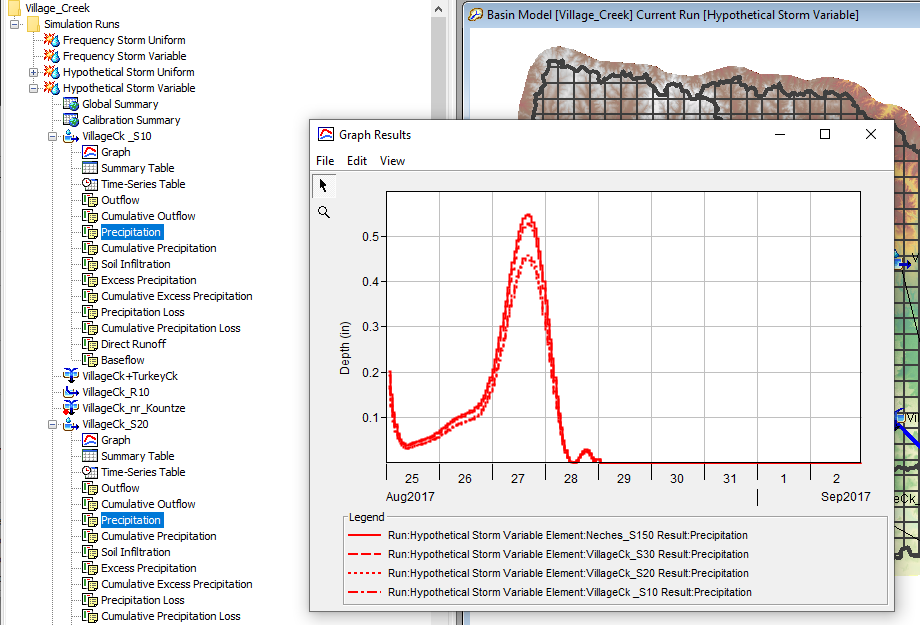
NOTE 23409: Area-reduced hypothetical storm depth: 16.459 in. - View the subbasin hyetographs and summary results for the Hypothetical Storm Variable simulation at each of the four subbasin elements. As shown below, you should see different hyetographs for all four subbasins. Also, the subbasin results show all four subbasin have a different total storm depth, matching those values in step 4 above.
- If you were to compare results from the uniform precipitation and variable precipitation hypothetical storm simulations at the NechesRv_Nr_Beaumont element, you will see very similar results (less than 1 percent difference). However, you will see larger differences in results at the outlet of individual subbasins. Differences in results become smaller as you work your way downstream due to "averaging" results over larger and larger areas.
User Defined Precipitation-Frequency Depths
You can manually enter the precipitation depths for each subbasin if you do not have a precipitation-frequency raster or if you computed the precipitation depths externally.
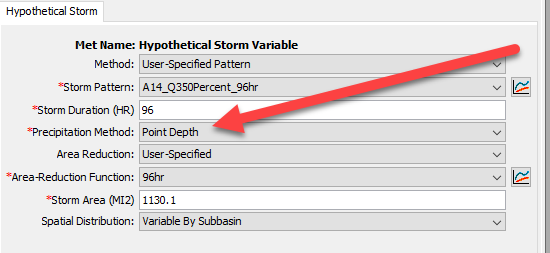
- Open the Hypothetical Storm Component Editor in the Hypothetical Storm Variable meteorologic model. As shown below, change the Precipitation Method to Point Depth.
- As shown below, expand the subbasin nodes in the Hypothetical Storm Variable meteorologic model and enter the following precipitation depths for each subbasin.
Neches_S10 = 22.84
VillageCk_S10 = 19.11
VillageCk_S20 = 18.74
VillageCk_S30 = 22.03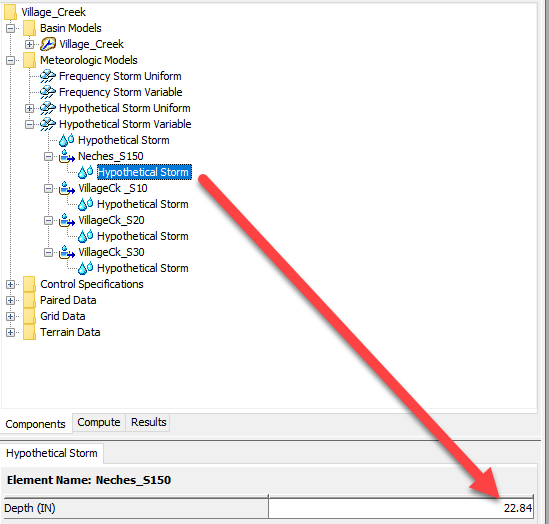
- Rerun the Hypothetical Storm Variable simulation. You will notice the same results as computed in the previous task where the program automatically extracted the total storm depths from the precipitation-frequency grid.