Download PDF
Download page Applying the Depth Area Analysis Simulation Type.
Applying the Depth Area Analysis Simulation Type
 Initial_Depth_Area_Analysis.zip
 Final_Depth_Area_Analysis.zip
This tutorial is designed to help users of HEC-HMS learn how to perform depth-area analysis and automate the process of developing a separate frequency storm for each analysis point in the basin model. Each depth-area analysis is based on a basin model and a meteorologic model. The analysis also includes the definition of the simulation time window, time step, and the selection of analysis points within the basin model. The depth-area analysis is designed to work with both the frequency storm and hypothetical storm meteorologic models. Each analysis point is its own separate simulation within the overall depth-area analysis simulation. The drainage area at each analysis point is extracted and used to update the precipitation depths based on the user selected area-reduction curve. In the case of the hypothetical storm, both the area-reduction and temporal pattern can be based on the drainage/storm area.
Overview
In this tutorial, you will perform two tasks to create and perform depth area analysis: 1) create a depth-area analysis simulation with a frequency storm and 2) create a depth-area analysis simulation with a hypothetical storm.
Background
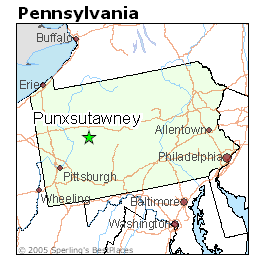
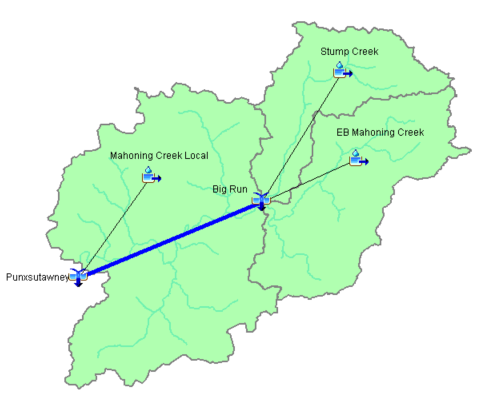
The study area for this tutorial is the 158 square mile Punxsutawney watershed in Pennsylvania. A basin model has been created for you in HEC-HMS. A map of where the watershed is located is shown in Figure 1 and a screenshot of the basin model is shown in Figure 2.
Task 1: Create a Depth-Area Analysis Simulation with a Frequency Storm
The downstream outlet of the basin model is at the town of Punxsutawney, and the drainage area at the model outlet is 158 square miles. Simulating the 1% flow at this location using frequency based precipitation and the HEC-HMS model would require a storm area of 158 square miles so that the appropriate area-reduction information is applied to the precipitation frequency information. This drainage area of 158 square mile should not be used to compute results at other locations in the basin model, like the junction of Big Run, because it would not reflect the correct area-reduction and the simulated 1% flow. To compute the correct 1% flow at the Big Run junction, a storm area of 70 square miles would need to be defined in the meteorologic model. When simulating frequency based flow in an HEC-HMS model, it could be tedious to create multiple copies of the meteorologic model and then vary the storm area for each analysis point.
The Depth-Area Analysis simulation includes a built in capability where the program runs multiple variations of the frequency storm meteorologic model; each variation has a different storm area. HEC-HMS allows the modeler to choose multiple points, analysis points, within the basin model when creating the depth-area analysis. During the depth-area analysis simulation, the program will extract the drainage area at each of the selected analysis point locations, interpolate the appropriate area-reduction factor for the analysis point's drainage area, and create appropriate precipitation hyetographs for the drainage area upstream of each analysis point. Think of the depth-area analysis simulation as multiple simulations within one. Each analysis point is its own simulation where the flow at the analysis point is appropriately simulated given the drainage area, and area-reduction information defined in the frequency storm meteorologic model.
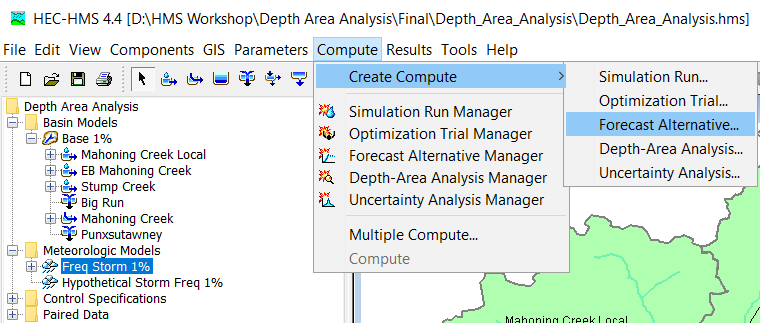
- Select Compute menu. Select Create Compute and Depth-Area Analysis….as shown in Figure 3.
- Create a new depth-area analysis named Depth-Area Freq Storm 1%. Click Next.
- Select basin model Base 1%. Click Next.
- Select meteorologic model Freq Storm 1%. Click Finish.
- After the depth-area analysis has been created, go to the Compute tab and select the depth-area analysis to open the Component Editor.
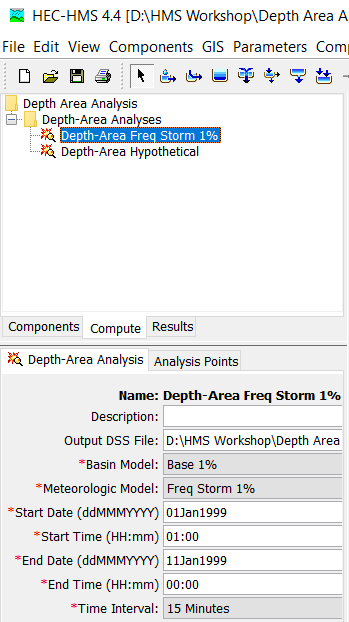
- Enter a start date of 01Jan1999, a start time of 01:00, an end date of 11Jan1999, and an end time of 00:00. Set the Time Interval to 15 minutes as shown in Figure 4.
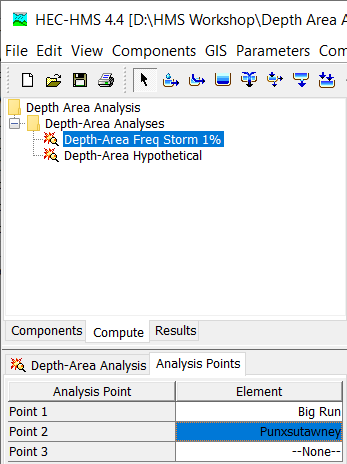
- Select the Analysis Points tab. Select the Big Run junction as Point 1 and Punxsutawney junction as Point 2 as shown in Figure 5.
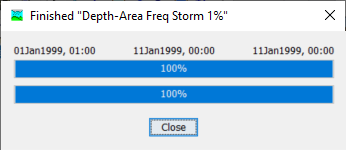
- Run the depth-area analysis. There are really two simulations that happen during the compute as shown on Figure 6. For point 1, HEC-HMS will apply area-reduction factors for a storm area of 70 square miles and run the basin model to the Big Run junction. For point 2, HEC-HMS will apply area-reduction factors for a storm area of 158 square miles and run the entire basin model.
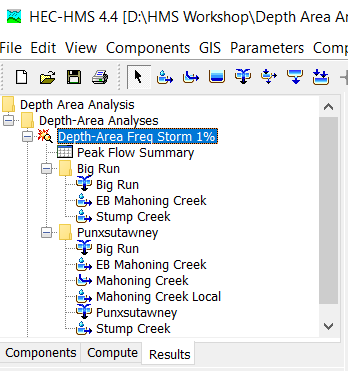
- Results for the depth-area analysis should be viewed from the Results tab of the Watershed Explorer, as shown in Figure 7. The Peak Flow Summary table contains the correct "area-reduced" results for each analysis point. Below the summary table is a separate folder with results for each of the analysis points. Notice the folder only contains results for the elements upstream of the analysis point in Figure 8.

Task 2: Create a Depth-Area Analysis Simulation with a Hypothetical Storm
- Select Compute menu. Select Depth-Area Analysis Manager as shown in Figure 9.

- Click New… and create a new depth-area analysis named Depth-Area Hypothetical. Click Next.
- Select basin model Base 1%. Click Next.
- Select meteorologic model Hypothetical Storm Freq 1%. Click Finish.
- After the depth-area analysis has been created, go to the Compute tab and select the depth-area analysis to open the Component Editor.
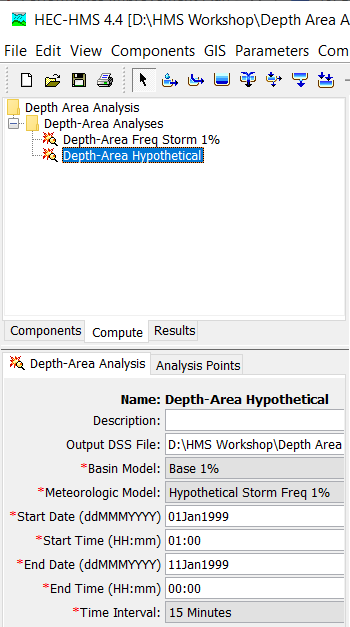
- Enter a start date of 01Jan1999, a start time of 01:00, an end date of 11Jan1999, and an end time of 00:00. Set the Time Interval to 15 minutes as shown in Figure 10.
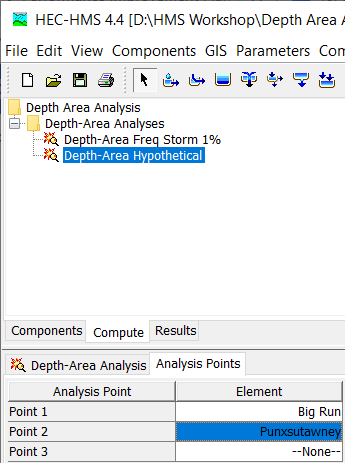
- Select the Analysis Points tab. Select the Big Run junction as Point 1 and Punxsutawney junction as Point 2 as shown in Figure 11.
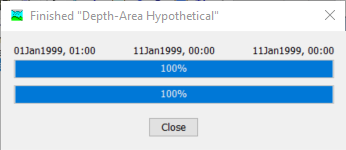
- Run the depth-area analysis. There are really two simulations that happen during the compute as shown on Figure 12. For point 1, HEC-HMS will apply area-reduction factor for a storm area of 70 square miles and run the basin model to the Big Run junction. For point 2, HEC-HMS will apply area-reduction factor for a storm area of 158 square miles and run the entire basin model.
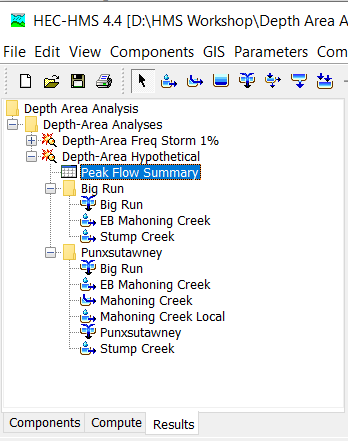
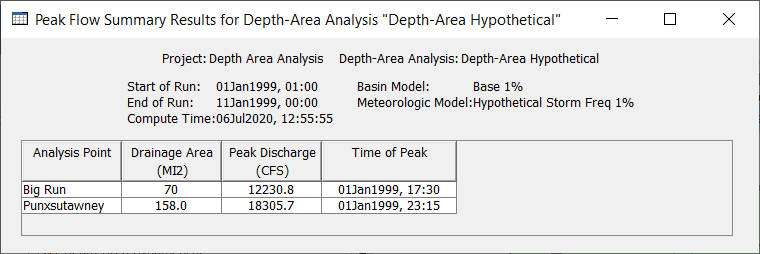
- Results for the depth-area analysis should be viewed from the Results tab of the Watershed Explorer, as shown in Figure 13. The Peak Flow Summary table contains the correct "area-reduced" results for each analysis point. Below the summary table is a separate folder with results for each of the analysis points. Notice the folder only contains results for the elements upstream of the analysis point in Figure 14.
