Download PDF
Download page Creating a Hypothetical Storm Time Pattern Percentage Curve.
Creating a Hypothetical Storm Time Pattern Percentage Curve
Download the Initial project files here -Initial Percentage Curve.zip
Download the Final project files here - Final Percentage Curve.zip
If you are prompted to convert the project to a later version, select "Convert Project" as in the figure below:

This tutorial is designed to show you how to create a storm time pattern, defined as a percentage curve, which can be used within the Hypothetical Storm precipitation method.
Overview
In this tutorial, you will perform two tasks to create a time pattern in HEC-HMS and select the time pattern within the Hypothetical Storm Component Editor:
1) Create a Percentage Curve Paired Data Record.
2) Select the Percentage Curve Time Pattern within the Hypothetical Storm Component Editor.
Background
The basin model has been created for you by combining the three subbasins (Stump Creek, East Branch Mahoning Creek, and Punxsutawney Local) as one subbasin labeled Punxsutawney. The study area is 158 square miles and located in Jefferson County, PA. This tutorial is configured to include a frequency storm precipitation model along with two hypothetical storm precipitation models. This tutorial will focus on creating the temporal pattern, there is another tutorial that provides more in-depth description of the hypothetical storm precipitation method and compares results to the frequency storm precipitation method.
Task 1: Create a Percentage Curve Paired Data Record
Precipitation observations were used to create a basin average hyetograph from a historic storm event. The table below contains the incremental basin average precipitation for a storm event in June 1972. The total storm precipitation was 3.31 inches during a 24-hour period. The precipitation was normalized by dividing the incremental precipitation values by the storm total. Then, the cumulative percent time and percent normalized precipitation were computed as shown in the highlighted columns. The percent time column was computed by dividing the duration by the total storm duration, the total storm duration was 24 hours in this example. When defining a temporal pattern percentage curve in HEC-HMS, both independent (percent storm duration) and dependent (percent total depth) variables must start at 0 percent and end at 100 percent.
The excel spreadsheet (Time Pattern Percent Curve.xls) shows how the incremental precipitation for this tutorial was converted to percentage curves for application in HEC-HMS.
Date and Time | Precipitation (in) | Time (%) | Normalized Precipitation (%) | Cumulative Precipitation (%) |
22 Jun 1972, 02:00 | 0.00 | 0.00 | 0.00 | 0.00 |
22 Jun 1972, 03:00 | 0.01 | 4.17 | 0.30 | 0.30 |
22 Jun 1972, 04:00 | 0.03 | 8.33 | 0.91 | 1.21 |
22 Jun 1972, 05:00 | 0.10 | 12.50 | 3.02 | 4.23 |
22 Jun 1972, 06:00 | 0.25 | 16.67 | 7.55 | 11.78 |
22 Jun 1972, 07:00 | 0.07 | 20.83 | 2.11 | 13.90 |
22 Jun 1972, 08:00 | 0.30 | 25.00 | 9.06 | 22.96 |
22 Jun 1972, 09:00 | 0.30 | 29.17 | 9.06 | 32.02 |
22 Jun 1972, 10:00 | 0.12 | 33.33 | 3.63 | 35.65 |
22 Jun 1972, 11:00 | 0.12 | 37.50 | 3.63 | 39.27 |
22 Jun 1972, 12:00 | 0.01 | 41.67 | 0.30 | 39.58 |
22 Jun 1972, 13:00 | 0.10 | 45.83 | 3.02 | 42.60 |
22 Jun 1972, 14:00 | 0.25 | 50.00 | 7.55 | 50.15 |
22 Jun 1972, 15:00 | 0.20 | 54.17 | 6.04 | 56.19 |
22 Jun 1972, 16:00 | 0.24 | 58.33 | 7.25 | 63.44 |
22 Jun 1972, 17:00 | 0.20 | 62.50 | 6.04 | 69.49 |
22 Jun 1972, 18:00 | 0.21 | 66.67 | 6.34 | 75.83 |
22 Jun 1972, 19:00 | 0.25 | 70.83 | 7.55 | 83.38 |
22 Jun 1972, 20:00 | 0.15 | 75.00 | 4.53 | 87.92 |
22 Jun 1972, 21:00 | 0.05 | 79.17 | 1.51 | 89.43 |
22 Jun 1972, 22:00 | 0.08 | 83.33 | 2.42 | 91.84 |
22 Jun 1972, 23:00 | 0.07 | 87.50 | 2.11 | 93.96 |
22 Jun 1972, 24:00 | 0.09 | 91.67 | 2.72 | 96.68 |
23 Jun 1972, 01:00 | 0.04 | 95.83 | 1.21 | 97.89 |
23 Jun 1972, 02:00 | 0.07 | 100.00 | 2.11 | 100.00 |
Total Precipitation (in) | 3.31 |
|
|
- Open the HEC-HMS project named Hypothetical Storm in the Time Pattern folder.
- Select the Components | Paired Data Manager menu option to open the Paired Data Manager. Choose the Percentage Curves option in the Data Type drop down list. Click the New… button as shown in Figure 1.

- Enter a Name of Precip Pattern - June1972 for the new Percentage Curve and click the Create button.
- Within the Watershed Explorer, navigate to the Paired Data folder. Then expand the Percentage Curves folder to see the new percentage curve. Click on the Precip Pattern - June1972 node in the Watershed Explorer to access the Component Editor.
- Make sure the Date Source is set to Manual Entry as shown in Figure 2.

- Go to the Table tab and copy/paste the information in the Time Pattern Percent Curve.xls spreadsheet as shown in Figure 3.

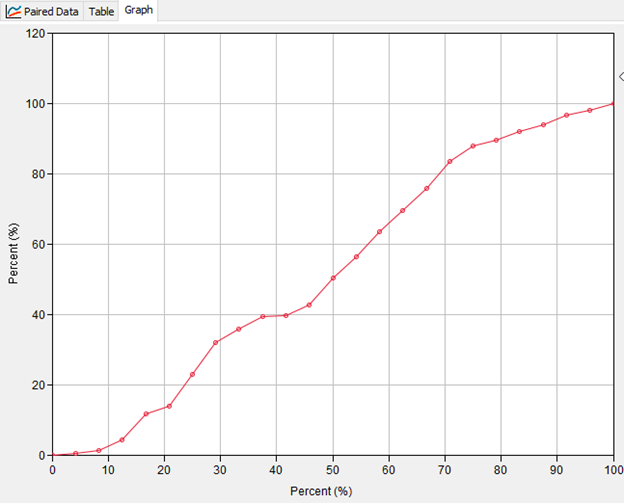
- Go to the Graph tab to see a plot of the time pattern Percentage Curve, as shown in Figure 4.

Task 2: Select the Percentage Curve Time Pattern within the Hypothetical Storm Component Editor
- Select and expand the Hypothetical Storm 1972P Meteorologic Model in the Watershed Explorer and the click on the Hypothetical Storm node in the tree, as shown in Figure 5.

- Click the drop-down list for the Storm Pattern and choose the Precip Pattern – June1972 curve that was created in Task 1.