Download PDF
Download page W5 - Introduction to Calibrating an HEC-HMS Model.
W5 - Introduction to Calibrating an HEC-HMS Model
Model Calibration
Calibrating a hydrologic model is the process of modifying parameters within acceptable ranges to obtain simulated results that replicate known conditions. Model calibration is a necessary component to model development in order to have some level of confidence the simulated results adequately represents the modeled system. Since models can be used to predict future outcomes or potential changes to the watershed, the model results must show it works. In order to calibrate a model, observed data, typically collected in the field, is needed to compare the simulated results. Observed data typically used for calibration are flow discharges and stages.
Overview
In this tutorial you will learn how to perform model calibration as an iterative process of entering and adjusting parameters and evaluating goodness-of-fit between the computed and observed hydrograph. In the Clark Unit Hydrograph Workshop, you got a taste of what model calibration looks like by increasing and decreasing your unit hydrograph parameters. In other tutorials, you learned about different modeling methods and how to initialize those parameters. We will incorporate lessons and techniques learned from those workshops to calibrate a larger basin model. The process of calibration will be iterative and will include manually changing model parameters and checking how those adjustments impact the model's ability to match observed data (flow hydrograph and reservoir pool elevation). There are other methods of calibration such as using optimization tools. However, those will not be covered in this workshop.
In this tutorial you will:
- Enter initial model parameters within a basin model and compute the simulation.
- Adjust model parameters and compare results.
Background
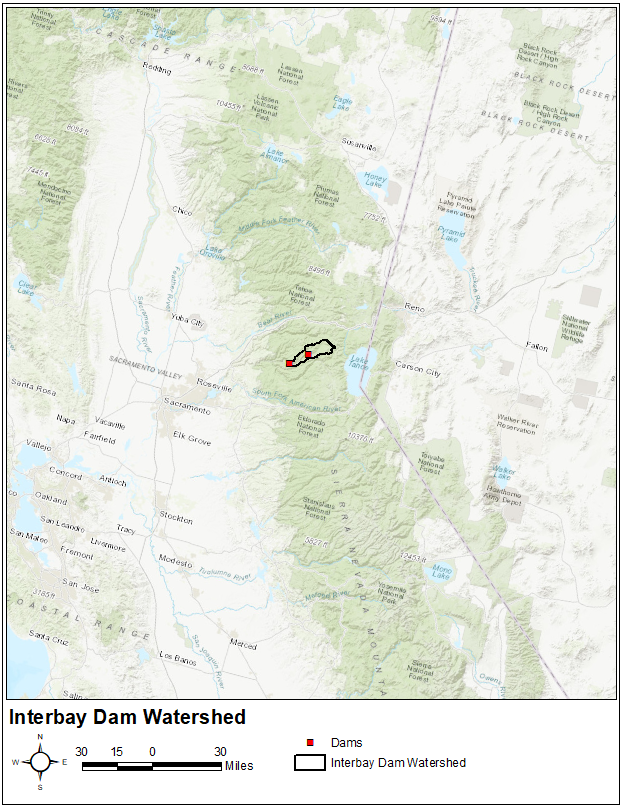
In this workshop, the study area is designated as the Middle Fork American River watershed upstream of Interbay Dam near Foresthill, CA. The Middle Fork American River is part of the American River watershed and is located in central California, as shown in the following figure.

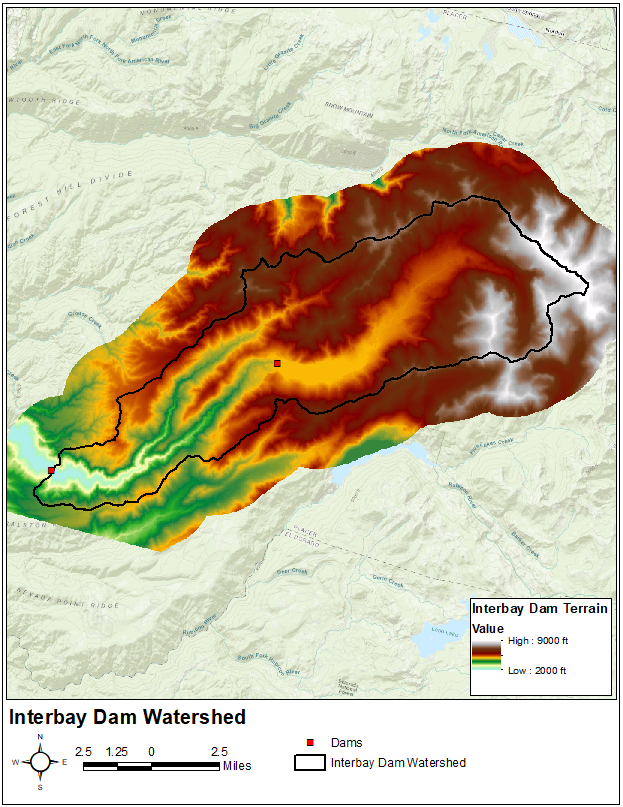
The drainage area upstream of Interbay Dam is approximately 90 sq. mi. Elevations within the study area range from approximately 2000 ft to 9000 ft as referenced to the North American Vertical Datum of 1988 (NAVD88), as shown in the following figure.

Data
A 10-day time period in late December 1996 - early January 1997 will be simulated within this workshop. During this time period, a major flood due to large amounts of precipitation, higher than normal temperatures, and melting snow occurred throughout California, Nevada, and other states in the Pacific northwest. Total damages during this flood event were estimated at nearly $2 billion.
Precipitation, Temperature, and Snow Water Equivalent
Analysis of Period of Record for Calibration (AORC) gridded precipitation and temperatures will be used as the boundary conditions within this workshop. The AORC gridded dataset has a native spatial resolution of 4 kilometer x 4 kilometer and a time step of 1 hour. University of Arizona Snow Water Equivalent (UofA SWE) data will be used as an initial condition within this workshop. The UofA SWE data has a native spatial resolution of 4 kilometer x 4 kilometer and a time step of 1 day. The raw precipitation, temperature, and SWE data files were ingested, projected, and output in DSS format using tools within HEC-HMS.
Reservoir and Streamflow Data
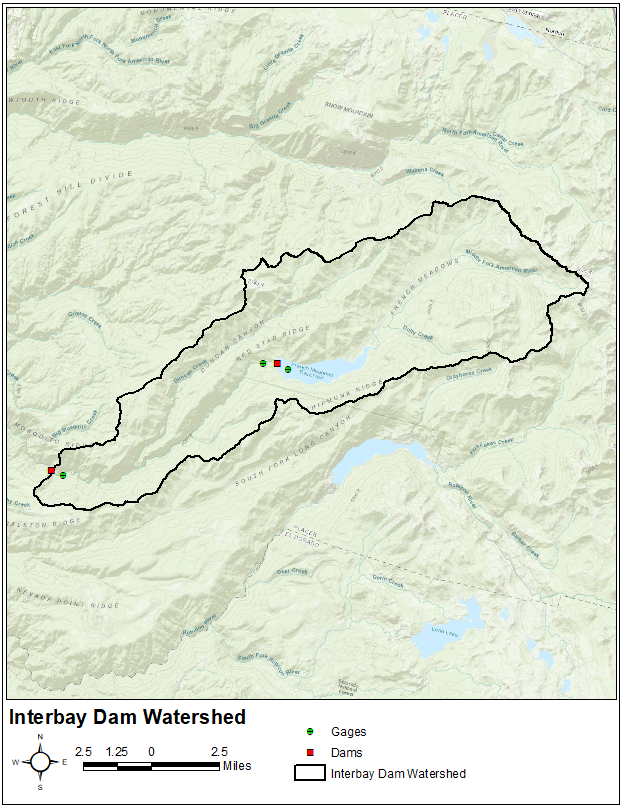
The location of the reservoir pool and streamflow gages in relation to the study area are shown in the following figure.

Daily average pool elevation, outflow, and diverted flow data was imported from NWIS using HEC-DSSVue.
Model Configuration
An HEC-HMS project named "Calibration_Workshop" has already been created for you. This HEC-HMS project contains a basin model named "Dec_1996_Jan_1997", a meteorologic model named "GriddedData_1997", and a control specification named "Dec_1996_Jan_1997".
As shown in the following figure, there are subbasin elements, four junction elements, two routing reach elements, one reservoir element, one diversion element, and one sink element within the existing basin model. This subbasin was originally delineated using terrain data downloaded from the USGS National Map Viewer.

Each subbasin element was configured to use a 2000-meter SHG Structured discretization, the Deficit and Constant loss method, the ModClark unit hydrograph transform method, and the Linear Reservoir baseflow method. The diversion element was configured to use the Specified Flow diversion method. The observed diversion time series was set as the diversion gage. The reservoir element was configured to use the Specified Release method. The observed outflow time series was set as the discharge gage. Finally, the previously-mentioned observed data records were linked to the appropriate elements.