Download PDF
Download page Creating a Temperature Index Snowmelt Model for a Historical Event Simulation.
Creating a Temperature Index Snowmelt Model for a Historical Event Simulation
The goal of this workshop is to configure a meteorologic model to use gridded precipitation and temperature to simulate a historical event in HEC-HMS. The Gridded Temperature Index snowmelt method will be used to simulate accumulation and melt of snow during a flood event occurring in late December 1996 through early January 1997. Because the event being modeled is short, and it is a rain on snow type of event, only a few of the Temperature Index snow parameters will be adjusted when calibrating the model.
Software Version
HEC-HMS version 4.12 was used to create this workshop
Project Files
Download the Initial Project Files here - Interbay_Dam_initial.zip
Download the Data Files here - Downloaded Data.zip
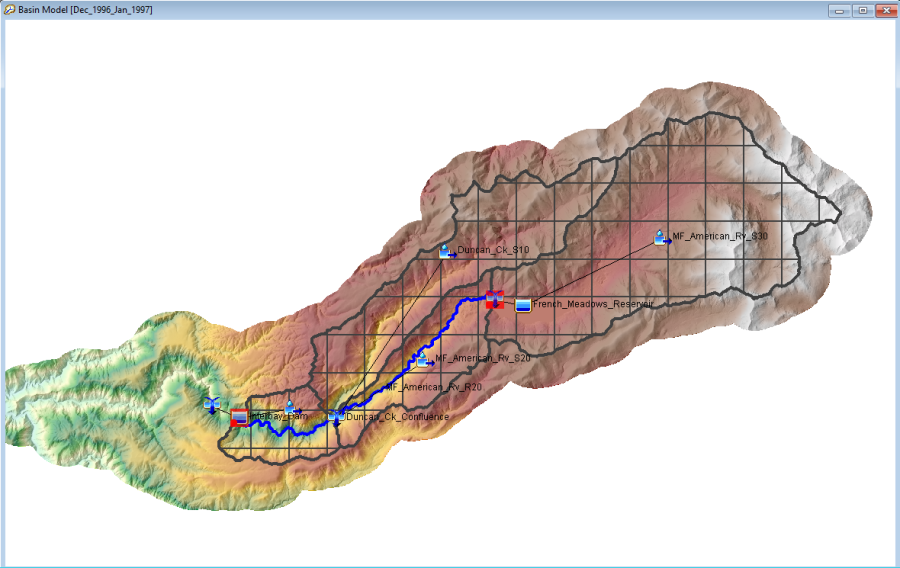
The workshop example uses the watershed upstream of Interbay Dam, located in the Sierra Nevada mountains in California. The elevation range is 2,500 feet to 9,000 feet and the average elevation in the watershed is 5,900 feet. The watershed also encompasses the LL Anderson Dam (which impounds the French Meadows reservoir). The following figure shows the delineation of the watershed upstream of Interbay Dam. The total drainage area is 89 square miles subdivided into four subbasins.
Major tasks in this workshop include:
- Import Gridded Precipitation and Temperature Data
- Import Gridded SWE and Other Snow Initial Condition Grids
- Complete the Meteorologic Model
- Make Adjustments to Temperature Index Snowmelt Model Parameters when Calibrating to Historical Floods
Import Gridded Precipitation and Temperature Data
The Analysis of Period of Record for Calibration (AORC) dataset is used for the meteorologic boundary conditions in this workshop. This dataset has a period of record of 1979 – present time and can be downloaded from the AORC website - https://hydrology.nws.noaa.gov/pub/aorc-historic/AORC_CNRFC_4km/. Separate zip files were downloaded for December 1996 and January 1997 and saved to the …\Downloaded Data\Precipitation and …\Downloaded Data\Temperature directories. Unzip the *.zip files in these two directories.
HEC-HMS includes an option to import external raster data and converts the data to DSS format so it can be used by the program during a simulation. The following steps show how to import the gridded precipitation and temperature datasets into an HEC-HMS model application.
- Open the Interbay Dam HEC-HMS project.
- Select the File | Import | Gridded Data | Importer menu option to open the Gridded Data Import Wizard.
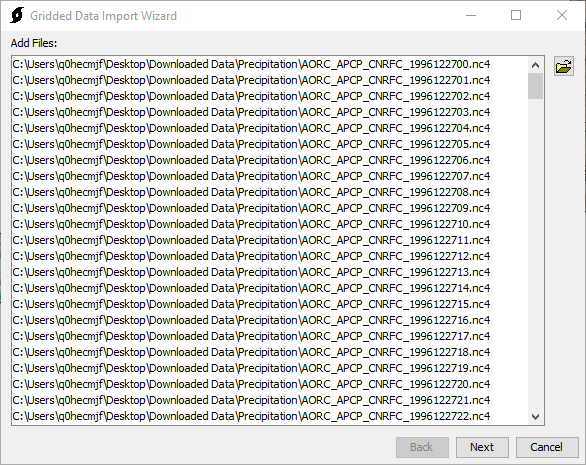
- Click the Folder button to open a file navigator and navigate to the ...\Downloaded Data\Precipitation directory.
- Select the precipitation files from Dec 27, 1996 through Jan 8, 1997 and click Open, then the Next button.
- Make sure to select the APCP_surface variable by moving it to the righthand box and click the Next button.
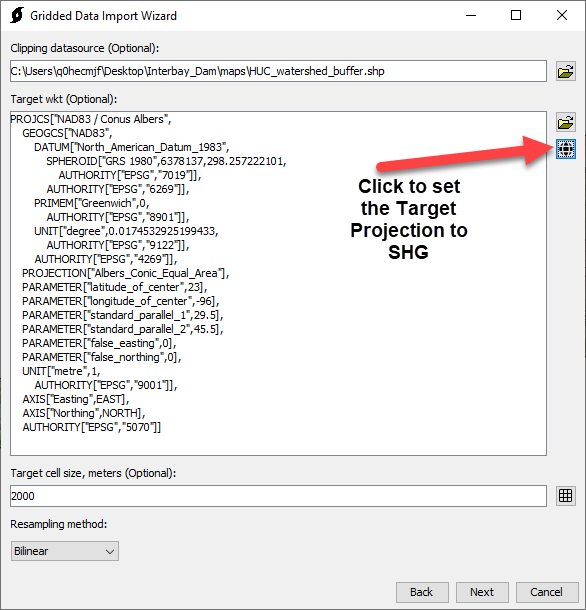
- Use a buffered watershed boundary shapefile to clip the precipitation grids. The buffered watershed boundary shapefile is in the …\Interbay_Dam\maps directory and is named HUC_watershed_buffer. As shown below, the target projection should be Standard Hydrologic Grid (SHG). The target cell size should be 2000 meters and the resampling method should be Bilinear. Click the Next button.
- Choose a location for the output DSS file. Make sure to save the file to the Interbay Dam HEC-HMS project's Data folder, use a descriptive file name like AORC_Precipitation. Use a descriptive A-part; e.g. "SHG". Use a descriptive B-part; e.g. "Interbay Dam". Use a descriptive F-part; e.g. "AORC". Assume that the DSS Units and Data Type will be correct (mm and PER-CUM) and do not check the boxes to overwrite the data type and units. Click the Next button. When the wizard shows "Import complete", click the Close button.
The next step is to add a new precipitation gridset to the HEC-HMS project and then link it to the DSS file that was created above.
- Open the Grid Data Manager by selecting the Components | Grid Data Manager menu option.
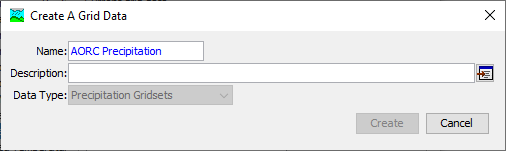
- Make sure the Precipitation Gridsets Data Type is selected and click the New button.
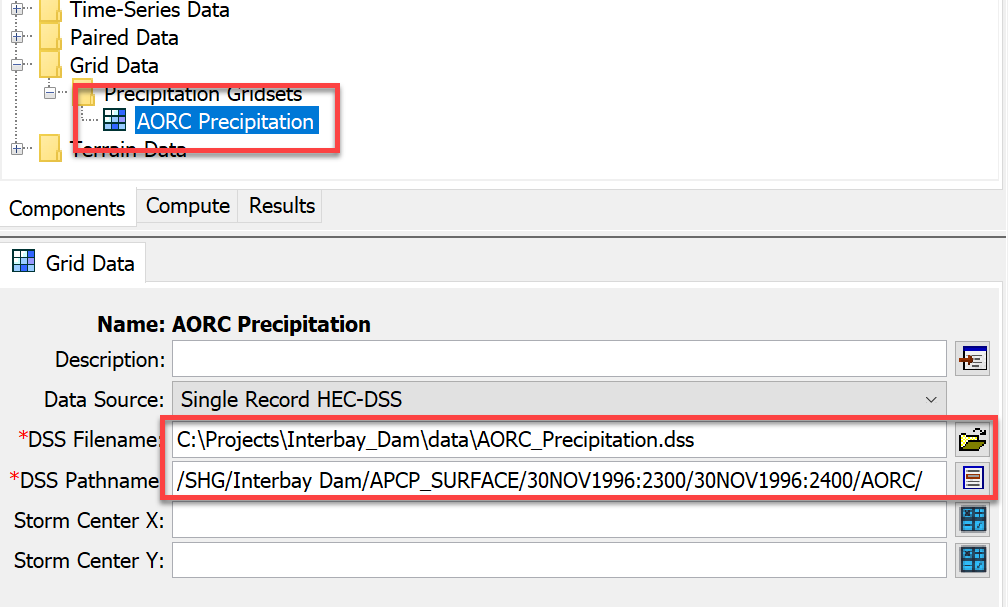
- Within the Create A Grid Data editor, enter a name of AORC Precipitation and click the Create button.
- Select the new Precipitation Gridset in the Watershed Explorer. Then, select the correct DSS file and one of the precipitation grid pathnames in the DSS file. It does not matter which record you select as long as the A, B, C, and F pathname parts are correct.
- Follow the steps above and import the temperature data into a separate DSS file. When stepping through the Grid Data Import Wizard, make sure to select the TMP_2maboveground variable. Use the HUC_Watershed_buffer shapefile to clip the gridded temperature data as well. After converting the temperature data to DSS format, create a temperature gridset in the Interbay Dam HEC-HMS project and link it to the temperature DSS file.
Import Gridded SWE
Initial condition parameters are required by the temperature index model to set state variables that reflect conditions at the beginning of the simulation. These initial conditions can be assigned an initialization method using default values, constant values, or parameter grids. Each initial condition can be assigned a different initialization method. When modeling large, rain-on-snow events, the initial SWE grid becomes the most important initial condition for the temperature index model whereas the other four initial snow condition parameters can be set to zero values.
The NASA National Snow and Ice Data Center archives daily snow water equivalent (SWE) grids developed by the University of Arizona. The data can be downloaded from https://nsidc.org/data/nsidc-0719/versions/1. The website states "The data were created by assimilating in-situ snow measurements from the National Resources Conservation Service's SNOTEL network and the National Weather Service's COOP network with modeled, gridded temperature and precipitation data from PRISM."
SWE data was downloaded for December 1996 and January 1997. The files are in the …\Downloaded Data\Snow directory. The steps below show how to convert the data to DSS format and load an initial SWE grid into the HEC-HMS project.
- Select the File | Import | Gridded Data | Importer menu option to open the Gridded Data Import Wizard.
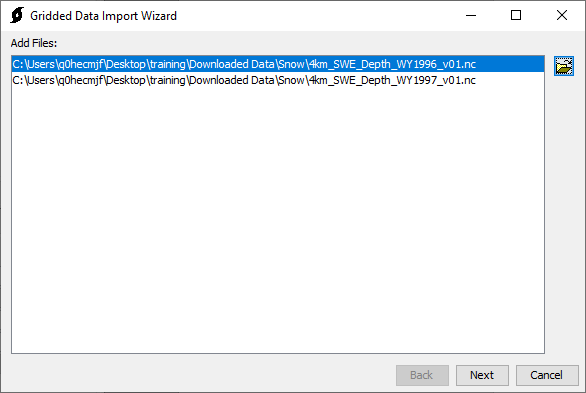
- Select both the 1996 and 1997 SWE files in the …\Downloaded Data\Snow directory and click the Next button.
- Make sure to select the SWE variable and click the Next button.
- Use a buffered watershed boundary shapefile to clip the precipitation grids. The buffered watershed boundary shapefile is in the …\Interbay_Dam\maps directory and is named HUC_watershed_buffer. The target projection should be Standard Hydrologic Grid (SHG). The target cell size should be 2000 meters and the resampling method should be Bilinear. Click the Next button.
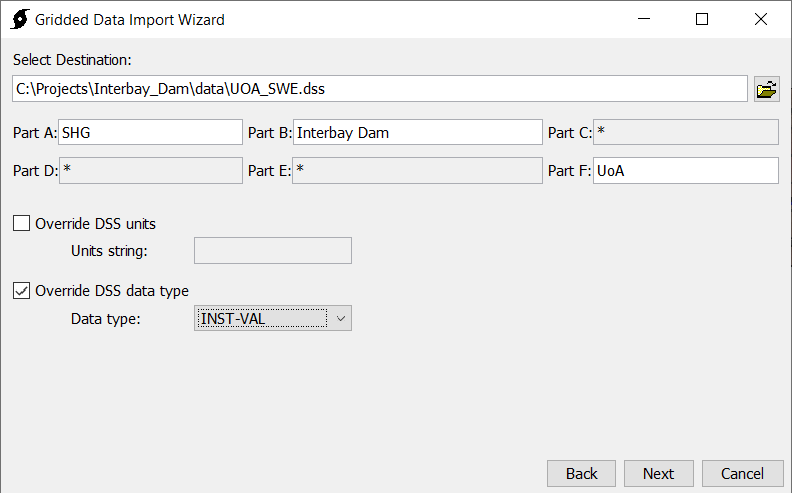
- Choose a location and name for the output DSS file (choose a descriptive name such as UOA_SWE.dss). Make sure to save the file to the Interbay Dam HEC-HMS project's Data folder. Use a descriptive A-part; e.g. "SHG". Use a descriptive B-part; e.g. "Interbay Dam". Use a descriptive F-part; e.g. "UoA". Assume that the DSS Units are correct. Make sure to check the box to Override the DSS data type and select a data type of INST-VAL. Click the Next button. When the wizard shows "Import complete", click the Close button.
- The initial condition grids need to have a start date and time that match the start date and time of the HEC-HMS simulation. The simulation starts on December 27, 1996 at 0600, but the start time for the SWE grids is at 2400 on each day. Open the UOA_SWE.dss file created above with HEC-DSSVue and locate the SWE grid for the time period 26Dec1996: 2400 to 27Dec1996: 2400 (shown below).
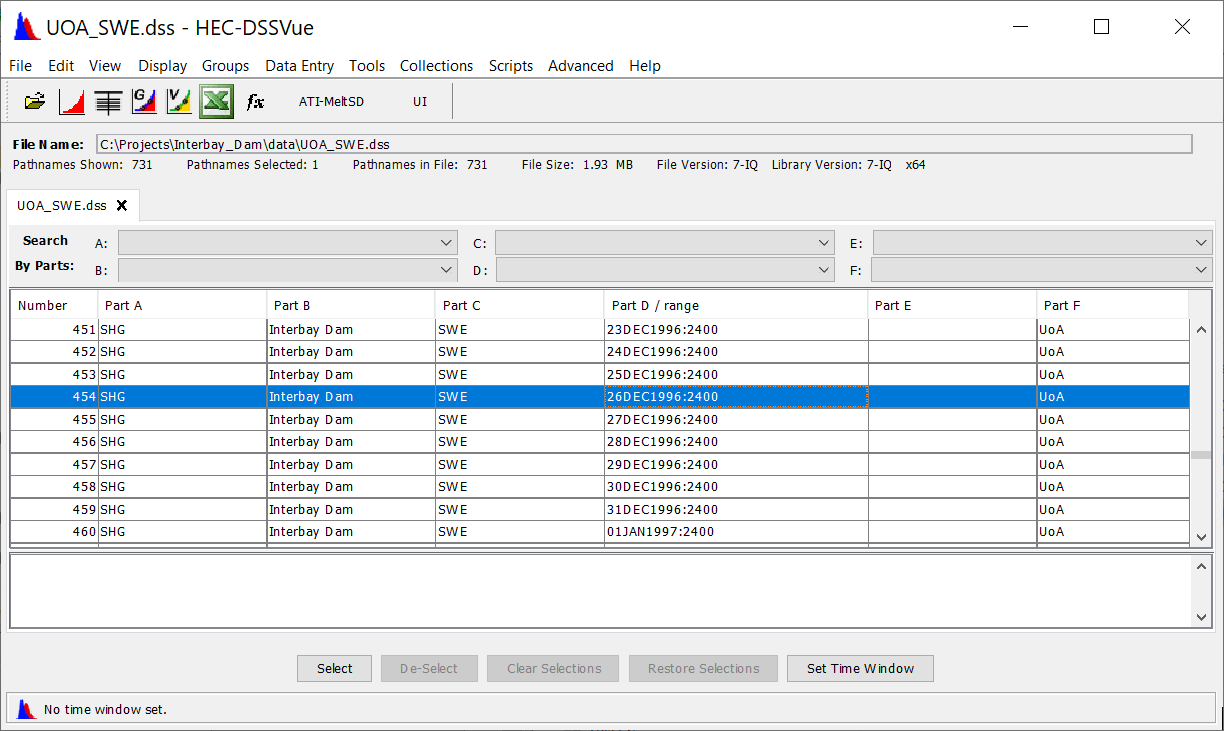
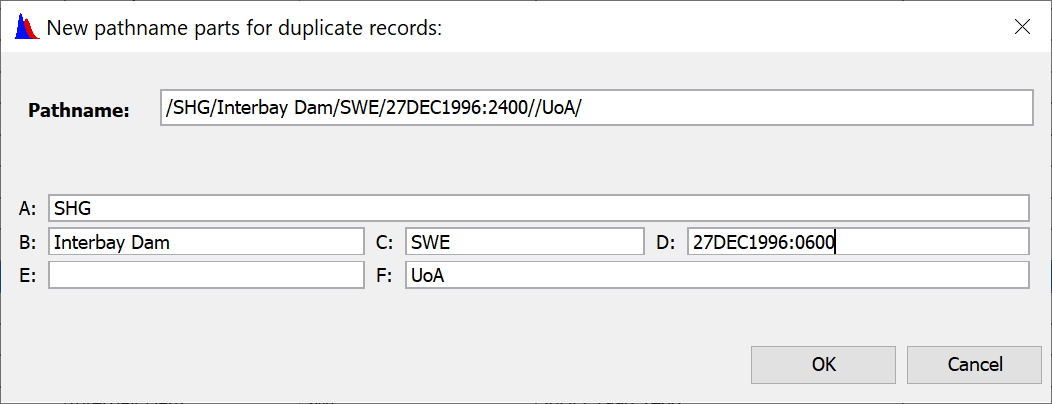
- Select this grid record in the table, click the right mouse button, and select the Duplicate option. As shown below, edit the D part and change it to 27Dec1996:0600. Click the Ok button to save the edit.
The next step is to add a new SWE grid to the Interbay Dam HEC-HMS project and then link it to the DSS file that was created above.
- Open the Grid Data Manager by selecting the Components | Grid Data Manager menu option.
- Make sure the Snow Water Equivalent Grids Data Type is selected and click the New button.
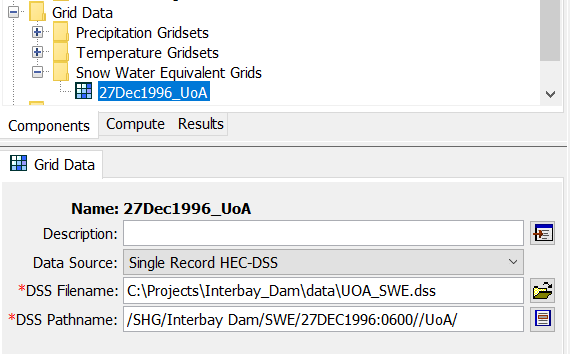
- Enter a name of 27Dec1996_UoA and click the Create button.
- As shown below, open the component editor for the SWE grid and select the correct DSS file and pathname (/SHG/INTERBAY DAM/SWE/27DEC1996:0600//UOA/).
Complete the Meteorologic Model
The meteorologic model GriddedData_1997 has already been created and configured to use Gridded Precipitation and Gridded Temperature. The gridsets need to be assigned to the meteorologic model.
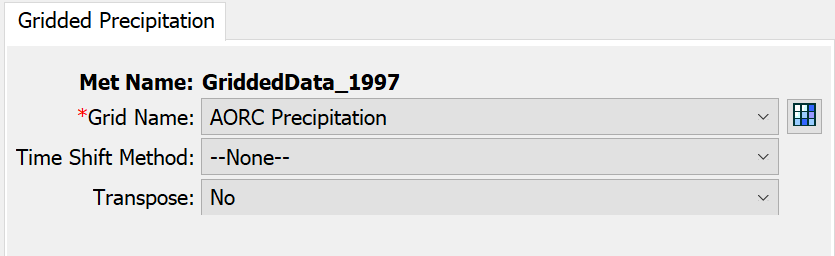
- Click on the Gridded Precipitation node in the meteorologic model to open the Component Editor. Select the AORC Precipitation gridset.
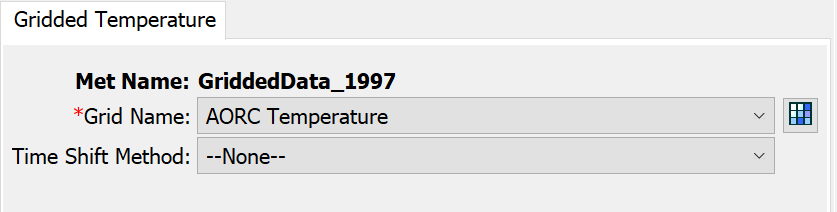
- Click on the Gridded Temperature node in the meteorologic model to open the Component Editor. Select the AORC Temperature gridset.
Complete the Gridded Temperature Index Model
Now that the grids have been added to the HEC-HMS project, the snowmelt model can be configured. The snowmelt models lie within the Basin Model and are configured for each subbasin element.
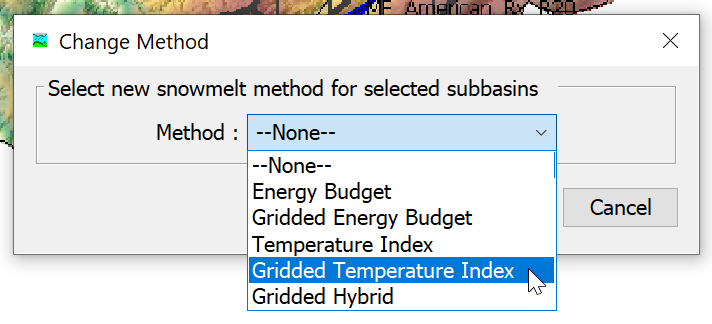
- Select the Dec_1996_Jan_1997 basin model. Select from the menu bar Parameters | Snowmelt | Change Method to assign the Gridded Temperature Index snowmelt method to all subbasins in the basin model. (Rather than change all subbasins at once, the snow methods can also be changed for each subbasin individually from the component editor).
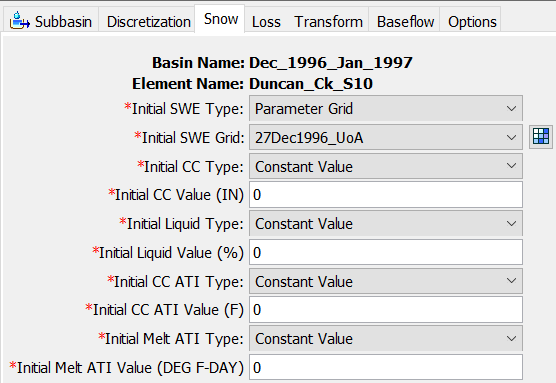
- Select the Duncan_Ck_S10 subbasin element from the watershed explorer and select the Snow tab. This will display the component editor for the Gridded Temperature Index Method for the Duncan_Ck_S10 subbasin.
- Initial conditions need to be set for initial SWE, cold content, liquid water content, cold content ATI, and meltrate ATI. The initial SWE parameter will be assigned to the grid that was previously added to the model. The remaining initial conditions will be initialized using a constant value of zero.
- Assign the initial conditions as shown below.
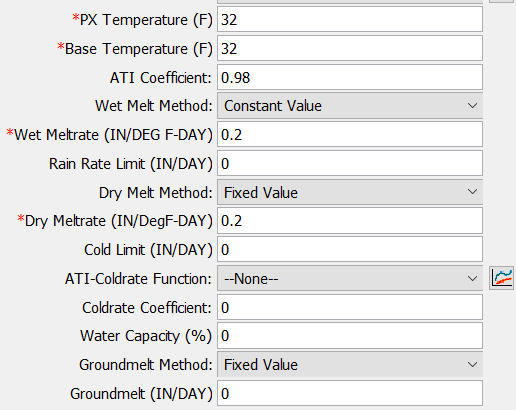
- Set the remaining parameters as shown below.
- The parameters can be more easily set for all subbasins simultaneously using the global parameter editor. Select Parameters | Snowmelt | Gridded Temperature Index from the menu bar. Make sure the Filter is set to None to view all subbasins. Copy the parameters from Duncan_Ck_S10 to the remaining 3 subbasins.
At this point, all gridsets, initial condition grids, and parameter values have been defined for the meteorologic model and gridded temperature index model.
Make Adjustments to Temperature Index Snowmelt Model Parameters when Calibrating to Historical Floods
Only a limited number of Temperature Index parameter are adjusted below. This is due to the fact that a single rain on snow event is simulated. Additional Temperature Index parameters become important when running a simulation that spans a longer duration and multiple rain/snow events.
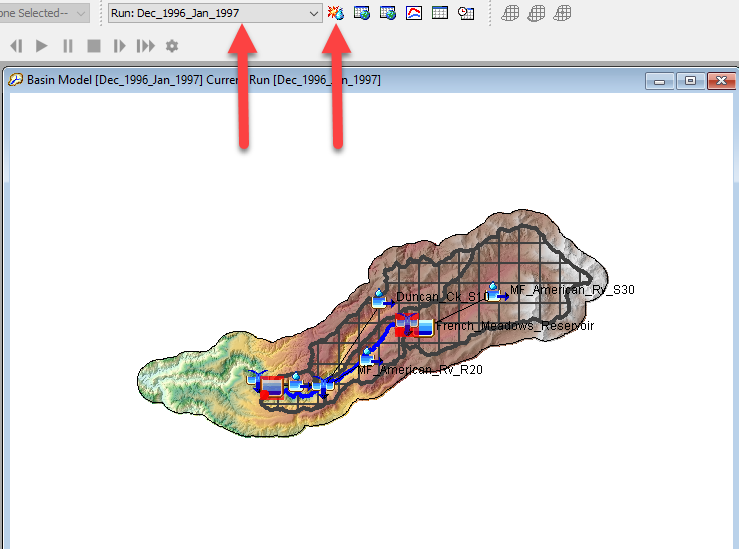
- Select the Dec_1996_Jan_1997 simulation run in the Compute toolbar and click the Compute all elements button to run the simulation.
- Open the results plot for the French_Meadow_Out junction element and open the Snow Water Equivalent results plot for the MF_American_Rv_S30 subbasin element (this is the subbasin element upstream of the French Meadows reservoir element).
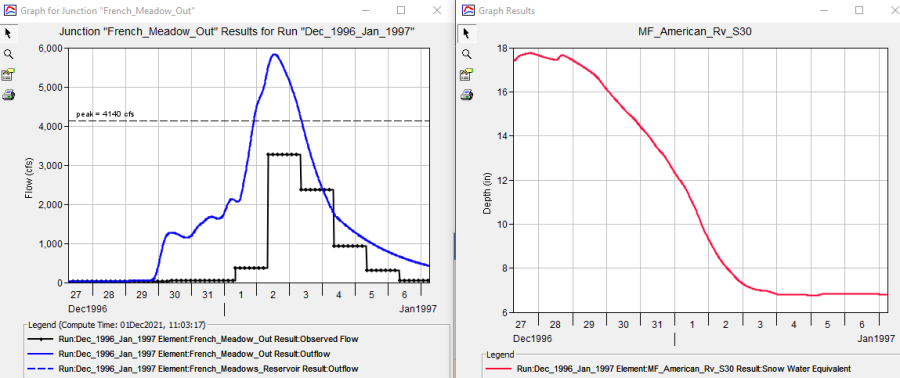
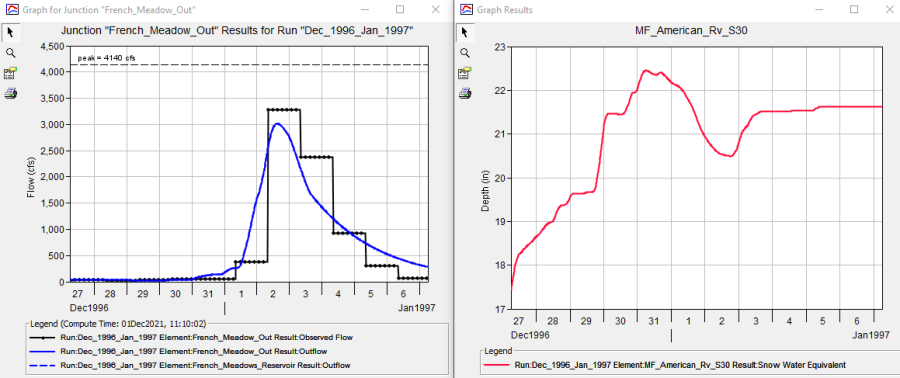
- Notice the simulated hydrograph has a much higher peak flow and volume than the observed data. One way to reduce the runoff from the model is to adjust the snowmelt parameters. Increasing the PX and Base temperatures will reduce runoff as more precipitation will be modeled as snow and not liquid and the snowpack requires higher temperature to initiate melt. The following figure shows the computed results after the PX and Base temperatures were increased to 40 degrees F. 40 degrees F is at the upper end of a reasonable parameter value and is only used to illustrate impacts for these two parameters.
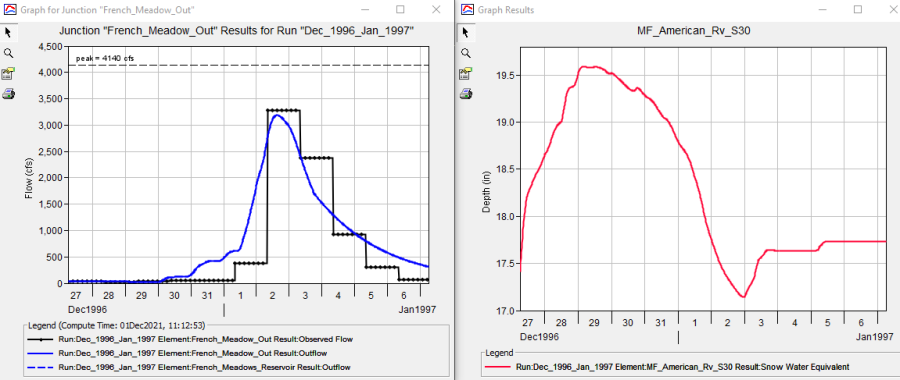
- Another parameter that is impactful for rain on snow events is the wet meltrate. Leave the plots open for the French_Meadows_Out junction and MF_American_RV_S30 subbasin. Change the PX and Base temperatures to 37.5 degrees F. Then change the wet meltrate to 0.1 in/deg F-day. Run the simulation, results should look like those below.
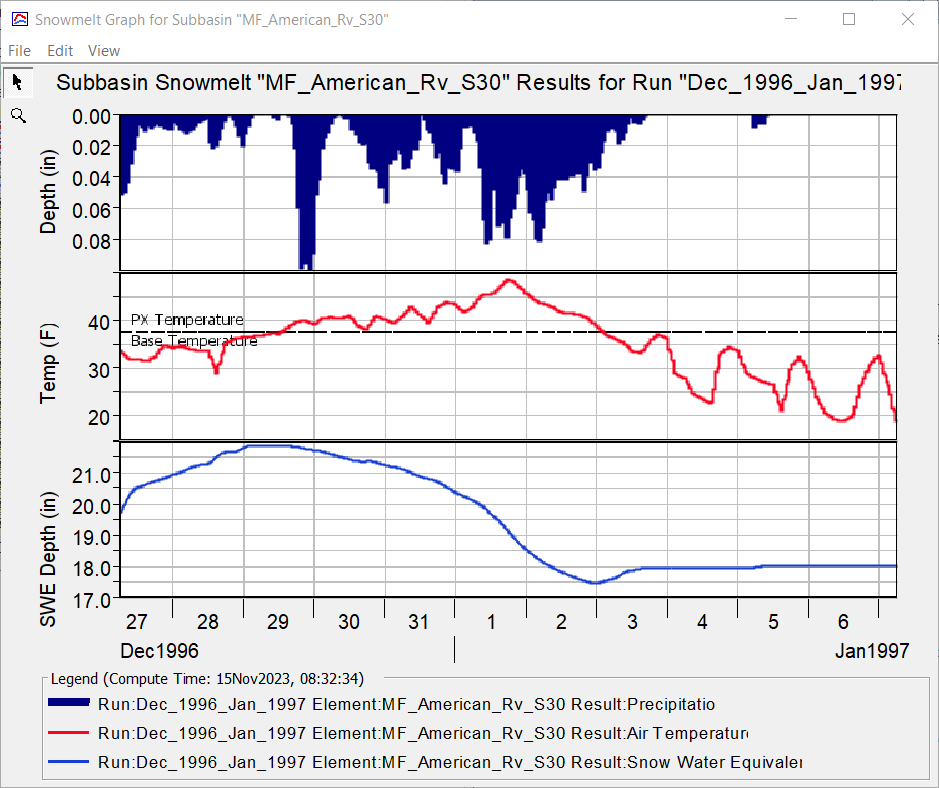
- Experiment with combinations of PX and Base temperature and wet meltrate to calibrate the model. The Snowmelt Graph is another helpful results plot to understand the impacts of the PX and Base temperature on SWE depth. The solution has a PX and Base temperature value of 37.5 degrees F and a wet meltrate of 0.2 in/deg F-day.
Project Files