Download PDF
Download page Rule-Based Reservoir Operations Quick Start Guide.
Rule-Based Reservoir Operations Quick Start Guide
Purpose
The purpose of this guide is to understand all of the new components added to HEC-HMS to make rule-based reservoir operations work. It will help you understand what the inputs for this method are asking for, and how to set up the reservoir model appropriately.
Overview
Rule-based reservoir operations is a new method within the Reservoir element that allows for releases from it to be determined by a set of simple rules. The simulation capabilities are not intended to be as robust as the options contained within HEC-ResSim and are mainly intended to improve longer-term hydrologic simulations where a single storage-outflow curve is insufficient.
This method can be enabled by selecting the "Rule-Based Operations" method on a reservoir element. It sits alongside the other familiar methods, such as Outflow Curve, and Specified Release. It has nearly the same interface as the Outflow Structures method and is based off of it.
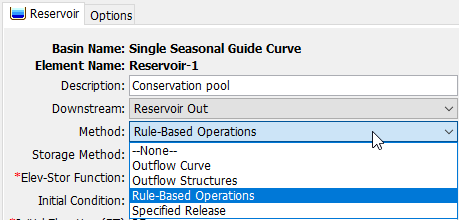
The Rule-Based Operations method is intended to operate moveable gates in order to meet a number of rules. Currently, there is only one operable structure in the Reservoir element, the "General Outlet." Coming soon will be gate controls for the Gated Orifice outlet, and for spillway gates.
General Outlet
The General Outlet was envisioned to be a quick way to input water control manual outlet rating curves and bypassing hydraulic computations. It is parameterized by a pair of rating curves: one for the minimum amount that can be released at each reservoir elevation, and one for the maximum amount. Generally, the minimum rating curve is zero, indicating that the outlet's gates are closed, but in some situations (such as gate leaks) even when the gates are as closed as possible, there is still flow through the outlet. The maximum rating curve corresponds to the amount of flow through the outlet assuming the gates are fully open. HEC-HMS operates a "virtual gate" that sets the gate at a percentage open from 0%-100% by interpolating the release between the curves.
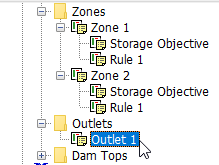
To add a General Outlet, you will add an Outlet using the spinner on the Reservoir Component Editor, and then select the Outlet in the Watershed Explorer tree, and set its method to General Outlet.
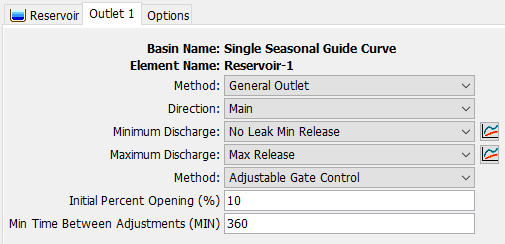
The Minimum Discharge and Maximum Discharge curves are input as Elevation-Discharge Paired Data. Additionally, to allow the Reservoir to control the gate setting, make sure the Adjustable Gate Control method is selected. You will need to specify an initial percent opening, and the minimum amount of time between gate setting changes (in minutes.)
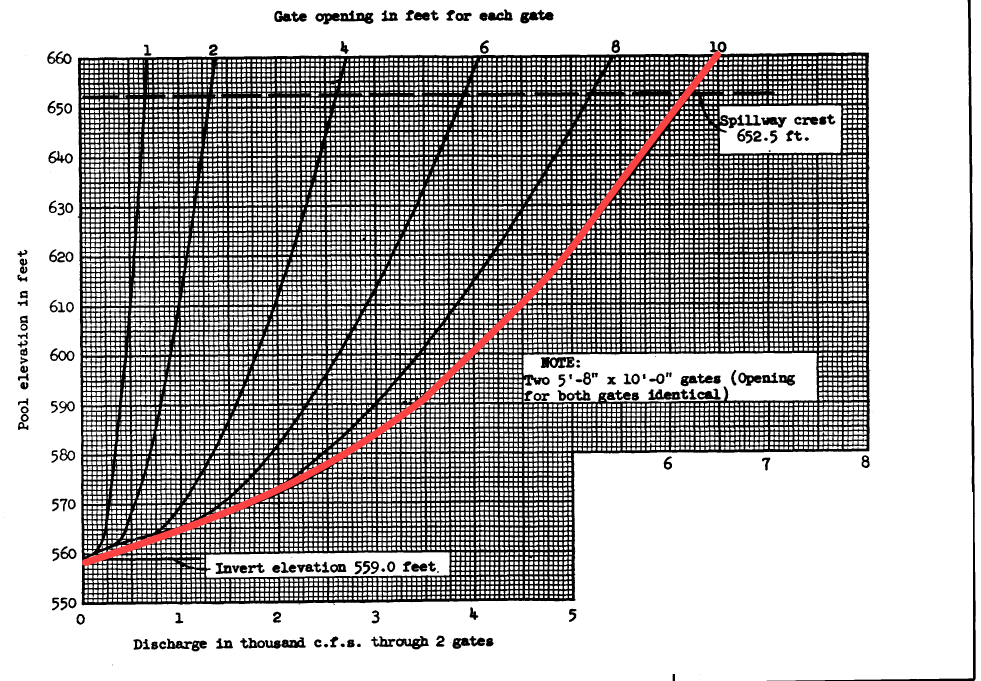
Typically, water control manuals show outlet rating curves for various gate openings. The Minimum Discharge curve is likely to be all zeros except in unusual circumstances. The Maximum Discharge curve will follow the rating for the fully-open gate rating curve, as in the curve highlighted in this figure:
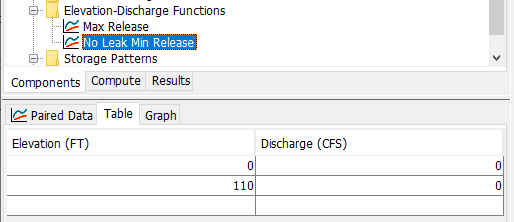
Here is a typical Minimum Discharge curve:
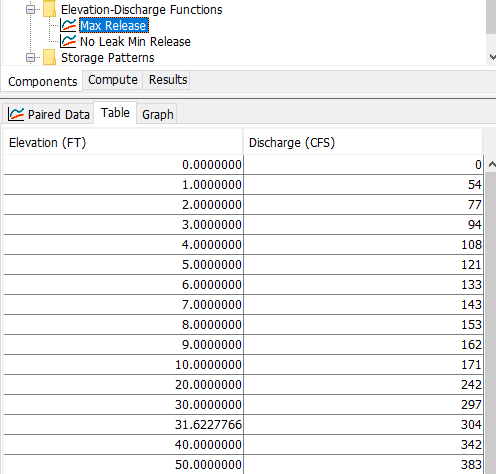
And an example of a Maximum Discharge curve:
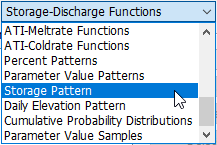
Zones
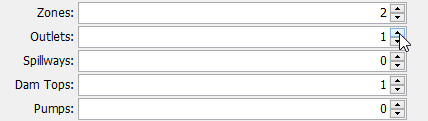
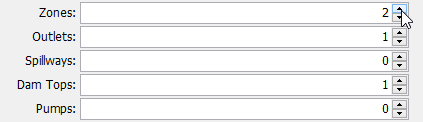
A Zone is defined by the day of the year and the reservoir elevation. Each zone has a single set of rules. You can add a Zone to a Reservoir using Rule-Based Operations by increasing the spinner near where the outflow structures are:
A Reservoir with only one Zone will operate in the exact same manner no matter what day of year it is, and what the reservoir elevation is. Most reservoirs have at least two zones, usually a Conservation Pool and a Flood Control Pool (or other names for the same idea.)
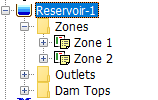
Newly-created Zones can be accessed in the tree beneath the Reservoir element in the Watershed Explorer:
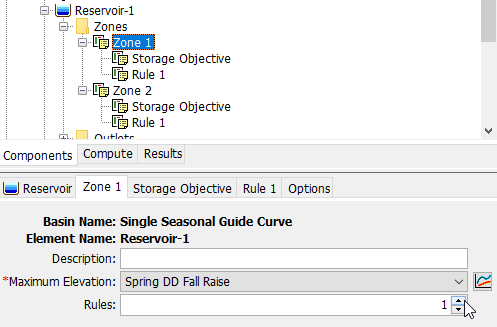
A Zone has two important features: a Maximum Elevation curve, which defines the maximum reservoir elevation for each day of the year when the operations are considered to be within that Zone, and Rules.
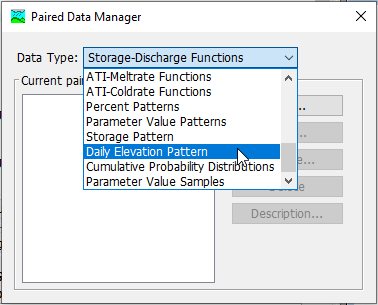
The Maximum Elevation curve is specified using a new type of Paired Data called a Daily Elevation Pattern.
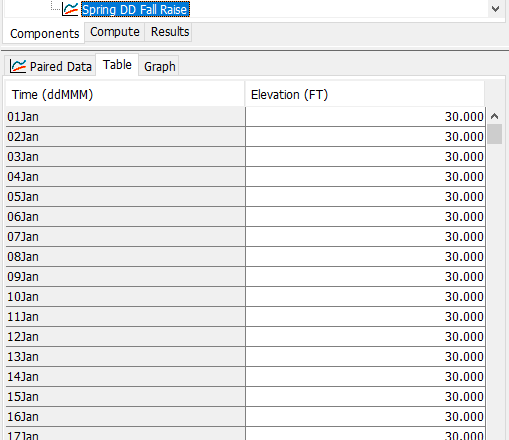
The Daily Elevation Pattern has an entry for each day of the year (01Jan-31Dec.) The elevation specified in the entry is the Top of Zone elevation, which may vary by day of year. If the entry is left blank for a date, then the reservoir will not use that Zone for operations for that date. This is valuable for modeling seasonal rules - for example, a reservoir may always have a conservation pool at 500 ft elevation but during one season have a maximum release of 5,000 cfs, and during another only 2,000 cfs, and this would be achieved by creating two separate zones.
Below is what the entry for the Daily Elevation Pattern looks like:
You will need to ensure that the Daily Elevation Patterns used to define the Top of Zone Elevations are always high enough that it covers the anticipated maximum Reservoir elevations. If the Reservoir elevation gets above the highest Top of Zone elevation, the simulation will abort.
Rules
Every Zone starts out with one rule that cannot be removed: Storage Objective. The rest are added via a spinner on the Zone node of the tree in the Watershed Explorer (note that when the spinner is 1, there is 1 additional rule beyond the storage objective):
Storage Objective
The Storage Objective defines the Reservoir's storage target for a given Zone and day of year. A Storage Objective curve is specified using a new Paired Data type called a Storage Pattern.
A Storage Pattern is interpolated between the points you give it, making it easy to specify things like gradual drawdowns or raises using only a few points. Below is an example of how a Storage Pattern would be defined. This one has abrupt transitions between drawdown and raise periods instead of gradual transitions:
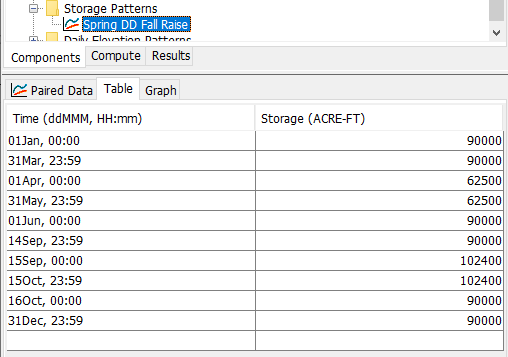
For many reservoirs, there is a single Storage Objective - throughout the year there is only one desired storage level for each day of year. When this happens, the same Storage Pattern can be used for every Zone. In more complicated scenarios, different Zones may have different Storage Objectives and the user is allowed to use different curves.
Custom Rules
First and foremost, you should keep the rule set that you use as simple as possible for the modeling objective. If you have complicated reservoir modeling needs, then you should be using HEC-ResSim. Also, avoid supplying conflicting rules, or rules that cannot possibly be followed when combined (for example a minimum main release greater than a maximum main release.) This will result in nonsensical simulation results. All downstream flow rules cause the model to iterate by varying the gate setting and routing the flow until the objective is met. Keeping this in mind, you should minimize the number of downstream control rules you include in your model, even if the water control manual specifies multiple downstream controls. Otherwise, your runtimes may be prohibitively long.
There are 11 rule types you can specify for each Zone:
| Rule Name | Usage | Important Notes |
|---|---|---|
| --None-- | Does not actually apply a rule. Generally don't use this. | |
| Maximum Auxiliary Release | If you have specified any outlet structures to use a reservoir auxiliary, this controls the maximum amount that may be released in that direction. | Do not use this if you do not have releases in an auxiliary direction. |
| Maximum Downstream Flow | Maximum allowed flow at an element downstream of the reservoir that you choose. | This will cause the model to iterate and has the potential to drastically increase runtimes. |
| Maximum Main Release | This controls the maximum amount of flow that may be released in the main release direction. | |
| Maximum Rate Flow Change | Each time a gate change is made, this is the maximum amount the release is allowed to change. | This can be used to smooth out jagged or oscillating releases as well. |
| Minimum Auxiliary Release | If you have specified any outlet structures to use a reservoir auxiliary, this controls the minimum amount that may be released in that direction. | Do not use this if you do not have releases in an auxiliary direction. |
| Minimum Downstream Flow | Minimum allowed flow at an element downstream of the reservoir that you choose. | This will cause the model to iterate and has the potential to drastically increase runtimes. |
| Minimum Main Release | This controls the minimum amount of flow that may be released in the main release direction. | |
| Specified Auxiliary Release | If you have specified any outlet structures to use a reservoir auxiliary, the reservoir will operate to release a specified amount in that direction. | Do not use this if you do not have releases in an auxiliary direction. |
| Specified Downstream Flow | Specified target flow at an element downstream of the reservoir that you choose. | This will cause the model to iterate and has the potential to drastically increase runtimes. |
| Specified Main Release | The reservoir will operate to release a specified flow in the main direction. |
Simple Model Example
Overview
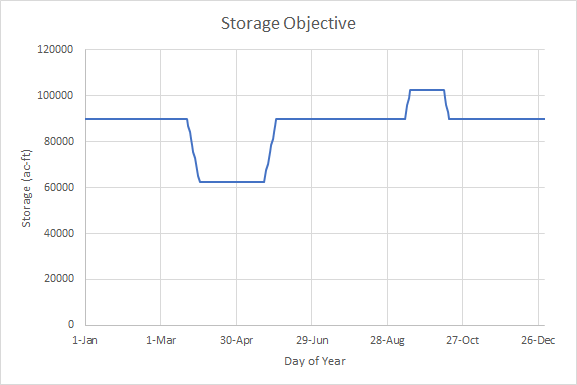
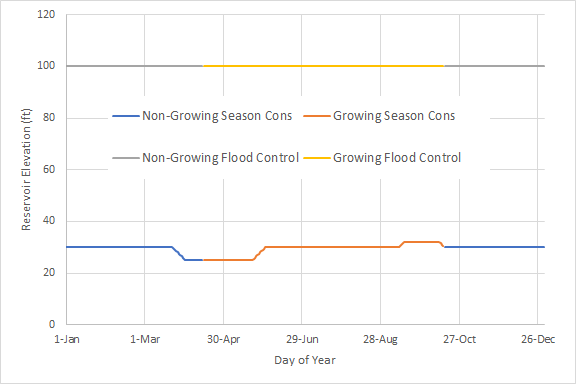
Below is an example of a completely contrived simple reservoir that attempts to maintain a conservation pool that has a spring drawdown and a fall raise. It holds 90 KAF at normal conservation pool. Beginning 23 March, the reservoir draws down by 0.5 ft day-1 from 30 ft to 25 ft to make room for spring snowmelt, and gradually fills back to 30 ft by 01 June to provide low-flow augmentation in the summertime. In the fall, the pool is raised from 30 ft to 32 ft to increase the pool surface area for migrating waterfowl. The operator drives up to the dam site to make gate changes once a day.
While in conservation pool, the reservoir releases a minimum of 100 cfs to meet minimum in-stream flow requirements. Flows are limited to to 200 cfs during the non-growing season and 175 cfs during the growing season to reduce impacts to sub-marginal cropland in the floodplain downstream of the dam. It is limited to a maximum rate of change of 25 cfs per gate change to reduce erosion.
When the reservoir is in the flood pool (above conservation pool), the reservoir is allowed to release up to bankfull capacity (300 cfs) during the non-growing season, but only 250 cfs during the growing season. It is limited to a maximum rate of change of 50 cfs per gate change.
It has two seasons, limiting releases during the growing season to less flow than in the non-growing season. Above the storage objective the Reservoir is considered to be in "flood control." To achieve seasonal operations, four Zones are used.
The reservoir has a single outlet, and a 250-foot long dam top at 80 ft elevation. The top of the flood control zone is defined well above the top of dam so zones cover the situation where the dam is overtopping. We will use the General Outlet to match the rating curves in a (hypothetical) water control manual.
Example
First, create a Storage Pattern Paired Data curve. This curve defines the reservoir storage the operator tries to maintain throughout the year. Note that this data type does not need a value for every day - HMS will interpolate between the supplied values.
| Date | Storage (ac-ft) |
|---|---|
| 01Jan 00:00 | 90000 |
| 22Mar 00:00 | 90000 |
| 23Mar 00:00 | 87025 |
| 24Mar 00:00 | 84100 |
| 25Mar 00:00 | 81225 |
| 26Mar 00:00 | 78400 |
| 27Mar 00:00 | 75625 |
| 28Mar 00:00 | 72900 |
| 29Mar 00:00 | 70225 |
| 30Mar 00:00 | 67600 |
| 31Mar 00:00 | 65025 |
| 01Apr 00:00 | 62500 |
| 22May 00:00 | 62500 |
| 23May 00:00 | 65025 |
| 24May 00:00 | 67600 |
| 25May 00:00 | 70225 |
| 26May 00:00 | 72900 |
| 27May 00:00 | 75625 |
| 28May 00:00 | 78400 |
| 29May 00:00 | 81225 |
| 30May 00:00 | 84100 |
| 31May 00:00 | 87025 |
| 01Jun 00:00 | 90000 |
| 11Sep 00:00 | 90000 |
| 12Sep 00:00 | 93025 |
| 13Sep 00:00 | 96100 |
| 14Sep 00:00 | 99225 |
| 15Sep 00:00 | 102400 |
| 12Oct 00:00 | 102400 |
| 13Oct 00:00 | 99225 |
| 14Oct 00:00 | 96100 |
| 15Oct 00:00 | 93025 |
| 16Oct 00:00 | 90000 |
| 31Dec 23:59 | 90000 |
Next, create a reservoir element and set its method to Rule-Based Operations. Use the spinners in the Component Editor to create 4 zones, 1 outlet, and 1 dam top. Set its storage method to Elevation-Storage. Create an Elevation-Storage Paired Data curve with the following table:
| Elevation (ft) | Storage (ac-ft) |
|---|---|
| 0 | 0 |
| 1 | 100 |
| 2 | 400 |
| 3 | 900 |
| 4 | 1600 |
| 5 | 2500 |
| 6 | 3600 |
| 7 | 4900 |
| 8 | 6400 |
| 9 | 8100 |
| 10 | 10000 |
| 20 | 40000 |
| 30 | 90000 |
| 40 | 160000 |
| 50 | 250000 |
| 60 | 360000 |
| 70 | 490000 |
| 80 | 640000 |
| 90 | 810000 |
| 100 | 1000000 |
Set the reservoir's Elevation-Storage table to the one you just created, then set the reservoir's initial condition to Elevation, and set it to 25 ft.
Configure the dam top so that it uses the Level Overflow method, set its elevation to 80 ft, its length to 250 ft, and its coefficient to 3. This dam has no spillway but is designed to overtop.
Configure the outlet so that it uses the General Outlet method. Set its direction to Main and method to Adjustable Gate Control. Set the initial percent open to 33% and the min time between adjustments to 1440 minutes (1 day.) The outlet requires two paired data curves that define releases for the gate completely closed (0% open) and completely open (100% open.) The minimum curve usually contains two points - one at the invert elevation of the outlet, and one well above the top elevation you expect the reservoir to reach during simulation, both with zero outflow. Create two Elevation-Discharge Paired Data curves, one for the minimum and one for the maximum discharge. The tables below supply a zero-flow minimum curve and fully-open gate rating curve. The outlet invert is at 0 ft.
| Elevation (ft) | Discharge (cfs) |
|---|---|
| 0 | 0 |
| 100 | 0 |
| Elevation (ft) | Discharge (cfs) |
|---|---|
| 0 | 0 |
| 1 | 54 |
| 2 | 77 |
| 3 | 94 |
| 4 | 108 |
| 5 | 121 |
| 6 | 133 |
| 7 | 143 |
| 8 | 153 |
| 9 | 162 |
| 10 | 171 |
| 20 | 242 |
| 30 | 297 |
| 40 | 342 |
| 50 | 383 |
| 60 | 419 |
| 70 | 453 |
| 80 | 484 |
| 90 | 514 |
| 100 | 541 |
Zone 1
Configure the first zone to cover the non-growing season conservation pool. Use the spinner to set it to have three rules (the storage objective is automatic.) Create a new Daily Elevation Pattern Paired Data curve and call it "NG Conservation". The pattern is in the table below. Note that these patterns require a value for every day but may be blank. If the pattern is blank, it means that this zone is inactive for that day of the year.
| Date | Elevation (ft) |
|---|---|
| 1-Jan | 30 |
| 2-Jan | 30 |
| 3-Jan | 30 |
| 4-Jan | 30 |
| 5-Jan | 30 |
| 6-Jan | 30 |
| 7-Jan | 30 |
| 8-Jan | 30 |
| 9-Jan | 30 |
| 10-Jan | 30 |
| 11-Jan | 30 |
| 12-Jan | 30 |
| 13-Jan | 30 |
| 14-Jan | 30 |
| 15-Jan | 30 |
| 16-Jan | 30 |
| 17-Jan | 30 |
| 18-Jan | 30 |
| 19-Jan | 30 |
| 20-Jan | 30 |
| 21-Jan | 30 |
| 22-Jan | 30 |
| 23-Jan | 30 |
| 24-Jan | 30 |
| 25-Jan | 30 |
| 26-Jan | 30 |
| 27-Jan | 30 |
| 28-Jan | 30 |
| 29-Jan | 30 |
| 30-Jan | 30 |
| 31-Jan | 30 |
| 1-Feb | 30 |
| 2-Feb | 30 |
| 3-Feb | 30 |
| 4-Feb | 30 |
| 5-Feb | 30 |
| 6-Feb | 30 |
| 7-Feb | 30 |
| 8-Feb | 30 |
| 9-Feb | 30 |
| 10-Feb | 30 |
| 11-Feb | 30 |
| 12-Feb | 30 |
| 13-Feb | 30 |
| 14-Feb | 30 |
| 15-Feb | 30 |
| 16-Feb | 30 |
| 17-Feb | 30 |
| 18-Feb | 30 |
| 19-Feb | 30 |
| 20-Feb | 30 |
| 21-Feb | 30 |
| 22-Feb | 30 |
| 23-Feb | 30 |
| 24-Feb | 30 |
| 25-Feb | 30 |
| 26-Feb | 30 |
| 27-Feb | 30 |
| 28-Feb | 30 |
| 29-Feb | 30 |
| 1-Mar | 30 |
| 2-Mar | 30 |
| 3-Mar | 30 |
| 4-Mar | 30 |
| 5-Mar | 30 |
| 6-Mar | 30 |
| 7-Mar | 30 |
| 8-Mar | 30 |
| 9-Mar | 30 |
| 10-Mar | 30 |
| 11-Mar | 30 |
| 12-Mar | 30 |
| 13-Mar | 30 |
| 14-Mar | 30 |
| 15-Mar | 30 |
| 16-Mar | 30 |
| 17-Mar | 30 |
| 18-Mar | 30 |
| 19-Mar | 30 |
| 20-Mar | 30 |
| 21-Mar | 30 |
| 22-Mar | 30 |
| 23-Mar | 29.5 |
| 24-Mar | 29 |
| 25-Mar | 28.5 |
| 26-Mar | 28 |
| 27-Mar | 27.5 |
| 28-Mar | 27 |
| 29-Mar | 26.5 |
| 30-Mar | 26 |
| 31-Mar | 25.5 |
| 1-Apr | 25 |
| 2-Apr | 25 |
| 3-Apr | 25 |
| 4-Apr | 25 |
| 5-Apr | 25 |
| 6-Apr | 25 |
| 7-Apr | 25 |
| 8-Apr | 25 |
| 9-Apr | 25 |
| 10-Apr | 25 |
| 11-Apr | 25 |
| 12-Apr | 25 |
| 13-Apr | 25 |
| 14-Apr | 25 |
| 15-Apr | |
| 16-Apr | |
| 17-Apr | |
| 18-Apr | |
| 19-Apr | |
| 20-Apr | |
| 21-Apr | |
| 22-Apr | |
| 23-Apr | |
| 24-Apr | |
| 25-Apr | |
| 26-Apr | |
| 27-Apr | |
| 28-Apr | |
| 29-Apr | |
| 30-Apr | |
| 1-May | |
| 2-May | |
| 3-May | |
| 4-May | |
| 5-May | |
| 6-May | |
| 7-May | |
| 8-May | |
| 9-May | |
| 10-May | |
| 11-May | |
| 12-May | |
| 13-May | |
| 14-May | |
| 15-May | |
| 16-May | |
| 17-May | |
| 18-May | |
| 19-May | |
| 20-May | |
| 21-May | |
| 22-May | |
| 23-May | |
| 24-May | |
| 25-May | |
| 26-May | |
| 27-May | |
| 28-May | |
| 29-May | |
| 30-May | |
| 31-May | |
| 1-Jun | |
| 2-Jun | |
| 3-Jun | |
| 4-Jun | |
| 5-Jun | |
| 6-Jun | |
| 7-Jun | |
| 8-Jun | |
| 9-Jun | |
| 10-Jun | |
| 11-Jun | |
| 12-Jun | |
| 13-Jun | |
| 14-Jun | |
| 15-Jun | |
| 16-Jun | |
| 17-Jun | |
| 18-Jun | |
| 19-Jun | |
| 20-Jun | |
| 21-Jun | |
| 22-Jun | |
| 23-Jun | |
| 24-Jun | |
| 25-Jun | |
| 26-Jun | |
| 27-Jun | |
| 28-Jun | |
| 29-Jun | |
| 30-Jun | |
| 1-Jul | |
| 2-Jul | |
| 3-Jul | |
| 4-Jul | |
| 5-Jul | |
| 6-Jul | |
| 7-Jul | |
| 8-Jul | |
| 9-Jul | |
| 10-Jul | |
| 11-Jul | |
| 12-Jul | |
| 13-Jul | |
| 14-Jul | |
| 15-Jul | |
| 16-Jul | |
| 17-Jul | |
| 18-Jul | |
| 19-Jul | |
| 20-Jul | |
| 21-Jul | |
| 22-Jul | |
| 23-Jul | |
| 24-Jul | |
| 25-Jul | |
| 26-Jul | |
| 27-Jul | |
| 28-Jul | |
| 29-Jul | |
| 30-Jul | |
| 31-Jul | |
| 1-Aug | |
| 2-Aug | |
| 3-Aug | |
| 4-Aug | |
| 5-Aug | |
| 6-Aug | |
| 7-Aug | |
| 8-Aug | |
| 9-Aug | |
| 10-Aug | |
| 11-Aug | |
| 12-Aug | |
| 13-Aug | |
| 14-Aug | |
| 15-Aug | |
| 16-Aug | |
| 17-Aug | |
| 18-Aug | |
| 19-Aug | |
| 20-Aug | |
| 21-Aug | |
| 22-Aug | |
| 23-Aug | |
| 24-Aug | |
| 25-Aug | |
| 26-Aug | |
| 27-Aug | |
| 28-Aug | |
| 29-Aug | |
| 30-Aug | |
| 31-Aug | |
| 1-Sep | |
| 2-Sep | |
| 3-Sep | |
| 4-Sep | |
| 5-Sep | |
| 6-Sep | |
| 7-Sep | |
| 8-Sep | |
| 9-Sep | |
| 10-Sep | |
| 11-Sep | |
| 12-Sep | |
| 13-Sep | |
| 14-Sep | |
| 15-Sep | |
| 16-Sep | |
| 17-Sep | |
| 18-Sep | |
| 19-Sep | |
| 20-Sep | |
| 21-Sep | |
| 22-Sep | |
| 23-Sep | |
| 24-Sep | |
| 25-Sep | |
| 26-Sep | |
| 27-Sep | |
| 28-Sep | |
| 29-Sep | |
| 30-Sep | |
| 1-Oct | |
| 2-Oct | |
| 3-Oct | |
| 4-Oct | |
| 5-Oct | |
| 6-Oct | |
| 7-Oct | |
| 8-Oct | |
| 9-Oct | |
| 10-Oct | |
| 11-Oct | |
| 12-Oct | |
| 13-Oct | |
| 14-Oct | |
| 15-Oct | |
| 16-Oct | 30 |
| 17-Oct | 30 |
| 18-Oct | 30 |
| 19-Oct | 30 |
| 20-Oct | 30 |
| 21-Oct | 30 |
| 22-Oct | 30 |
| 23-Oct | 30 |
| 24-Oct | 30 |
| 25-Oct | 30 |
| 26-Oct | 30 |
| 27-Oct | 30 |
| 28-Oct | 30 |
| 29-Oct | 30 |
| 30-Oct | 30 |
| 31-Oct | 30 |
| 1-Nov | 30 |
| 2-Nov | 30 |
| 3-Nov | 30 |
| 4-Nov | 30 |
| 5-Nov | 30 |
| 6-Nov | 30 |
| 7-Nov | 30 |
| 8-Nov | 30 |
| 9-Nov | 30 |
| 10-Nov | 30 |
| 11-Nov | 30 |
| 12-Nov | 30 |
| 13-Nov | 30 |
| 14-Nov | 30 |
| 15-Nov | 30 |
| 16-Nov | 30 |
| 17-Nov | 30 |
| 18-Nov | 30 |
| 19-Nov | 30 |
| 20-Nov | 30 |
| 21-Nov | 30 |
| 22-Nov | 30 |
| 23-Nov | 30 |
| 24-Nov | 30 |
| 25-Nov | 30 |
| 26-Nov | 30 |
| 27-Nov | 30 |
| 28-Nov | 30 |
| 29-Nov | 30 |
| 30-Nov | 30 |
| 1-Dec | 30 |
| 2-Dec | 30 |
| 3-Dec | 30 |
| 4-Dec | 30 |
| 5-Dec | 30 |
| 6-Dec | 30 |
| 7-Dec | 30 |
| 8-Dec | 30 |
| 9-Dec | 30 |
| 10-Dec | 30 |
| 11-Dec | 30 |
| 12-Dec | 30 |
| 13-Dec | 30 |
| 14-Dec | 30 |
| 15-Dec | 30 |
| 16-Dec | 30 |
| 17-Dec | 30 |
| 18-Dec | 30 |
| 19-Dec | 30 |
| 20-Dec | 30 |
| 21-Dec | 30 |
| 22-Dec | 30 |
| 23-Dec | 30 |
| 24-Dec | 30 |
| 25-Dec | 30 |
| 26-Dec | 30 |
| 27-Dec | 30 |
| 28-Dec | 30 |
| 29-Dec | 30 |
| 30-Dec | 30 |
| 31-Dec | 30 |
Set the storage objective to the Storage Pattern you created at the beginning. For the first rule, set it as a Minimum Main Release of 100 cfs. Second rule, Maximum Main Release of 200 cfs. Third rule, Maximum Rate Flow Change of 25 cfs.
Zone 2
Configure the second zone to cover the growing season conservation pool. Use the spinner to set it to have three rules (the storage objective is automatic.) Create a new Daily Elevation Pattern Paired Data curve and call it "G Conservation". The pattern is in the table below.
| Date | Elevation (ft) |
|---|---|
| 1-Jan | |
| 2-Jan | |
| 3-Jan | |
| 4-Jan | |
| 5-Jan | |
| 6-Jan | |
| 7-Jan | |
| 8-Jan | |
| 9-Jan | |
| 10-Jan | |
| 11-Jan | |
| 12-Jan | |
| 13-Jan | |
| 14-Jan | |
| 15-Jan | |
| 16-Jan | |
| 17-Jan | |
| 18-Jan | |
| 19-Jan | |
| 20-Jan | |
| 21-Jan | |
| 22-Jan | |
| 23-Jan | |
| 24-Jan | |
| 25-Jan | |
| 26-Jan | |
| 27-Jan | |
| 28-Jan | |
| 29-Jan | |
| 30-Jan | |
| 31-Jan | |
| 1-Feb | |
| 2-Feb | |
| 3-Feb | |
| 4-Feb | |
| 5-Feb | |
| 6-Feb | |
| 7-Feb | |
| 8-Feb | |
| 9-Feb | |
| 10-Feb | |
| 11-Feb | |
| 12-Feb | |
| 13-Feb | |
| 14-Feb | |
| 15-Feb | |
| 16-Feb | |
| 17-Feb | |
| 18-Feb | |
| 19-Feb | |
| 20-Feb | |
| 21-Feb | |
| 22-Feb | |
| 23-Feb | |
| 24-Feb | |
| 25-Feb | |
| 26-Feb | |
| 27-Feb | |
| 28-Feb | |
| 29-Feb | |
| 1-Mar | |
| 2-Mar | |
| 3-Mar | |
| 4-Mar | |
| 5-Mar | |
| 6-Mar | |
| 7-Mar | |
| 8-Mar | |
| 9-Mar | |
| 10-Mar | |
| 11-Mar | |
| 12-Mar | |
| 13-Mar | |
| 14-Mar | |
| 15-Mar | |
| 16-Mar | |
| 17-Mar | |
| 18-Mar | |
| 19-Mar | |
| 20-Mar | |
| 21-Mar | |
| 22-Mar | |
| 23-Mar | |
| 24-Mar | |
| 25-Mar | |
| 26-Mar | |
| 27-Mar | |
| 28-Mar | |
| 29-Mar | |
| 30-Mar | |
| 31-Mar | |
| 1-Apr | |
| 2-Apr | |
| 3-Apr | |
| 4-Apr | |
| 5-Apr | |
| 6-Apr | |
| 7-Apr | |
| 8-Apr | |
| 9-Apr | |
| 10-Apr | |
| 11-Apr | |
| 12-Apr | |
| 13-Apr | |
| 14-Apr | |
| 15-Apr | 25 |
| 16-Apr | 25 |
| 17-Apr | 25 |
| 18-Apr | 25 |
| 19-Apr | 25 |
| 20-Apr | 25 |
| 21-Apr | 25 |
| 22-Apr | 25 |
| 23-Apr | 25 |
| 24-Apr | 25 |
| 25-Apr | 25 |
| 26-Apr | 25 |
| 27-Apr | 25 |
| 28-Apr | 25 |
| 29-Apr | 25 |
| 30-Apr | 25 |
| 1-May | 25 |
| 2-May | 25 |
| 3-May | 25 |
| 4-May | 25 |
| 5-May | 25 |
| 6-May | 25 |
| 7-May | 25 |
| 8-May | 25 |
| 9-May | 25 |
| 10-May | 25 |
| 11-May | 25 |
| 12-May | 25 |
| 13-May | 25 |
| 14-May | 25 |
| 15-May | 25 |
| 16-May | 25 |
| 17-May | 25 |
| 18-May | 25 |
| 19-May | 25 |
| 20-May | 25 |
| 21-May | 25 |
| 22-May | 25 |
| 23-May | 25.5 |
| 24-May | 26 |
| 25-May | 26.5 |
| 26-May | 27 |
| 27-May | 27.5 |
| 28-May | 28 |
| 29-May | 28.5 |
| 30-May | 29 |
| 31-May | 29.5 |
| 1-Jun | 30 |
| 2-Jun | 30 |
| 3-Jun | 30 |
| 4-Jun | 30 |
| 5-Jun | 30 |
| 6-Jun | 30 |
| 7-Jun | 30 |
| 8-Jun | 30 |
| 9-Jun | 30 |
| 10-Jun | 30 |
| 11-Jun | 30 |
| 12-Jun | 30 |
| 13-Jun | 30 |
| 14-Jun | 30 |
| 15-Jun | 30 |
| 16-Jun | 30 |
| 17-Jun | 30 |
| 18-Jun | 30 |
| 19-Jun | 30 |
| 20-Jun | 30 |
| 21-Jun | 30 |
| 22-Jun | 30 |
| 23-Jun | 30 |
| 24-Jun | 30 |
| 25-Jun | 30 |
| 26-Jun | 30 |
| 27-Jun | 30 |
| 28-Jun | 30 |
| 29-Jun | 30 |
| 30-Jun | 30 |
| 1-Jul | 30 |
| 2-Jul | 30 |
| 3-Jul | 30 |
| 4-Jul | 30 |
| 5-Jul | 30 |
| 6-Jul | 30 |
| 7-Jul | 30 |
| 8-Jul | 30 |
| 9-Jul | 30 |
| 10-Jul | 30 |
| 11-Jul | 30 |
| 12-Jul | 30 |
| 13-Jul | 30 |
| 14-Jul | 30 |
| 15-Jul | 30 |
| 16-Jul | 30 |
| 17-Jul | 30 |
| 18-Jul | 30 |
| 19-Jul | 30 |
| 20-Jul | 30 |
| 21-Jul | 30 |
| 22-Jul | 30 |
| 23-Jul | 30 |
| 24-Jul | 30 |
| 25-Jul | 30 |
| 26-Jul | 30 |
| 27-Jul | 30 |
| 28-Jul | 30 |
| 29-Jul | 30 |
| 30-Jul | 30 |
| 31-Jul | 30 |
| 1-Aug | 30 |
| 2-Aug | 30 |
| 3-Aug | 30 |
| 4-Aug | 30 |
| 5-Aug | 30 |
| 6-Aug | 30 |
| 7-Aug | 30 |
| 8-Aug | 30 |
| 9-Aug | 30 |
| 10-Aug | 30 |
| 11-Aug | 30 |
| 12-Aug | 30 |
| 13-Aug | 30 |
| 14-Aug | 30 |
| 15-Aug | 30 |
| 16-Aug | 30 |
| 17-Aug | 30 |
| 18-Aug | 30 |
| 19-Aug | 30 |
| 20-Aug | 30 |
| 21-Aug | 30 |
| 22-Aug | 30 |
| 23-Aug | 30 |
| 24-Aug | 30 |
| 25-Aug | 30 |
| 26-Aug | 30 |
| 27-Aug | 30 |
| 28-Aug | 30 |
| 29-Aug | 30 |
| 30-Aug | 30 |
| 31-Aug | 30 |
| 1-Sep | 30 |
| 2-Sep | 30 |
| 3-Sep | 30 |
| 4-Sep | 30 |
| 5-Sep | 30 |
| 6-Sep | 30 |
| 7-Sep | 30 |
| 8-Sep | 30 |
| 9-Sep | 30 |
| 10-Sep | 30 |
| 11-Sep | 30 |
| 12-Sep | 30.5 |
| 13-Sep | 31 |
| 14-Sep | 31.5 |
| 15-Sep | 32 |
| 16-Sep | 32 |
| 17-Sep | 32 |
| 18-Sep | 32 |
| 19-Sep | 32 |
| 20-Sep | 32 |
| 21-Sep | 32 |
| 22-Sep | 32 |
| 23-Sep | 32 |
| 24-Sep | 32 |
| 25-Sep | 32 |
| 26-Sep | 32 |
| 27-Sep | 32 |
| 28-Sep | 32 |
| 29-Sep | 32 |
| 30-Sep | 32 |
| 1-Oct | 32 |
| 2-Oct | 32 |
| 3-Oct | 32 |
| 4-Oct | 32 |
| 5-Oct | 32 |
| 6-Oct | 32 |
| 7-Oct | 32 |
| 8-Oct | 32 |
| 9-Oct | 32 |
| 10-Oct | 32 |
| 11-Oct | 32 |
| 12-Oct | 32 |
| 13-Oct | 31.5 |
| 14-Oct | 31 |
| 15-Oct | 30.5 |
| 16-Oct | |
| 17-Oct | |
| 18-Oct | |
| 19-Oct | |
| 20-Oct | |
| 21-Oct | |
| 22-Oct | |
| 23-Oct | |
| 24-Oct | |
| 25-Oct | |
| 26-Oct | |
| 27-Oct | |
| 28-Oct | |
| 29-Oct | |
| 30-Oct | |
| 31-Oct | |
| 1-Nov | |
| 2-Nov | |
| 3-Nov | |
| 4-Nov | |
| 5-Nov | |
| 6-Nov | |
| 7-Nov | |
| 8-Nov | |
| 9-Nov | |
| 10-Nov | |
| 11-Nov | |
| 12-Nov | |
| 13-Nov | |
| 14-Nov | |
| 15-Nov | |
| 16-Nov | |
| 17-Nov | |
| 18-Nov | |
| 19-Nov | |
| 20-Nov | |
| 21-Nov | |
| 22-Nov | |
| 23-Nov | |
| 24-Nov | |
| 25-Nov | |
| 26-Nov | |
| 27-Nov | |
| 28-Nov | |
| 29-Nov | |
| 30-Nov | |
| 1-Dec | |
| 2-Dec | |
| 3-Dec | |
| 4-Dec | |
| 5-Dec | |
| 6-Dec | |
| 7-Dec | |
| 8-Dec | |
| 9-Dec | |
| 10-Dec | |
| 11-Dec | |
| 12-Dec | |
| 13-Dec | |
| 14-Dec | |
| 15-Dec | |
| 16-Dec | |
| 17-Dec | |
| 18-Dec | |
| 19-Dec | |
| 20-Dec | |
| 21-Dec | |
| 22-Dec | |
| 23-Dec | |
| 24-Dec | |
| 25-Dec | |
| 26-Dec | |
| 27-Dec | |
| 28-Dec | |
| 29-Dec | |
| 30-Dec | |
| 31-Dec |
Set the storage objective to the Storage Pattern you created at the beginning. For the first rule, set it as a Minimum Main Release of 100 cfs. Second rule, Maximum Main Release of 175 cfs. Third rule, Maximum Rate Flow Change of 25 cfs.
Zone 3
Configure the third zone to cover the non-growing season flood pool. Use the spinner to set it to have two rules (the storage objective is automatic.) Create a new Daily Elevation Pattern Paired Data curve and call it "NG Flood Control". The pattern is in the table below.
| Date | Elevation (ft) |
|---|---|
| 1-Jan | 100 |
| 2-Jan | 100 |
| 3-Jan | 100 |
| 4-Jan | 100 |
| 5-Jan | 100 |
| 6-Jan | 100 |
| 7-Jan | 100 |
| 8-Jan | 100 |
| 9-Jan | 100 |
| 10-Jan | 100 |
| 11-Jan | 100 |
| 12-Jan | 100 |
| 13-Jan | 100 |
| 14-Jan | 100 |
| 15-Jan | 100 |
| 16-Jan | 100 |
| 17-Jan | 100 |
| 18-Jan | 100 |
| 19-Jan | 100 |
| 20-Jan | 100 |
| 21-Jan | 100 |
| 22-Jan | 100 |
| 23-Jan | 100 |
| 24-Jan | 100 |
| 25-Jan | 100 |
| 26-Jan | 100 |
| 27-Jan | 100 |
| 28-Jan | 100 |
| 29-Jan | 100 |
| 30-Jan | 100 |
| 31-Jan | 100 |
| 1-Feb | 100 |
| 2-Feb | 100 |
| 3-Feb | 100 |
| 4-Feb | 100 |
| 5-Feb | 100 |
| 6-Feb | 100 |
| 7-Feb | 100 |
| 8-Feb | 100 |
| 9-Feb | 100 |
| 10-Feb | 100 |
| 11-Feb | 100 |
| 12-Feb | 100 |
| 13-Feb | 100 |
| 14-Feb | 100 |
| 15-Feb | 100 |
| 16-Feb | 100 |
| 17-Feb | 100 |
| 18-Feb | 100 |
| 19-Feb | 100 |
| 20-Feb | 100 |
| 21-Feb | 100 |
| 22-Feb | 100 |
| 23-Feb | 100 |
| 24-Feb | 100 |
| 25-Feb | 100 |
| 26-Feb | 100 |
| 27-Feb | 100 |
| 28-Feb | 100 |
| 29-Feb | 100 |
| 1-Mar | 100 |
| 2-Mar | 100 |
| 3-Mar | 100 |
| 4-Mar | 100 |
| 5-Mar | 100 |
| 6-Mar | 100 |
| 7-Mar | 100 |
| 8-Mar | 100 |
| 9-Mar | 100 |
| 10-Mar | 100 |
| 11-Mar | 100 |
| 12-Mar | 100 |
| 13-Mar | 100 |
| 14-Mar | 100 |
| 15-Mar | 100 |
| 16-Mar | 100 |
| 17-Mar | 100 |
| 18-Mar | 100 |
| 19-Mar | 100 |
| 20-Mar | 100 |
| 21-Mar | 100 |
| 22-Mar | 100 |
| 23-Mar | 100 |
| 24-Mar | 100 |
| 25-Mar | 100 |
| 26-Mar | 100 |
| 27-Mar | 100 |
| 28-Mar | 100 |
| 29-Mar | 100 |
| 30-Mar | 100 |
| 31-Mar | 100 |
| 1-Apr | 100 |
| 2-Apr | 100 |
| 3-Apr | 100 |
| 4-Apr | 100 |
| 5-Apr | 100 |
| 6-Apr | 100 |
| 7-Apr | 100 |
| 8-Apr | 100 |
| 9-Apr | 100 |
| 10-Apr | 100 |
| 11-Apr | 100 |
| 12-Apr | 100 |
| 13-Apr | 100 |
| 14-Apr | 100 |
| 15-Apr | |
| 16-Apr | |
| 17-Apr | |
| 18-Apr | |
| 19-Apr | |
| 20-Apr | |
| 21-Apr | |
| 22-Apr | |
| 23-Apr | |
| 24-Apr | |
| 25-Apr | |
| 26-Apr | |
| 27-Apr | |
| 28-Apr | |
| 29-Apr | |
| 30-Apr | |
| 1-May | |
| 2-May | |
| 3-May | |
| 4-May | |
| 5-May | |
| 6-May | |
| 7-May | |
| 8-May | |
| 9-May | |
| 10-May | |
| 11-May | |
| 12-May | |
| 13-May | |
| 14-May | |
| 15-May | |
| 16-May | |
| 17-May | |
| 18-May | |
| 19-May | |
| 20-May | |
| 21-May | |
| 22-May | |
| 23-May | |
| 24-May | |
| 25-May | |
| 26-May | |
| 27-May | |
| 28-May | |
| 29-May | |
| 30-May | |
| 31-May | |
| 1-Jun | |
| 2-Jun | |
| 3-Jun | |
| 4-Jun | |
| 5-Jun | |
| 6-Jun | |
| 7-Jun | |
| 8-Jun | |
| 9-Jun | |
| 10-Jun | |
| 11-Jun | |
| 12-Jun | |
| 13-Jun | |
| 14-Jun | |
| 15-Jun | |
| 16-Jun | |
| 17-Jun | |
| 18-Jun | |
| 19-Jun | |
| 20-Jun | |
| 21-Jun | |
| 22-Jun | |
| 23-Jun | |
| 24-Jun | |
| 25-Jun | |
| 26-Jun | |
| 27-Jun | |
| 28-Jun | |
| 29-Jun | |
| 30-Jun | |
| 1-Jul | |
| 2-Jul | |
| 3-Jul | |
| 4-Jul | |
| 5-Jul | |
| 6-Jul | |
| 7-Jul | |
| 8-Jul | |
| 9-Jul | |
| 10-Jul | |
| 11-Jul | |
| 12-Jul | |
| 13-Jul | |
| 14-Jul | |
| 15-Jul | |
| 16-Jul | |
| 17-Jul | |
| 18-Jul | |
| 19-Jul | |
| 20-Jul | |
| 21-Jul | |
| 22-Jul | |
| 23-Jul | |
| 24-Jul | |
| 25-Jul | |
| 26-Jul | |
| 27-Jul | |
| 28-Jul | |
| 29-Jul | |
| 30-Jul | |
| 31-Jul | |
| 1-Aug | |
| 2-Aug | |
| 3-Aug | |
| 4-Aug | |
| 5-Aug | |
| 6-Aug | |
| 7-Aug | |
| 8-Aug | |
| 9-Aug | |
| 10-Aug | |
| 11-Aug | |
| 12-Aug | |
| 13-Aug | |
| 14-Aug | |
| 15-Aug | |
| 16-Aug | |
| 17-Aug | |
| 18-Aug | |
| 19-Aug | |
| 20-Aug | |
| 21-Aug | |
| 22-Aug | |
| 23-Aug | |
| 24-Aug | |
| 25-Aug | |
| 26-Aug | |
| 27-Aug | |
| 28-Aug | |
| 29-Aug | |
| 30-Aug | |
| 31-Aug | |
| 1-Sep | |
| 2-Sep | |
| 3-Sep | |
| 4-Sep | |
| 5-Sep | |
| 6-Sep | |
| 7-Sep | |
| 8-Sep | |
| 9-Sep | |
| 10-Sep | |
| 11-Sep | |
| 12-Sep | |
| 13-Sep | |
| 14-Sep | |
| 15-Sep | |
| 16-Sep | |
| 17-Sep | |
| 18-Sep | |
| 19-Sep | |
| 20-Sep | |
| 21-Sep | |
| 22-Sep | |
| 23-Sep | |
| 24-Sep | |
| 25-Sep | |
| 26-Sep | |
| 27-Sep | |
| 28-Sep | |
| 29-Sep | |
| 30-Sep | |
| 1-Oct | |
| 2-Oct | |
| 3-Oct | |
| 4-Oct | |
| 5-Oct | |
| 6-Oct | |
| 7-Oct | |
| 8-Oct | |
| 9-Oct | |
| 10-Oct | |
| 11-Oct | |
| 12-Oct | |
| 13-Oct | |
| 14-Oct | |
| 15-Oct | |
| 16-Oct | 100 |
| 17-Oct | 100 |
| 18-Oct | 100 |
| 19-Oct | 100 |
| 20-Oct | 100 |
| 21-Oct | 100 |
| 22-Oct | 100 |
| 23-Oct | 100 |
| 24-Oct | 100 |
| 25-Oct | 100 |
| 26-Oct | 100 |
| 27-Oct | 100 |
| 28-Oct | 100 |
| 29-Oct | 100 |
| 30-Oct | 100 |
| 31-Oct | 100 |
| 1-Nov | 100 |
| 2-Nov | 100 |
| 3-Nov | 100 |
| 4-Nov | 100 |
| 5-Nov | 100 |
| 6-Nov | 100 |
| 7-Nov | 100 |
| 8-Nov | 100 |
| 9-Nov | 100 |
| 10-Nov | 100 |
| 11-Nov | 100 |
| 12-Nov | 100 |
| 13-Nov | 100 |
| 14-Nov | 100 |
| 15-Nov | 100 |
| 16-Nov | 100 |
| 17-Nov | 100 |
| 18-Nov | 100 |
| 19-Nov | 100 |
| 20-Nov | 100 |
| 21-Nov | 100 |
| 22-Nov | 100 |
| 23-Nov | 100 |
| 24-Nov | 100 |
| 25-Nov | 100 |
| 26-Nov | 100 |
| 27-Nov | 100 |
| 28-Nov | 100 |
| 29-Nov | 100 |
| 30-Nov | 100 |
| 1-Dec | 100 |
| 2-Dec | 100 |
| 3-Dec | 100 |
| 4-Dec | 100 |
| 5-Dec | 100 |
| 6-Dec | 100 |
| 7-Dec | 100 |
| 8-Dec | 100 |
| 9-Dec | 100 |
| 10-Dec | 100 |
| 11-Dec | 100 |
| 12-Dec | 100 |
| 13-Dec | 100 |
| 14-Dec | 100 |
| 15-Dec | 100 |
| 16-Dec | 100 |
| 17-Dec | 100 |
| 18-Dec | 100 |
| 19-Dec | 100 |
| 20-Dec | 100 |
| 21-Dec | 100 |
| 22-Dec | 100 |
| 23-Dec | 100 |
| 24-Dec | 100 |
| 25-Dec | 100 |
| 26-Dec | 100 |
| 27-Dec | 100 |
| 28-Dec | 100 |
| 29-Dec | 100 |
| 30-Dec | 100 |
| 31-Dec | 100 |
Set the storage objective to the Storage Pattern you created at the beginning. For the first rule, set it as a Maximum Main Release of 300 cfs. Second rule, Maximum Rate Flow Change of 25 cfs.
Zone 4
Configure the fourth zone to cover the growing season flood pool. Use the spinner to set it to have two rules (the storage objective is automatic.) Create a new Daily Elevation Pattern Paired Data curve and call it "G Flood Control". The pattern is in the table below.
| Date | Elevation (ft) |
|---|---|
| 1-Jan | |
| 2-Jan | |
| 3-Jan | |
| 4-Jan | |
| 5-Jan | |
| 6-Jan | |
| 7-Jan | |
| 8-Jan | |
| 9-Jan | |
| 10-Jan | |
| 11-Jan | |
| 12-Jan | |
| 13-Jan | |
| 14-Jan | |
| 15-Jan | |
| 16-Jan | |
| 17-Jan | |
| 18-Jan | |
| 19-Jan | |
| 20-Jan | |
| 21-Jan | |
| 22-Jan | |
| 23-Jan | |
| 24-Jan | |
| 25-Jan | |
| 26-Jan | |
| 27-Jan | |
| 28-Jan | |
| 29-Jan | |
| 30-Jan | |
| 31-Jan | |
| 1-Feb | |
| 2-Feb | |
| 3-Feb | |
| 4-Feb | |
| 5-Feb | |
| 6-Feb | |
| 7-Feb | |
| 8-Feb | |
| 9-Feb | |
| 10-Feb | |
| 11-Feb | |
| 12-Feb | |
| 13-Feb | |
| 14-Feb | |
| 15-Feb | |
| 16-Feb | |
| 17-Feb | |
| 18-Feb | |
| 19-Feb | |
| 20-Feb | |
| 21-Feb | |
| 22-Feb | |
| 23-Feb | |
| 24-Feb | |
| 25-Feb | |
| 26-Feb | |
| 27-Feb | |
| 28-Feb | |
| 29-Feb | |
| 1-Mar | |
| 2-Mar | |
| 3-Mar | |
| 4-Mar | |
| 5-Mar | |
| 6-Mar | |
| 7-Mar | |
| 8-Mar | |
| 9-Mar | |
| 10-Mar | |
| 11-Mar | |
| 12-Mar | |
| 13-Mar | |
| 14-Mar | |
| 15-Mar | |
| 16-Mar | |
| 17-Mar | |
| 18-Mar | |
| 19-Mar | |
| 20-Mar | |
| 21-Mar | |
| 22-Mar | |
| 23-Mar | |
| 24-Mar | |
| 25-Mar | |
| 26-Mar | |
| 27-Mar | |
| 28-Mar | |
| 29-Mar | |
| 30-Mar | |
| 31-Mar | |
| 1-Apr | |
| 2-Apr | |
| 3-Apr | |
| 4-Apr | |
| 5-Apr | |
| 6-Apr | |
| 7-Apr | |
| 8-Apr | |
| 9-Apr | |
| 10-Apr | |
| 11-Apr | |
| 12-Apr | |
| 13-Apr | |
| 14-Apr | |
| 15-Apr | 100 |
| 16-Apr | 100 |
| 17-Apr | 100 |
| 18-Apr | 100 |
| 19-Apr | 100 |
| 20-Apr | 100 |
| 21-Apr | 100 |
| 22-Apr | 100 |
| 23-Apr | 100 |
| 24-Apr | 100 |
| 25-Apr | 100 |
| 26-Apr | 100 |
| 27-Apr | 100 |
| 28-Apr | 100 |
| 29-Apr | 100 |
| 30-Apr | 100 |
| 1-May | 100 |
| 2-May | 100 |
| 3-May | 100 |
| 4-May | 100 |
| 5-May | 100 |
| 6-May | 100 |
| 7-May | 100 |
| 8-May | 100 |
| 9-May | 100 |
| 10-May | 100 |
| 11-May | 100 |
| 12-May | 100 |
| 13-May | 100 |
| 14-May | 100 |
| 15-May | 100 |
| 16-May | 100 |
| 17-May | 100 |
| 18-May | 100 |
| 19-May | 100 |
| 20-May | 100 |
| 21-May | 100 |
| 22-May | 100 |
| 23-May | 100 |
| 24-May | 100 |
| 25-May | 100 |
| 26-May | 100 |
| 27-May | 100 |
| 28-May | 100 |
| 29-May | 100 |
| 30-May | 100 |
| 31-May | 100 |
| 1-Jun | 100 |
| 2-Jun | 100 |
| 3-Jun | 100 |
| 4-Jun | 100 |
| 5-Jun | 100 |
| 6-Jun | 100 |
| 7-Jun | 100 |
| 8-Jun | 100 |
| 9-Jun | 100 |
| 10-Jun | 100 |
| 11-Jun | 100 |
| 12-Jun | 100 |
| 13-Jun | 100 |
| 14-Jun | 100 |
| 15-Jun | 100 |
| 16-Jun | 100 |
| 17-Jun | 100 |
| 18-Jun | 100 |
| 19-Jun | 100 |
| 20-Jun | 100 |
| 21-Jun | 100 |
| 22-Jun | 100 |
| 23-Jun | 100 |
| 24-Jun | 100 |
| 25-Jun | 100 |
| 26-Jun | 100 |
| 27-Jun | 100 |
| 28-Jun | 100 |
| 29-Jun | 100 |
| 30-Jun | 100 |
| 1-Jul | 100 |
| 2-Jul | 100 |
| 3-Jul | 100 |
| 4-Jul | 100 |
| 5-Jul | 100 |
| 6-Jul | 100 |
| 7-Jul | 100 |
| 8-Jul | 100 |
| 9-Jul | 100 |
| 10-Jul | 100 |
| 11-Jul | 100 |
| 12-Jul | 100 |
| 13-Jul | 100 |
| 14-Jul | 100 |
| 15-Jul | 100 |
| 16-Jul | 100 |
| 17-Jul | 100 |
| 18-Jul | 100 |
| 19-Jul | 100 |
| 20-Jul | 100 |
| 21-Jul | 100 |
| 22-Jul | 100 |
| 23-Jul | 100 |
| 24-Jul | 100 |
| 25-Jul | 100 |
| 26-Jul | 100 |
| 27-Jul | 100 |
| 28-Jul | 100 |
| 29-Jul | 100 |
| 30-Jul | 100 |
| 31-Jul | 100 |
| 1-Aug | 100 |
| 2-Aug | 100 |
| 3-Aug | 100 |
| 4-Aug | 100 |
| 5-Aug | 100 |
| 6-Aug | 100 |
| 7-Aug | 100 |
| 8-Aug | 100 |
| 9-Aug | 100 |
| 10-Aug | 100 |
| 11-Aug | 100 |
| 12-Aug | 100 |
| 13-Aug | 100 |
| 14-Aug | 100 |
| 15-Aug | 100 |
| 16-Aug | 100 |
| 17-Aug | 100 |
| 18-Aug | 100 |
| 19-Aug | 100 |
| 20-Aug | 100 |
| 21-Aug | 100 |
| 22-Aug | 100 |
| 23-Aug | 100 |
| 24-Aug | 100 |
| 25-Aug | 100 |
| 26-Aug | 100 |
| 27-Aug | 100 |
| 28-Aug | 100 |
| 29-Aug | 100 |
| 30-Aug | 100 |
| 31-Aug | 100 |
| 1-Sep | 100 |
| 2-Sep | 100 |
| 3-Sep | 100 |
| 4-Sep | 100 |
| 5-Sep | 100 |
| 6-Sep | 100 |
| 7-Sep | 100 |
| 8-Sep | 100 |
| 9-Sep | 100 |
| 10-Sep | 100 |
| 11-Sep | 100 |
| 12-Sep | 100 |
| 13-Sep | 100 |
| 14-Sep | 100 |
| 15-Sep | 100 |
| 16-Sep | 100 |
| 17-Sep | 100 |
| 18-Sep | 100 |
| 19-Sep | 100 |
| 20-Sep | 100 |
| 21-Sep | 100 |
| 22-Sep | 100 |
| 23-Sep | 100 |
| 24-Sep | 100 |
| 25-Sep | 100 |
| 26-Sep | 100 |
| 27-Sep | 100 |
| 28-Sep | 100 |
| 29-Sep | 100 |
| 30-Sep | 100 |
| 1-Oct | 100 |
| 2-Oct | 100 |
| 3-Oct | 100 |
| 4-Oct | 100 |
| 5-Oct | 100 |
| 6-Oct | 100 |
| 7-Oct | 100 |
| 8-Oct | 100 |
| 9-Oct | 100 |
| 10-Oct | 100 |
| 11-Oct | 100 |
| 12-Oct | 100 |
| 13-Oct | 100 |
| 14-Oct | 100 |
| 15-Oct | 100 |
| 16-Oct | |
| 17-Oct | |
| 18-Oct | |
| 19-Oct | |
| 20-Oct | |
| 21-Oct | |
| 22-Oct | |
| 23-Oct | |
| 24-Oct | |
| 25-Oct | |
| 26-Oct | |
| 27-Oct | |
| 28-Oct | |
| 29-Oct | |
| 30-Oct | |
| 31-Oct | |
| 1-Nov | |
| 2-Nov | |
| 3-Nov | |
| 4-Nov | |
| 5-Nov | |
| 6-Nov | |
| 7-Nov | |
| 8-Nov | |
| 9-Nov | |
| 10-Nov | |
| 11-Nov | |
| 12-Nov | |
| 13-Nov | |
| 14-Nov | |
| 15-Nov | |
| 16-Nov | |
| 17-Nov | |
| 18-Nov | |
| 19-Nov | |
| 20-Nov | |
| 21-Nov | |
| 22-Nov | |
| 23-Nov | |
| 24-Nov | |
| 25-Nov | |
| 26-Nov | |
| 27-Nov | |
| 28-Nov | |
| 29-Nov | |
| 30-Nov | |
| 1-Dec | |
| 2-Dec | |
| 3-Dec | |
| 4-Dec | |
| 5-Dec | |
| 6-Dec | |
| 7-Dec | |
| 8-Dec | |
| 9-Dec | |
| 10-Dec | |
| 11-Dec | |
| 12-Dec | |
| 13-Dec | |
| 14-Dec | |
| 15-Dec | |
| 16-Dec | |
| 17-Dec | |
| 18-Dec | |
| 19-Dec | |
| 20-Dec | |
| 21-Dec | |
| 22-Dec | |
| 23-Dec | |
| 24-Dec | |
| 25-Dec | |
| 26-Dec | |
| 27-Dec | |
| 28-Dec | |
| 29-Dec | |
| 30-Dec | |
| 31-Dec |
Set the storage objective to the Storage Pattern you created at the beginning. For the first rule, set it as a Maximum Main Release of 250 cfs. Second rule, Maximum Rate Flow Change of 25 cfs.
Conclusion
The reservoir is now configured to operate according to this fictitious water control manual. You can test its operations by using a source element upstream to feed it inflows as desired using a constant value or a discharge gage. Keep in mind that the reservoir only has an outlet capacity of about 300 cfs at the top of the conservation pool and 500 cfs at the top of the dam - but stores 640 KAF at the top of dam. The reservoir can store a great deal of water but release it only very slowly.