Download PDF
Download page Routing the Probable Maximum Flood (PMF) Hydrograph through a Reservoir Model to Compute the Peak Reservoir Stage.
Routing the Probable Maximum Flood (PMF) Hydrograph through a Reservoir Model to Compute the Peak Reservoir Stage
HEC-HMS version 4.12 was used to develop this example.
Download the initial HEC-HMS project here: Route_PMF_Initial_v412.zip
Introduction
This workshop provides an example for computing the peak reservoir stage using an existing HEC-HMS model that was already configured to compute the Probable Maximum Flood (PMF). The Sayers Dam watershed is used for this workshop. As mentioned in previous workshops, an existing HEC-HMS model was calibrated to three historic flood events. The original Spillway Design Flood (SDF) did not use HMR 52 to develop the PMP and it was not clear how the flood hydrograph was computed. Consequently, use of the SDF does not allow the modeler to complete a sensitivity analysis of the hydrologic processes and assumptions associated with the PMF and routing of the PMF. Therefore, reuse of the SDF contained in the reservoir regulation manual is not appropriate.
Subbasin delineations and stream gage locations in the Bald Eagle Creek HEC-HMS model are shown in the figure below. Major tributaries in the Bald Eagle Creek watershed include Spring Creek, Marsh Creek, Beech Creek, and Fishing Creek. The drainage area upstream of Sayers Dam is subdivided into 3 subbasins, “Spring Creek”, “Bald Eagle HW”, and “Reservoir Local”. Stream gage data was available for model calibration at the outlet of the Spring Creek subbasin, below the confluence of Spring Creek and Bald Eagle Creek, at the outlet of the Marsh Creek subbasin, and at the outlet of the Beech Creek Upper subbasin. Some model parameters, like percent impervious area, were estimated using GIS data. Others, like the Clark storage coefficient, were initially estimated using regression equations and physical characteristics within the contributing watersheds. Model parameters were refined when calibrating to the three calibration events.

Once the model was calibrated to three historic events, model parameters were then extracted and appropriate loss, unit hydrograph, baseflow, and routing parameters were determined for simulating the PMF. Ideally, multiple PMF scenarios would be simulated that evaluated the uncertainty in modeling assumptions, like the percentage used to peak the unit response at the dam. For this workshop, we are using the 50 percent peaking scenario developed in the previous PMF workshop. This workshop moves forward with the PMF inflow into Sayers Dam and routes the flood wave through the reservoir to compute the PMF stage while following guidance in ER 1110-8-2(FR) for reservoir operation and setting the initial storage.
Major Workshop Tasks: This workshop illustrates how an HEC-HMS model can be configured to route the PMF hydrograph through a reservoir model. Either an existing HEC-HMS can be used or a simple HEC-HMS model can be developed that includes a source element and a reservoir element. This workshop focusses on configuring the reservoir element and applying guidance for computing the PMF stage. For flood flows modeled as part of the PMF stage, the influence of the downstream control operations on the peak pool elevation is generally negligible, due to both the large magnitude of the inflow hydrograph and the accompanying large magnitude of the downstream local flows. Generally, all discharge will be through uncontrolled outlets, spillway, and possibly the dam top as well. Therefore, HEC-HMS provides a computationally efficient and reliable means for determining the peak pool elevation for the PMF.
As stated throughout the workshops, multiple scenarios are required to demonstrate the uncertainty in many of the modeling assumptions that are part of the Periodic Assessment. When computing the PMF stage, multiple scenarios are necessary that evaluate the uncertainty due to the initial reservoir storage condition. The preferred PMF stage is set following guidance in ER 1110-8-2(FR). Other possible uncertainties in reservoir routing include uncertainty in gated spillway operations and reduced capacity of uncontrolled outlets due to debris.
The following major tasks will serve as an outline for the workshop:
- Compute the one-half PMF hydrograph and import the information into an HEC-HMS model
- Add a simple basin model with a source element and reservoir element, enter physical information for the reservoir element
- Compute the simulation that routes one-half the PMF hydrograph through the reservoir and determine the resulting stage five days after significant precipitation
- Configure an HEC-HMS basin model to route the full PMF hydrograph and compute the PMF stage
- Compare the PMF stage from multiple initial pool scenarios
Task 1: Compute the one-half PMF hydrograph and import the information into an HEC-HMS model
- Open the HEC-HMS project named Route_PMF. Select the Basin Models folder to expand the Watershed Explorer and see all basin models in this project. You should notice a separate basin model for each calibration event (1972, 1996, and 2004). The fourth basin model, named “PMF”, was used to compute the PMF hydrograph for Sayers Dam by peaking the unit response at the dam by 50 percent. For an actual study, major assumptions/scenarios should be part of the name for the HEC-HMS model component (for example, PMF_Peak50P would be a more descriptive name for this basin model). The fifth basin model is named PMF_IDFStage and will be used to compute the PMF stage.
- Open the PMF basin model and select the simulation named PMF from the Current Compute Selection list. Next, click the Compute All Elements button to run the simulation. Open the results plot for the Pool HW element, as shown in the figure below. This hydrograph is the PMF hydrograph from the 50 Percent unit hydrograph peaking alternative and represents modeled inflow to the reservoir.


- Open the Time-Series table for the Pool HW junction element (select the junction element and then click the View Time-Series Table button on the compute toolbar -
 ). Select and copy the Outflow values from the time-series table (copy values to the clipboard).
 - Open the One Half PMF spreadsheet located in the workshop folder and paste the PMF time-series from Step 3 into column C. Within column D, multiply each PMF ordinate by 0.5 to compute a hydrograph that is one-half the PMF. The plot should automatically update and show both the PMF hydrograph and the one-half PMF hydrograph, as shown in the figure below.

- Add a new Discharge Gage named “One-Half PMF” to the HEC-HMS project using the Time-Series Data Manager. Open the component editor for the new gage and set the Data Source to Manual Entry, Units to “Cubic Feet Per Second” and the Time Interval to “15 Minutes”. Set the start date and time to “01Jan1999 00:00” and the end date and time to “08Jan1999 00:00”. Go to the Table tab and then paste the one-half hydrograph computed in Step 4. This and the previous step can also be completed within HMS by copying the Full PMF time-series directly into the "One-Half PMF" discharge gage, highlighting the flow ordinates, right-clicking and selecting Fill... and multiplying by a constant of 0.5.

Task 2: Add a simple basin model with a source element and reservoir element, enter physical information for the reservoir element
- Using the Basin Model Manager, create a basin model named “One-Half PMF Route”. Select the new basin model in the Watershed Explorer tree to open the Component Editor and display the empty map. Make sure the unit system is “U.S. Customary” in the Component Editor.
- Load a background shapefile of the watershed (this is for visual purposes only). Select the Map Layers option from the View menu and then click the Add…. Navigate to the Route_PMF/maps folder and choose the Subbasin.shp file. (Select the Skip option in the Basin Model Coordinate System message that pops up. By selecting Skip, the basin model coordinate system will be automatically set to the subbasin shapefile.) The basin model map should now display a shape file of the Bald Eagle Creek watershed.
- Add a reservoir element named “Sayers Dam” and a source element named “One-Half PMF” to the basin model. Connect the source element to the reservoir element as shown in the figure below.

- Open the component editor for the One-Half PMF source element. Choose Discharge Gage as the Flow Method on the Source tab. On the Inflow tab, select the One-Half PMF gage (created in Step 5) from the drop down list.
According to ER 1110-8-2, when setting the initial reservoir pool prior to routing the PMF hydrograph, a flood hydrograph that is one-half the PMF hydrograph should be routed through a reservoir simulation model and the reservoir stage five days after the last significant rainfall is computed. The minimum starting pool for the PMF routing is either the full flood control pool or the resulting stage after routing ½ the PMF hydrograph. When routing the one-half PMF hydrograph, a normal pool starting condition should be used (normal pool elevation for the season when the PMF will occur). For the Bald Eagle Creek watershed, the PMF hydrograph would likely be associated with a tropical event, which would occur in the summer and early fall months. During this period the normal pool for the Sayers Dam pool is 630 feet.
The most up to date physical information for the dam should be entered into the HEC-HMS model, including the elevation-storage curve and information about the spillway and dam top. - Already completed. Add a storage-elevation function to the HEC-HMS project. Open the Paired Data Manager (from the Components menu) and choose the Elevation-Storage Data Type. Click the New… button and enter a name of “Sayers Dam Elev-Stor” for the new curve. Click the Create button to add the curve to the HEC-HMS project. Open the component editor for the Sayers Dam Elev-Stor curve and make sure the Data Source is set to Manual Entry, and Units are set to AC-FT. Then paste the elevation-storage curve contained in Sheet2 from the One Half PMF. The figure below shows the Graph tab for the Sayers Dam elevation-storage curve.

- Edit the reservoir element. Open the component editor for the Sayers Dam reservoir element. Select the Outflow Structures Reservoir Routing Method. Select the Elevation-Storage Storage Method and then choose the Elev-Stor Function created in Step 5. Select an Initial Condition of Elevation and enter an Initial Elevation of 630. Finally, select one Spillway and one Dam Top (the specified release option can be used to simulate additional releases from the reservoir (from gated outlets), use of this option would be through multiple iterations). The completed component editor should look similar to the figure below. (If an existing rating curve is available, with elevation-storage-discharge information, then the “Outflow Curve” routing option would need to be selected instead of “Outflow Structures”. The rating curve might need to be modified to reflect operation assumptions for the PMF and then also include flow going over the dam top.)

- Open the Spillway 1 component editor and change the Spillway Method to Ogee Spillway. The figure below shows the Ogee Spillway information as contained in the Sayers Dam reservoir regulation manual. Enter the Ogee Spillway information into the spillway component editor.

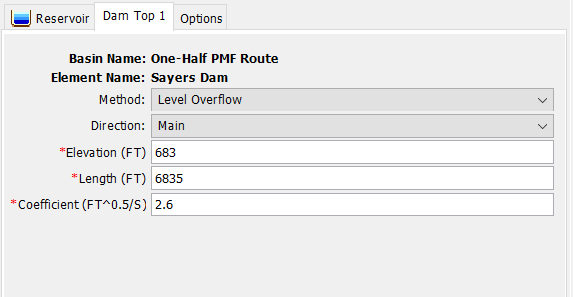
- Open the Dam Top 1 component editor and enter a dam top Elevation of 683 feet, a Length of 6835 feet, and a Weir Coefficient of 2.6.
Task 3: Compute the simulation that routes one-half the PMF hydrograph through the reservoir and determine the resulting stage five days after significant precipitation
- Create a meteorologic model named “No Precipitation”, make sure the replace missing option is set to “Set to Default” and select “None” as the precipitation method.
- Create a simulation run named “Route One-Half PMF” using the “One-Half PMF Route” basin model, “No Precipitation” meteorologic model, and “PMF Event” control specifications.
- Run the Route One-Half PMF simulation and view results for the Sayers Dam reservoir element.
Results should be similar to those shown in the figure below. Notice how there are no releases from the reservoir until the end of January 2nd. The reservoir started the simulation at elevation 630 feet. There were no low level outlets added to the model; therefore, the reservoir had to fill to elevation 657, which is the uncontrolled spillway invert elevation, before discharge was computed from the reservoir.
Part of the criteria for defining the initial reservoir storage/elevation prior to routing the PMF hydrograph in ER 1110-8-2 (FR) is to route a flood hydrograph that is one-half the PMF hydrograph and evaluate the reservoir stage five days after the last significant rainfall. The figure below shows the PMP hyetograph and flow hydrograph for the Reservoir Local subbasin from the PMF Basin Model in the PMF Simulation Run. There might be some debate about the meaning of “last significant rainfall;” however, the PMP hyetograph usually contains small amounts of precipitation at the beginning and end of the event. In many cases, most of the precipitation in the first and last 12 hours of the PMP are infiltrated into the soil because the precipitation intensity is small. Based on the results shown in the figure below, it was determined that the last time step with significant precipitation was hour 24:00 on Jan 2nd. Therefore, the elevation five days after the last significant rainfall would be evaluated on January 7, 24:00. In this workshop, the simulated elevation is 658.1 feet on January 7 at 24:00, 1.1 feet higher than the spillway invert. A sensitivity analysis should be performed with additional starting pool conditions; however, the preferred starting condition for a Periodic Assessment would be 658.1 feet for Sayers Dam.
Task 4: Configure an HEC-HMS basin model to route the full PMF hydrograph and compute the PMF stage
- Open the PMF_IDFStage basin model and update the reservoir element with the correct starting pool stage (658.1 feet) and enter the Spillway and Dam Top information (see task 2, steps 7 and 8).
A simulation, named “PMF_IDFStage” has already been configured that uses the “PMF_IDFStage” basin model, “PMP” meteorologic model, and “PMF Event” control specifications. Run the PMF_IDFStage simulation and view results at the Sayers Dam element and answer the following questions.
Question 1: What is the Peak reservoir stage from the PMF simulation? Is the Dam overtopped? If not, how much freeboard is available?
The reservoir regulation manual states that the dam was designed with 5 feet of freeboard.The peak reservoir stage is 678.19 feet. At the peak stage, the dam had 4.81 feet of freeboard remaining.
Question 2: What additional PMP, PMF, and PMF stage scenarios could be performed to quantify the uncertainty in the PMF stage?
Additional simulations can be configured where the PMP depths are varied, alternative temporal pattern, storm orientation, and storm areas simulated. Additional simulations could be configured to evaluate uncertainty due to loss, transform, and routing parameters. Finally, additional simulations can be configured where different initial reservoir storage conditions are assumed and reduced reservoir releases assumed to model possible obstructions in reservoir outlets. The idea is to get a sense for how uncertainty in boundary conditions, initial condition, and model parameters impact the computed results.
Task 5: Compare the PMF stage from multiple initial pool scenarios
Create an additional simulation that uses the spillway invert elevation, 657 feet, for the initial condition. For comparison purposes, create a copy of the PMF_IDFStage basin model and name it PMF_IDFStage_InitElev657. Run the simulation and compare the peak stage to results from Task 4. You will need to set the PMF_IDFStage_InitElev657 basin to "Yes" within the PMP meteorological model component editor in order to successfully run the simulation. The figure below shows results from both simulations.
Question 3: Is the Peak reservoir stage sensitive to the starting pool condition?There is minimal impact to the stage in the run up to the peak, and both initial elevations result in the same peak reservoir stage.
