Download PDF
Download page HEC-HMS Animation Export.
HEC-HMS Animation Export
HEC-HMS version 4.10 beta 6 was used to develop this tutorial.
Download Initial Project Files Animation_Export_Start.zip
Introduction
HEC-HMS 4.10 provides users the capability to export spatial result animations to either a .avi or .mp4 file. In this tutorial, you will learn how to export an animation that can be shared with others. This tutorial uses the Tule River watershed upstream of Success Reservoir. The project uses the Structured Discretization method, the Gridded Temperature Index Method for snowmelt computation, and the Interpolated Precipitation and Temperature meteorological method to produce gridded precipitation and temperature grids. The discretization uses the SHG projection and a cell size of 1000 meters. Spatial results cannot be performed if subbasin elements have not been georeferenced. If gridded data is used for the meteorology and the ModClark or 2D Diffusion Wave transform methods selected, the spatial animation will display gridded outputs based on the assigned cell size. Spatial results will be displayed as subbasin averages when non-gridded precipitation and unit hydrograph transform methods are used.
Set up Spatial Results
- Check that a discretization has been set for each subbasin. You can view this through the Global Editor by clicking on Parameters | Discretization. In this example, Structured Discretization was set up. Click on Structured and review the table.

- On the bottom of the Watershed Explorer, click on the Compute tab and expand Simulations Runs folder. Two Simulations Runs will appear. Select the Jan97_Interoplated_Bias simulation. At the Component Editor, change the Spatial Results to Yes. Select a Spatial Interval of 15 Minutes. This will be the timestep of the spatial output animation.
- Right click on Jan97_InterpolatedGrid_Bias and click on Compute to run the simulation.
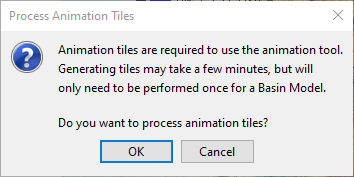
- Navigate to the Spatial Results toolbar. Click on the results type combo box and select Cumulative Precipitation. A Process Animation Tiles window should open. Click OK to process the animations.

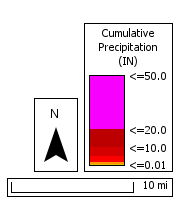
- Once the Processing Animations Tiles is complete, the Spatial Results toolbar should now have a green arrow activated. In the Map Window, you should notice a Cumulative Precipitation legend (you can turn on the legend from the View menu).

- Before clicking on the green arrow, head over to the Display Properties editor by clicking on the cog icon. The Properties Window should open.

- The Properties Window provides various user settings for displaying spatial results. The Playback tab allows users to adjust the Frame Rate and an option to loop the animation. The Symbology tab provides options to change the output classification and colors as well as set min and max values. The Display tab allows users to adjust the spatial result transparency, add hill shade effects, or invert the color scheme. To better display the change in the cumulative precipitation, you can adjust the range of the cumulative depths.
- Select on the Symbology tab and select Stretch for the Symbology.
- For the Max value, change it from 50 to 10 inches. Click on Apply on the bottom right window. You should notice the Cumulative Precipitation legend range value change to a max value of 10 inches.
- Click on the green arrow in the Spatial Results toolbar to run the animation. You should notice to the right of the cog icon the Export Recording button is activated. Click on the Export Recording to begin recording. A red box will surround the button to indicate the animation is currently being recorded.

- While the animation is playing, you can zoom in or out of the basin. This will be shown in your recording.
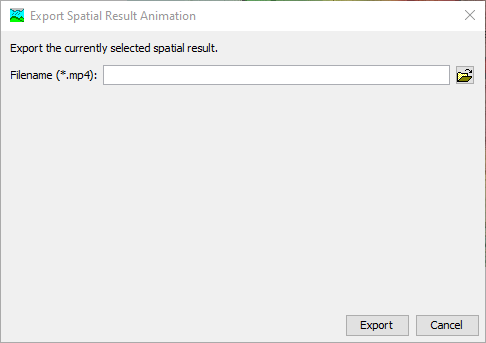
- When you are finished with your animation, click on the Export Recording button again to stop capturing the animation. An Export Spatial Results Animation Window will appear. Choose a name and location for the recording to be saved.

- A message should appear stating your exported Animation was successful.

- Choose another Spatial Result (i.e. Air Temperature or SWE) and experiment with various discretizations, color ranges, or Spatial Intervals.
Download Final Project Files Animation_Export_End.zip
Download Exported Recording ExportRecording Demo.zip