Download PDF
Download page Viewing Spatial Results for a Structured Discretization.
Viewing Spatial Results for a Structured Discretization
 MainstemColumbia.zip
 data.zip
 gis.zip
HEC-HMS 4.10 Beta 1 was used to create this tutorial. The above example project had to be broken up into multiple downloads due to file size limitations. After you download all three files to your computer, unzip them and then move the "data" and "gis" folders to the "MainstemColumbia" folder. The data folder should be located as follows "...\MainstemColumbia\data" and the gis folder should be located as follows "...\MainstemColumbia\gis". Do not attempt to open the MainstemColumbia project before correctly moving the "gis" and "data" folders.
The purpose of this tutorial is to provide information about the new spatial results option in HEC-HMS and provide an example dataset. The figure below shows the example project and the Spatial Results toolbar is highlighted. The Spatial Results toolbar includes options for selecting output results, an animation toolbar, buttons for controlling the animation, and an Animation Setting button that opens an editor with options for color ramps, scale, animation speed, and whether the animation should loop.
In order for spatial results to be computed, subbasin elements must be georeferenced. Spatial results will be displayed at the discretization level for the subbasin elements. For example, results will be displayed as subbasin averages when the None discretization method is selected. Results will be displayed on the SHG or UTM grid when the Structured discretization method is selected. Results will be displayed on the 2D mesh when the Unstructured discretization method is selected. The File-Specified discretization method offers mixed results whether results are displayed at the subbasin or grid level. When using a *.mod file and gridded modeling methods, the program will display results at the subbasin level since the *.mod file does not contain any geospatial information. The other File-Specified options will have results displayed on the structured or unstructured grid.
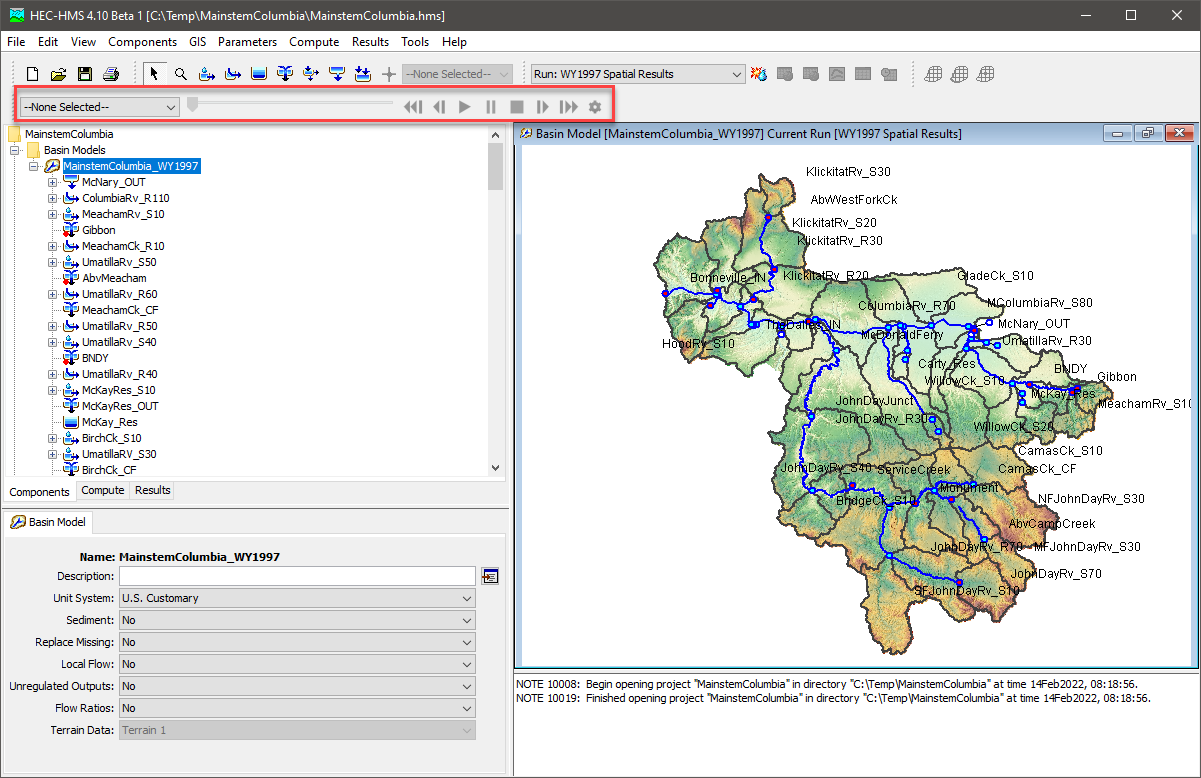
The following steps demonstrate how to turn on Spatial Results and how to use tools on the Spatial Results toolbar.
- Open the MainstemColumbia project using HEC-HMS 4.10 Beta 1, or a newer version. Open the MainstemColumbia_WY1997 basin model. Some of the GIS files had to be removed from the project due to file size limitations. Select the GIS | Preprocess Drainage menu option. The program will compute the flow direction and flow accumulation grids as part of the preprocess drainage step. This information is needed if the modeler changes information about the structured grid.
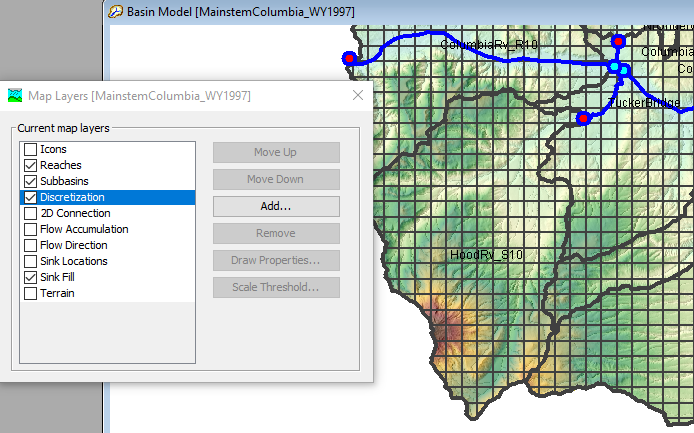
- The model domain is a portion of the Columbia River watershed. The model was configured to simulate part of the 1997 water year, from October 2, 1996 through May 31, 1997. Gridded precipitation, Gridded Hamon ET, and the Gridded Temperature Index methods were used to compute boundary conditions to the basin model. Subbasin elements were configured to use the Simple Canopy, Deficit and Constant Loss, ModClark Transform, and Linear Reservoir Baseflow methods. Model parameters were adjusted to calibrate the model to flow observations throughout the basin. All locations with observed flow are identified as Computation Points. HEC-GeoHMS was used to delineate subbasins and reaches; however, terrain data was added to this project and the flow direction and flow accumulation grids were created using the GIS tools in HEC-HMS. Then a Structured 2000-meter SHG was created using the GIS | Compute | Grid Cells tool. You can visualize the 2000-meter SHG by turning on the Discretization map layer as shown below.
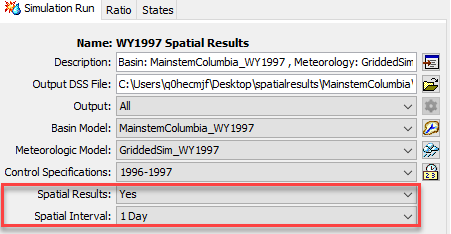
- Go to the Compute tab on the Watershed Explorer and click on the WY1997 Spatial Results simulation to open the Component Editor. As shown below, make sure the Spatial Results option is set to Yes. You will not be able to turn on Spatial Results if the subbasin elements are not georeferenced. By default, the output interval for spatial data is set to the simulation time step. This might generate too much output in some cases. For this example project, set the Spatial Interval to 1 Day.
- Run the simulation. The run time will be approximately 2 minutes.
- On the Spatial Results toolbar, select the results dropdown menu as shown below and choose Snow Water Equivalents (SWE).

HEC-HMS will build a cache of animation tiles the very first time you attempt to visualize spatial results. The message window below will pop up. Click Ok and then a progress dialog will open as shown below. It will take approximately 2 minutes for the animation tiles to be created. Again, results processing only happens the first time spatial results are viewed after running a simulation.

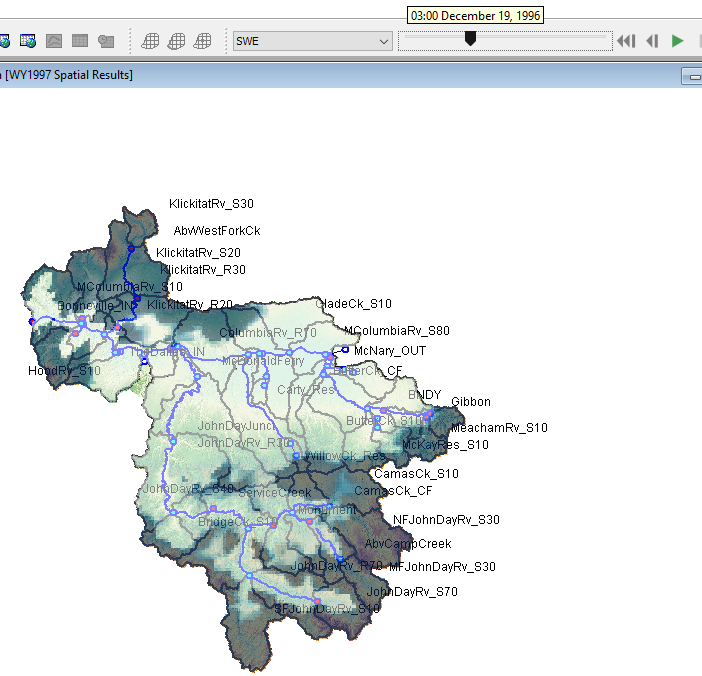
- As shown below, drag the animation slider bar to December 19, 1996 to see the accumulated SWE at that point in time. You can click the play button,
 , and the animation will loop through the simulation. You can see the SWE grow in the Fall and Winter as the snowpack becomes larger and then the SWE decreases in the Spring as the snowpack melts.
- Click the Animation Settings button,
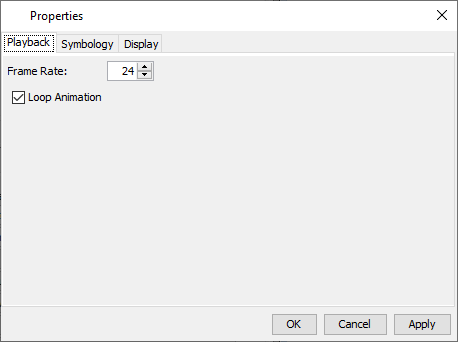
 , to open the Animation Properties editor as shown below. The editor contains options for controlling the speed of the animation, the symbology used to display results, and additional display settings.
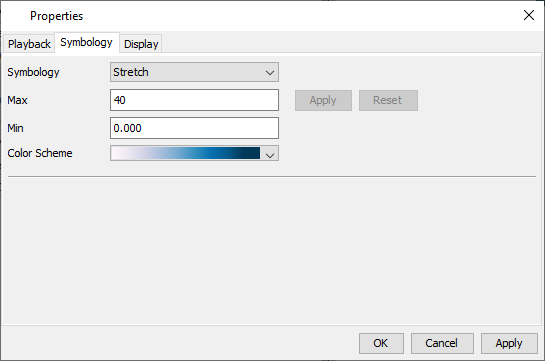
- Go to the Symbology tab. For SWE, select the Blue Color Scheme and set the Max value to 40 inches.
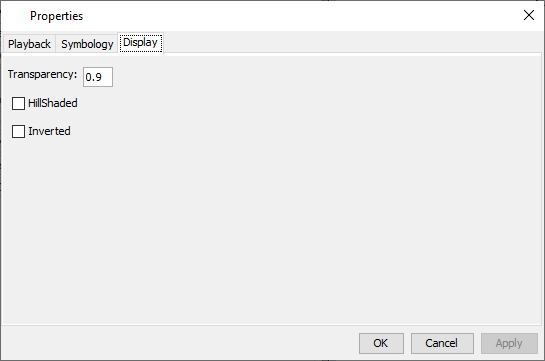
- Go to the Display tab. Set the Transparency to 0.9.
- Click the Apply and then Close buttons to close Animation Properties editor. Play the animation again to see the new color ramp for SWE results.
- Try choosing another result type and viewing the animation. After choosing another result type, you will likely need to edit the Symbology and Display properties for the selected output. The following figure shows the modified symbology and the incremental precipitation on December 3, 1996.
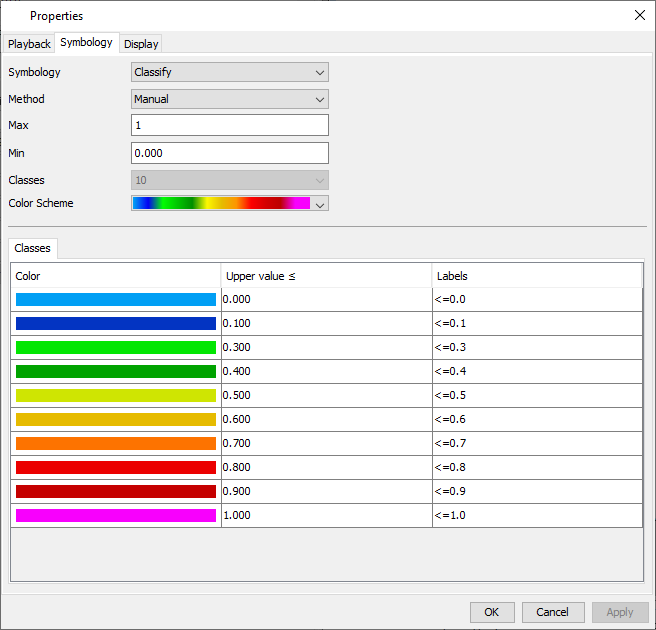
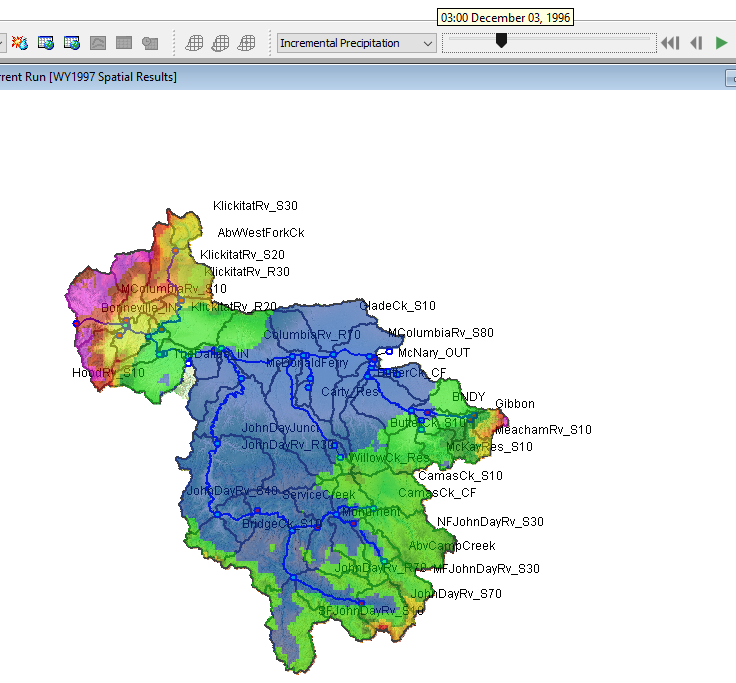
- As shown below, a tool tip is displayed at the location of the mouse pointer showing the value of the spatial results.
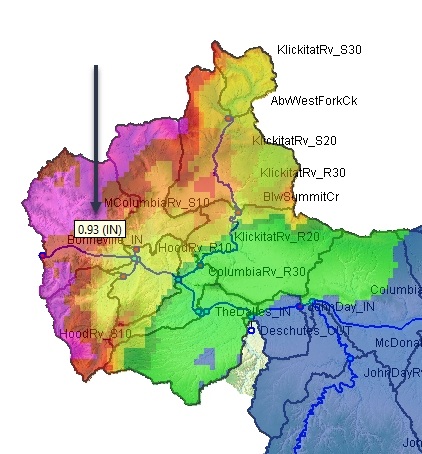
Viewing Calibration Results
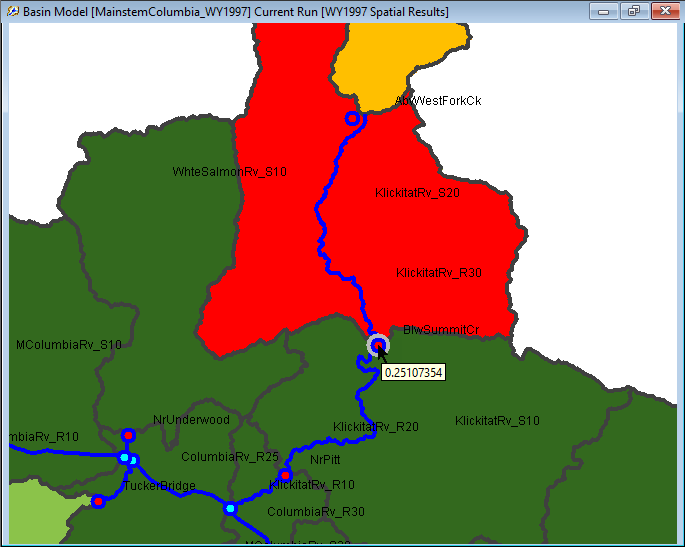
The Calibration Results can be visualized by choosing a statistical metric variable through the Spatial Results toolbar. When the variable has been chosen, the subbasins on the map are color-coded based on the predefined or custom range value that they fall into.
- On the Spatial Results toolbar, select the results dropdown menu as shown below and choose Flow - NSE.
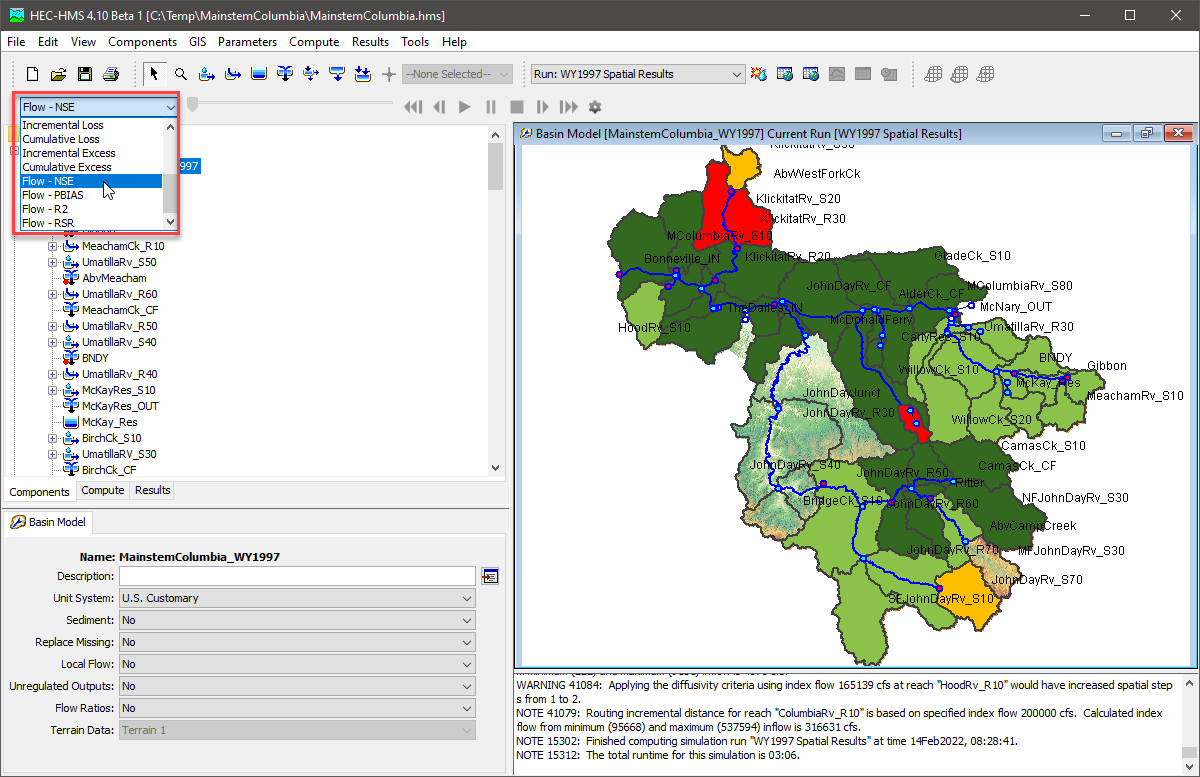
- Calibration results for the selected statistical metric can be viewed by hovering over an element in the Map Window as show in the figure below.
- The ranges and colors can be adjusted as previously shown by clicking the Animation Settings button,
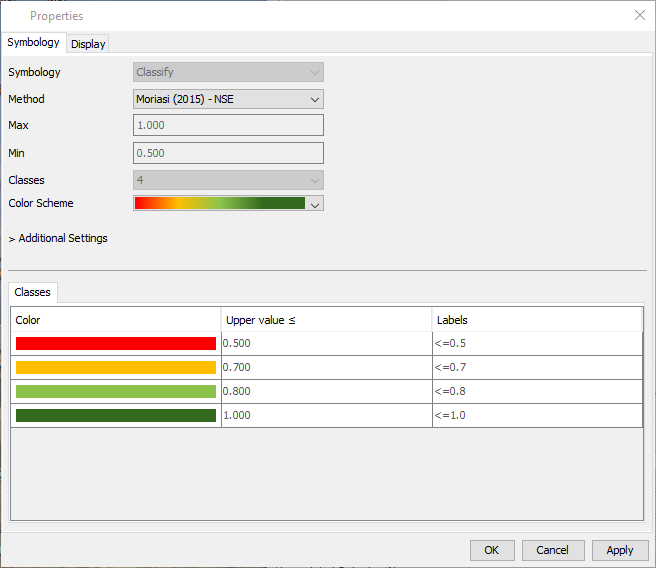
 . The default calibration visualizations reflect the criteria for statistical performance mentioned in Moriasi et. al. 2007 and Moriasi et. al. 2015. The Calibration Properties editor for Flow - NSE is shown below.