Download PDF
Download page Calculating Unregulated Time-Series using Reservoir Holdouts without a Hydrologic Model.
Calculating Unregulated Time-Series using Reservoir Holdouts without a Hydrologic Model
Overview
In this tutorial, a method of calculating unregulated time-series using reservoir holdouts without a hydrologic model is presented. The data used in this tutorial are for instruction purposes only and should not be used for further analysis.
HEC-DSSVue version 3.3 was used to create this tutorial.
Download the starting files here: Feather_River_Calculations.zip
Summary
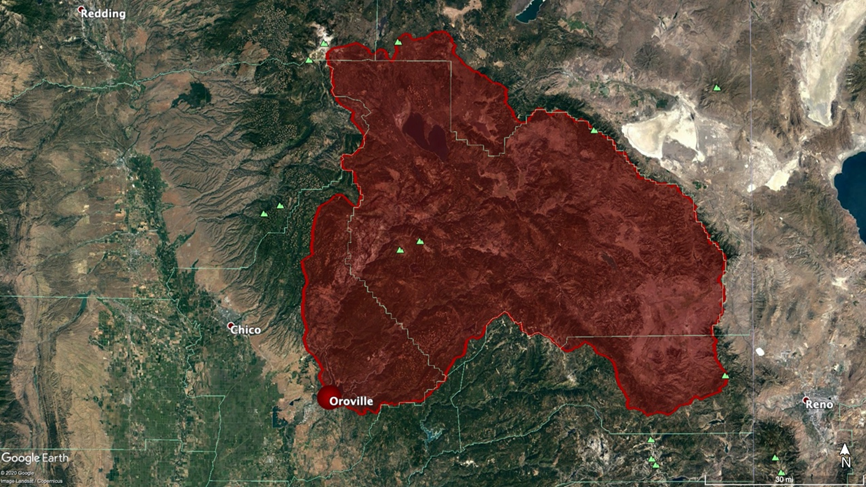
Oroville Dam is located on the Feather River, a major tributary of the Sacramento River. Construction of Oroville Dam began in June 1963 and was substantially completed by May 1968. The upper reaches of the Feather River watershed include the West Branch and South Fork, which lie on the western slope of the Sierra Nevada, and the North and Middle forks, which have headwaters on the Modoc Plateau in northeastern California.
The drainage area above Oroville Dam is approximately 3,611 square miles. Elevations in the watershed range from about 900 feet at the dam site to over 10,000 feet at Mount Lassen. The drainage area upstream of Oroville Dam is impacted by significant regulation. Most notably, 9 upstream reservoirs (in the order of construction date) that are summarized in the table below: Lake Almanor, Butt Valley, Mountain Meadows, Bucks Lake, Little Grass Valley, Sly Creek, Frenchman Lake, Antelope Lake, and Lake Davis.
Reservoir | Year Built | Start of Data Availability | Storage Capacity (ac-ft) | Percent of Headwater Storage | Drainage Area (mi2) | Percent of the Total Drainage Area at Oroville Dam |
Lake Almanor | 1913 | 1913 | 1,308,000 | 72.5% | 491 | 13% |
Butt Valley | 1924 | 1980 | 49,900 | 2.8% | 75 | 2% |
Mountain Meadows | 1924 | 2001 | 24,800 | 1.4% | 158 | 4% |
Bucks Lake | 1927 | 1928 | 103,000 | 5.7% | 29 | <1% |
Little Grass Valley | 1961 | 1963 | 93,000 | 5.2% | 26 | <1% |
Sly Creek | 1961 | 1962 | 65,000 | 3.6% | 24 | <1% |
Frenchman | 1962 | 1989 | 55,400 | 3.1% | 82 | 2% |
Antelope Lake | 1964 | 1989 | 22,600 | 1.3% | 71 | 2% |
Lake Davis | 1967 | 1988 | 83,000 | 4.6% | 44 | 1% |
It is desired to produce an unregulated time-series of flow for the Feather River downstream of Oroville Dam. For the purposes of this workshop, the effects of regulation from the three largest reservoirs (based on contributing drainage area) will be removed: Oroville Dam, Lake Almanor, and Mountain Meadows.
Daily flow data are available for the Feather River at Oroville, CA as early as 1901 from the USGS gage 11407000.
The file provided, Feather_River_Calculations.dss, contains daily storage data for Oroville Dam (1967–2021), Lake Almanor (1913–2021), and Mountain Meadows (2001–2021). The period of missing data for Mountain Meadows from 1924–2001 is considered negligible for the purposes of this tutorial.
Import Observed Stream Flow Data
The period of record of daily stream flow data for the Feather River at Oroville, CA will be obtained from USGS.
- Open the Feather_River_Calculations.dss file.
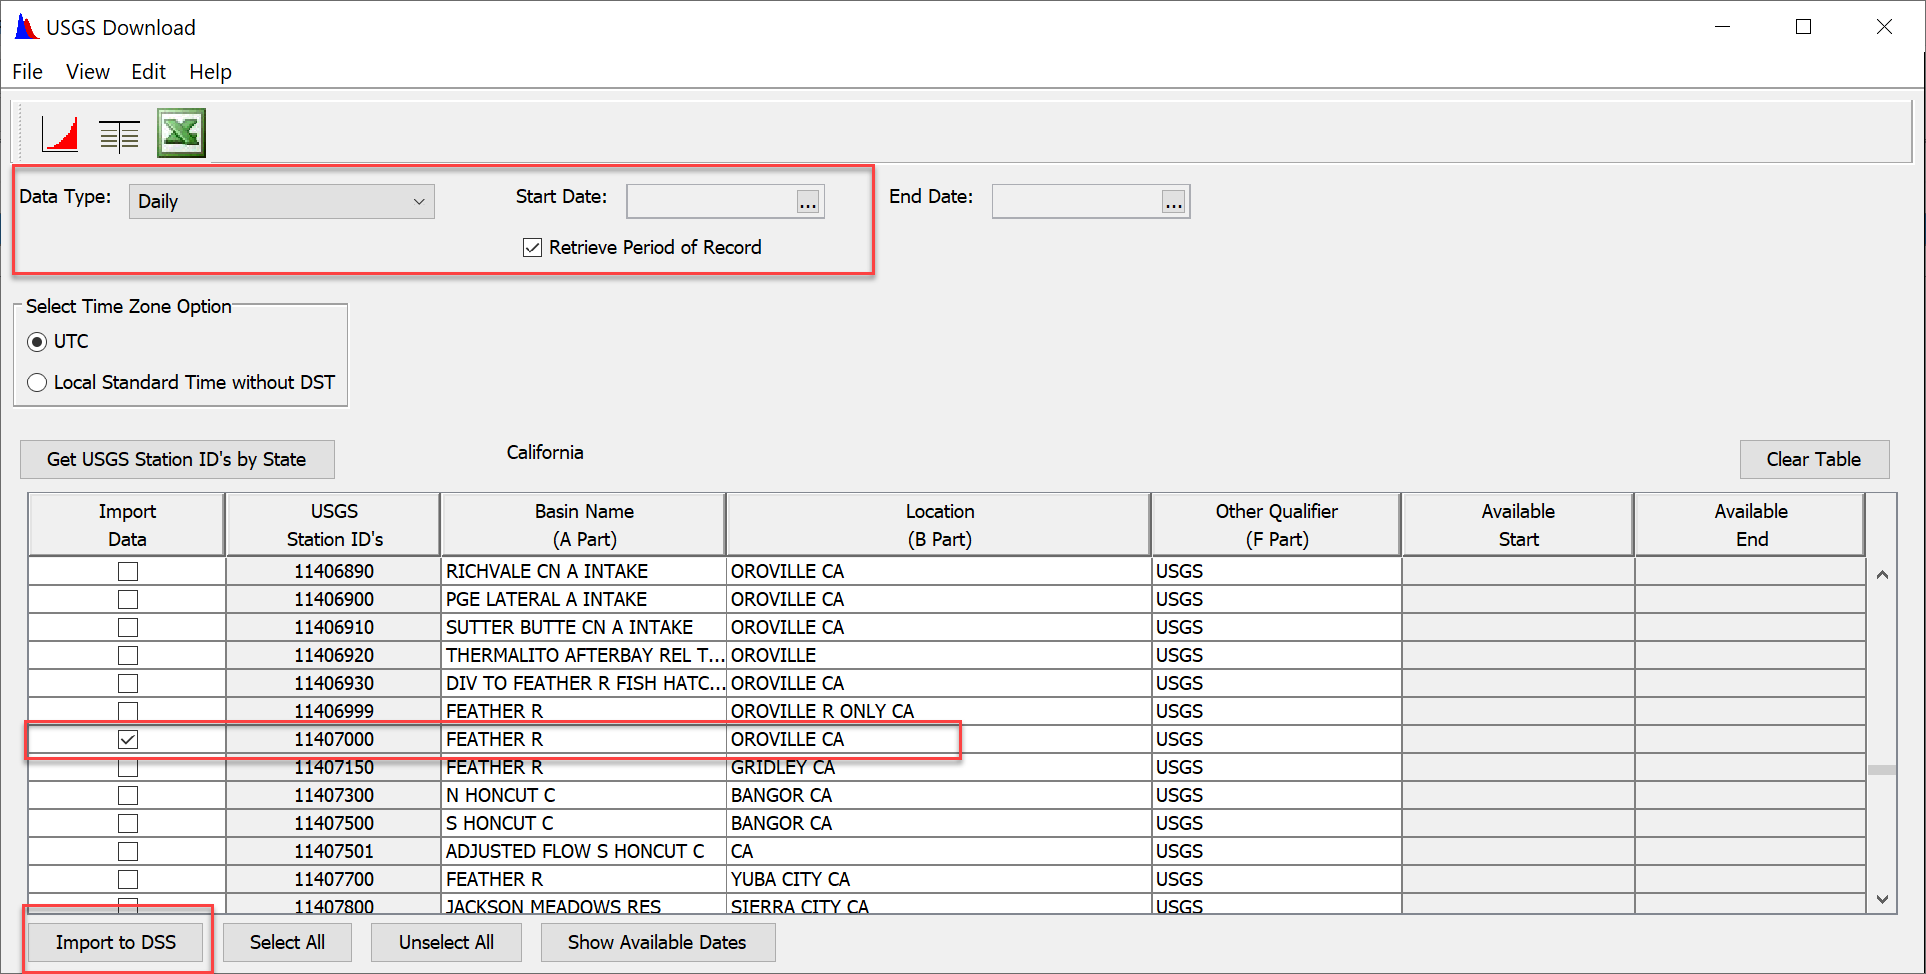
- Select Data Entry | Import | USGS Web to import data from the USGS.
- Select Daily as the Data Type. Check the box for Retrieve Period of Record.
- Select Get USGS Station ID's by State and navigate to California to display USGS stations available.
- Navigate to the FEATHER RIVER at OROVILLE, CA gage (11407000) and select Import to DSS.
The impacts of regulation can be clearly identified as a reduction in flow after the construction of Oroville Dam in 1967.

Calculate Reservoir Holdouts
Reservoir holdouts will be calculated as the incremental (daily) change in storage, converted from units of AC-FT/DAY to units of CFS.
- Select the Lake Almanor storage (LAKE ALMANOR/ALM/STOR) pathname and open the Tools | Math Functions.
- Under the Arithmetic tab, select the Successive Differences operator. This will calculate the change in storage for each day. Select Compute, then File | Save As to save the calculated data to a new pathname. Rename the new pathname with a C-Part of "STOR-DELTA" to represent the daily change in storage in AC-FT.
- Repeat the process for the Oroville Dam (OROVILLE DAM/ORO/STOR) and Mountain Meadows (MOUNTAIN MEADOWS/MMW/STOR) datasets. Remember to Save As after computing to prevent overwriting the data.
Now, perform units conversion from AC-FT/DAY to CFS.
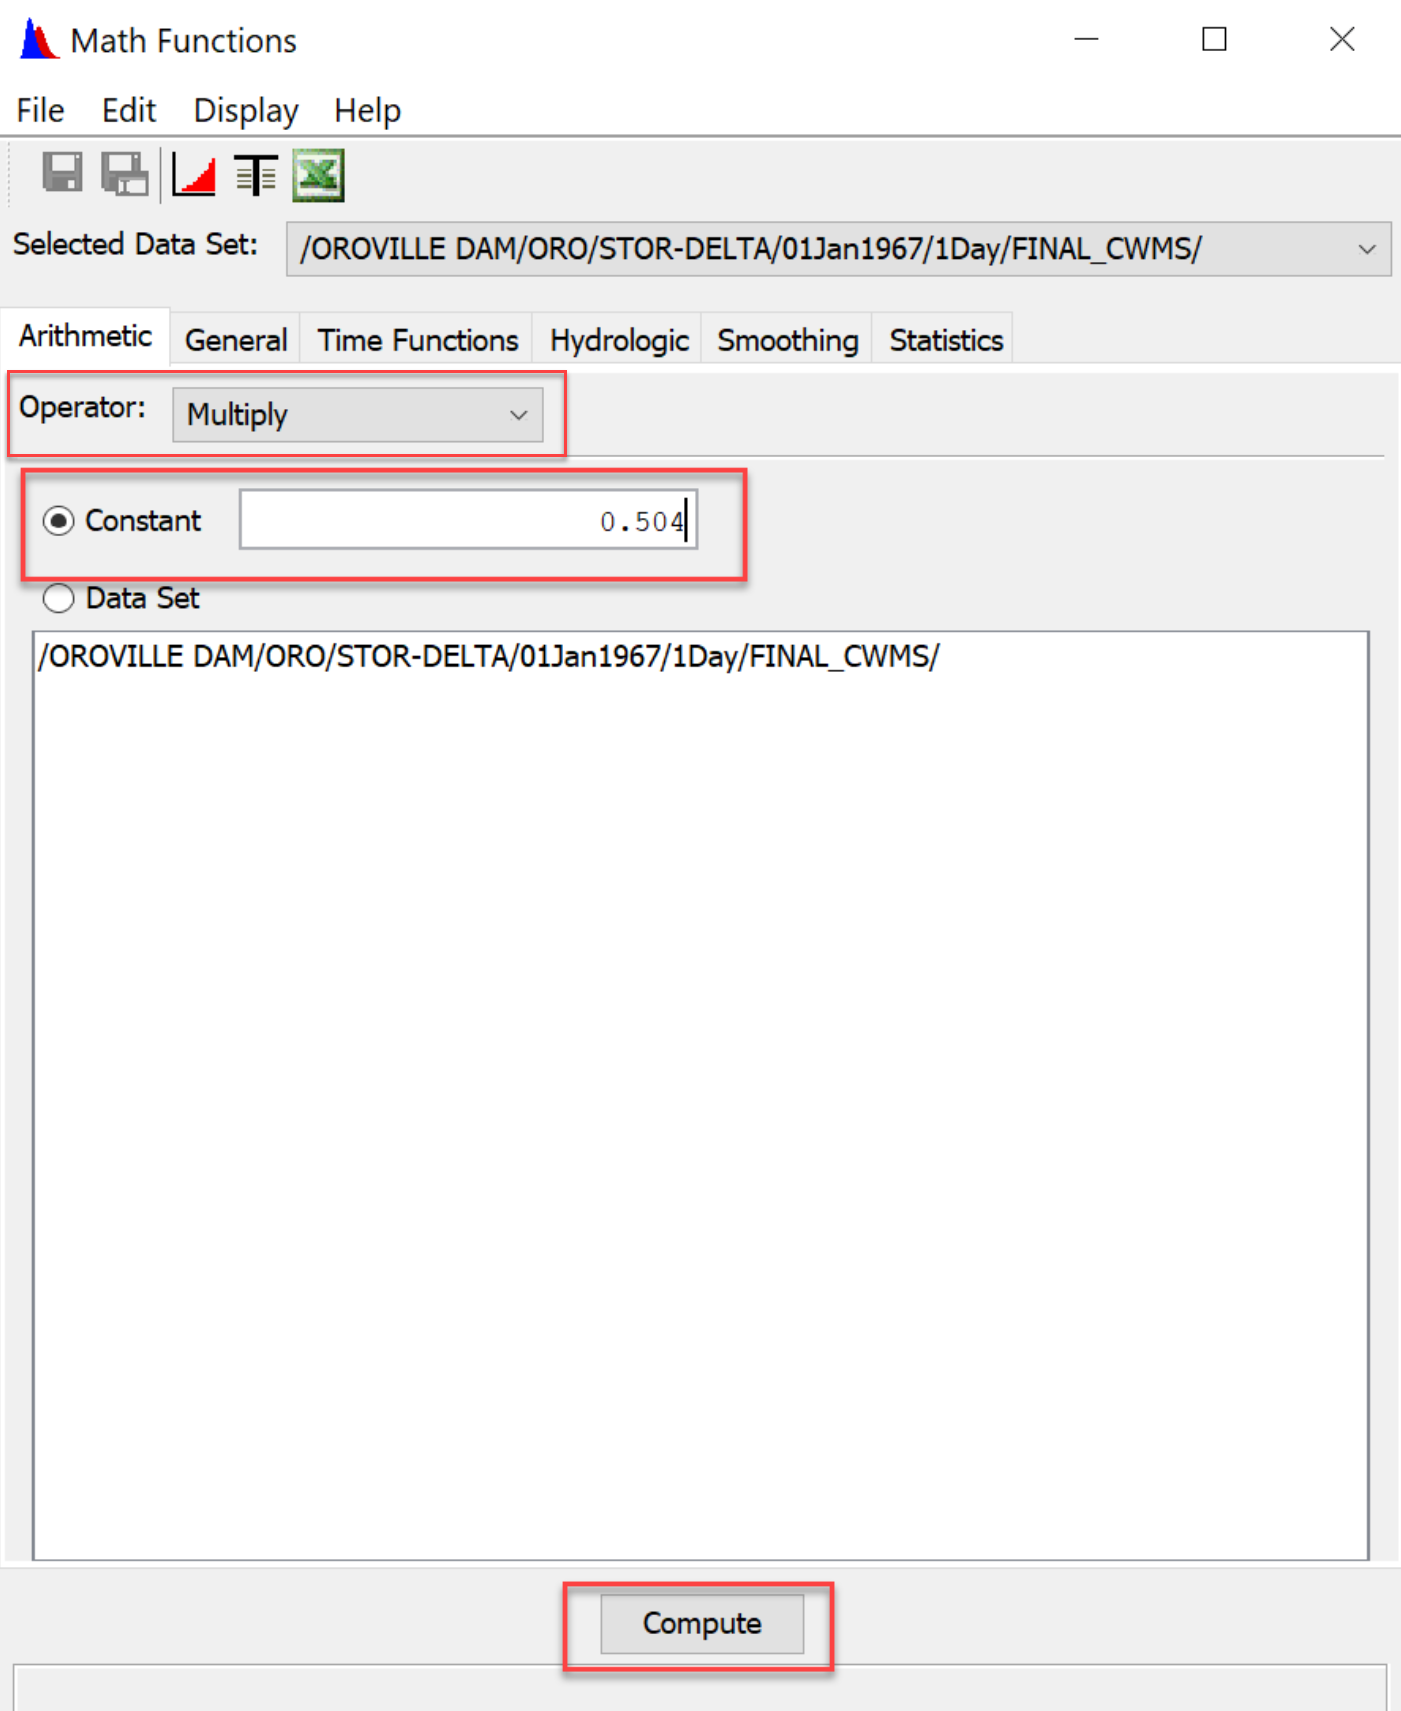
One AC-FT/DAY is equal to 0.504 CFS.
1 ac-ft = 43,560 ft3, and 1 day = 86,400 seconds
Therefore, (43,560 / 86,400) = 0.5042
- Select the change in storage data for Lake Almanor (LAKE ALMANOR/ALM/STOR-DELTA) that was just created. Open the Tools | Math Functions.
- Under the Arithmetic tab, select the Multiply operator. Input a constant value of "0.504". Select Compute, then File | Save As to save the calculated data to a new pathname. Rename the new pathname with a C-Part of "HOLDOUT" to represent the daily change in storage in CFS.
- The units will need to be changed from ACFT to CFS. Select the recently created pathname and open the tabular data. Select Edit | Tabular Edit. In the top right cell, change "ACFT" to "CFS". Then select File | Save to save the changes.
- Repeat the process for the Oroville Dam (OROVILLE DAM/ORO/STOR-DELTA) and Mountain Meadows (MOUNTAIN MEADOWS/MMW/STOR-DELTA) datasets.
Finally, lag the holdouts to account for travel time between the reservoirs and the analysis point. From prior analyses, the lag (in days) was determined as shown in the table below.
| Reservoir | Lag Time |
|---|---|
| Oroville Dam | 0 |
| Lake Almanor | 1 day |
| Mountain Meadows | 1 day |
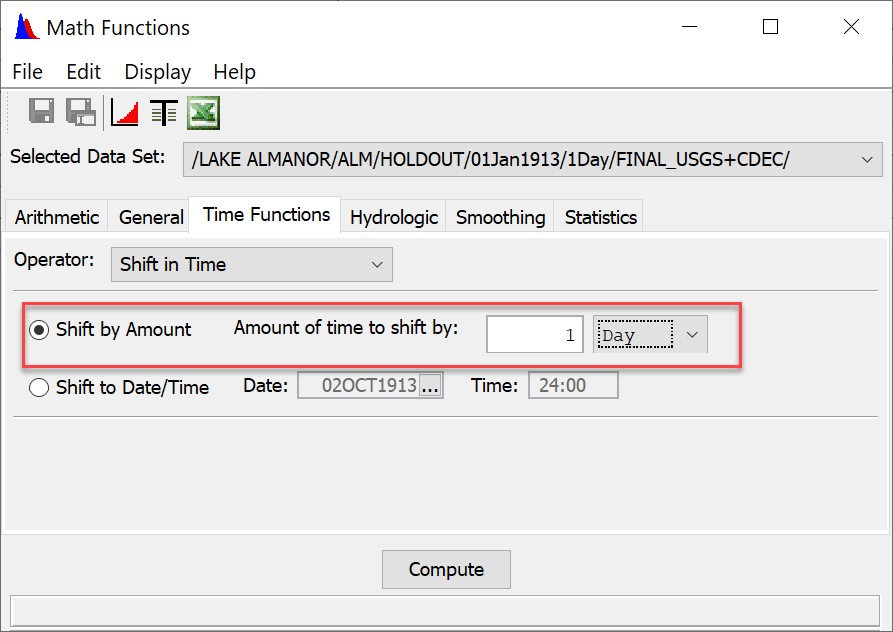
- Select the Lake Almanor holdout pathname (LAKE ALMANOR/ALM/HOLDOUT) and open the Tools | Math Functions.
- Under the Time Functions tab, select the Shift in Time Operator. Shift the data by +1 day as shown in the figure below. Select Compute, then Save As to save the calculated data to a new pathname. Rename the new pathname with a C-Part of "HOLDOUT+LAG" to represent the lagged holdout.
- Repeat the process for Mountain Meadows. Oroville Dam does not need a lag applied.
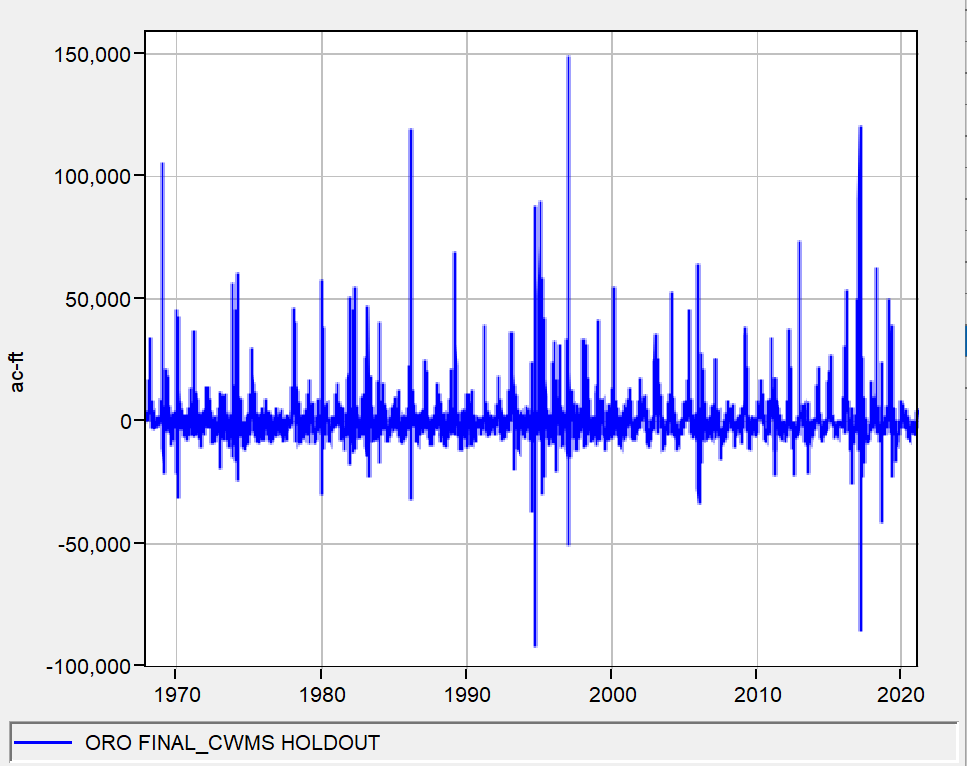
The holdout data contain negative values. This is expected, as the holdout data represent the daily change in reservoir storage. If the reservoir elevation increases, the change in storage is positive. If the reservoir elevation decreases, the change in storage is negative. A negative change in storage simply means the outflows from the reservoir exceeded the inflows. This occurs due to reservoir operations such as maintaining downstream flow for fish and recreation, or for releasing impounded flood waters after a storm has passed.
Calculate the Unregulated Flow Time-Series
The unregulated stream flow can be calculated by combining the observed (regulated) flow data with the lagged reservoir holdouts.
- Unregulated\,Flow\,at\,Gage = Lagged\,Reservoir\,Holdout + Observed\,Flow\,at\,Gage
- Double-click to select the observed Feather River flow and the three reservoir holdouts:
- FEATHER R/OROVILLE CA/FLOW
- LAKE ALMANOR/ALM/HOLDOUT+LAG
- MOUNTAIN MEADOWS/MMW/HOLDOUT+LAG
- OROVILLE DAM/ORO/HOLDOUT
- Open the Tools | Math Functions.
- Ensure the Selected Data Set is set to the Feather River at Oroville flow.
- Under the Arithmetic tab, set the Operator to Add. Select the Data Set radio button and highlight the three reservoir holdout datasets as shown below.
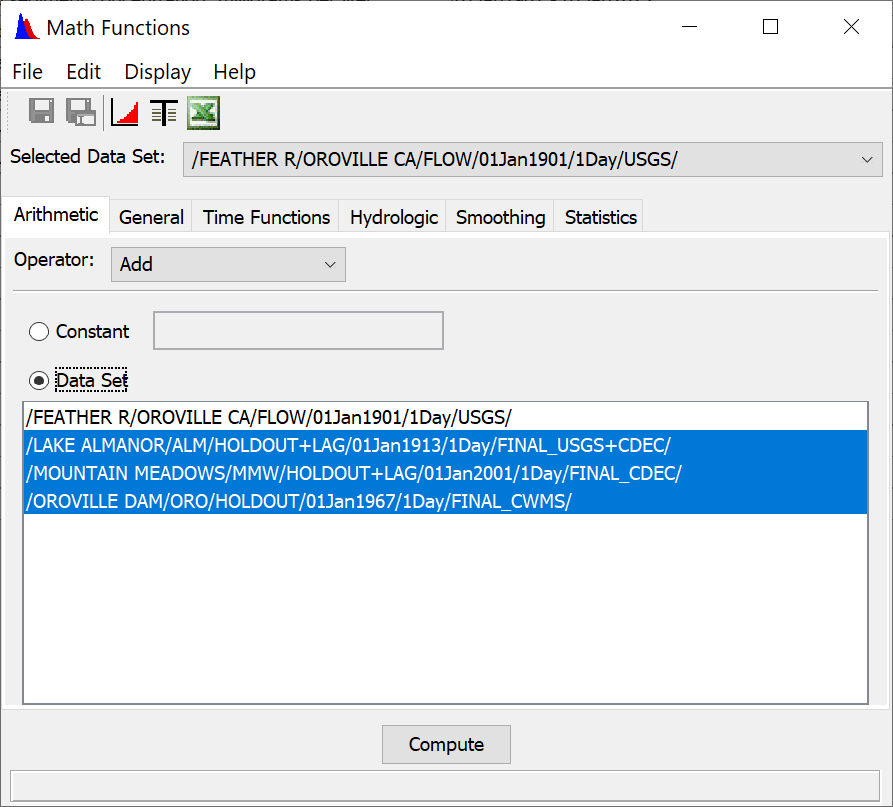
- Select Compute. Select Save As. Name the C-Part as "FLOW-UNREG" and the F-Part as "CALCULATED HOLDOUT".
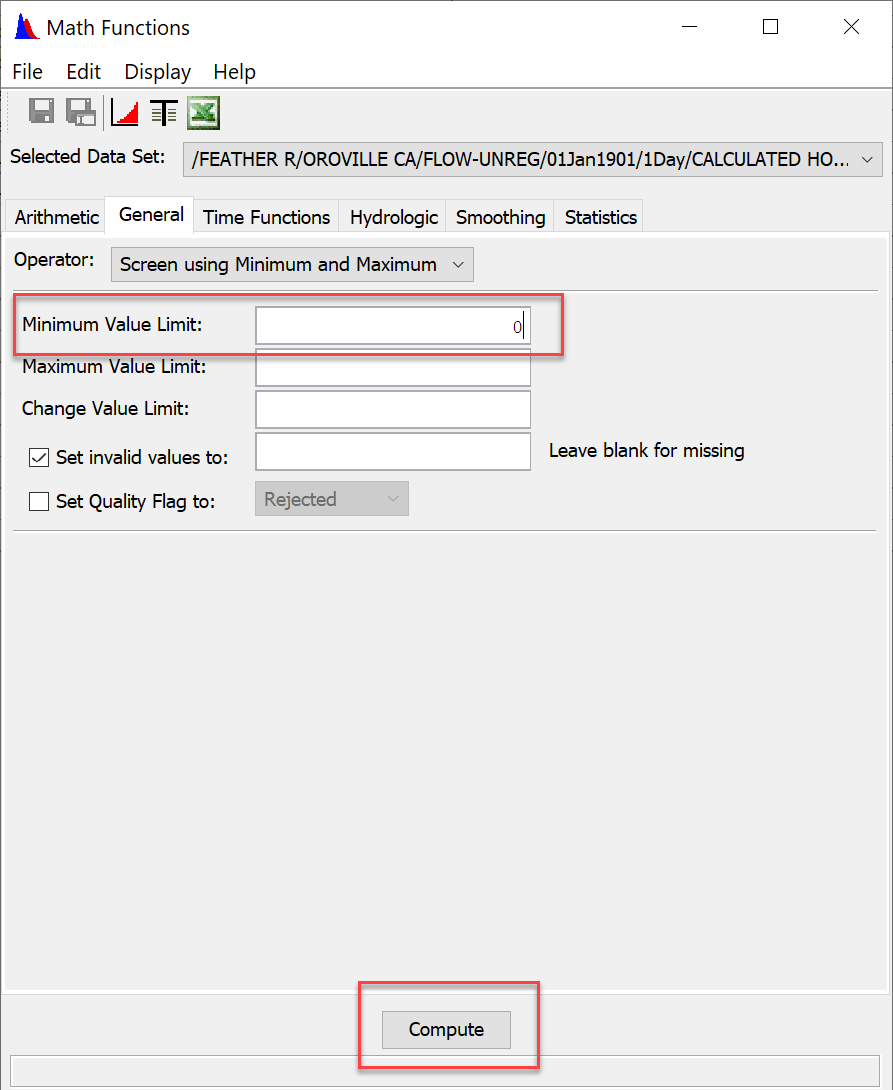
- After the unregulated flow is calculated, negative flows may persist. This is due to imprecise reservoir storage measurements as well as limitations in the estimation process (lack of hydrograph attenuation and lack of accounting for local flows). To screen out the negative flows, select the newly created FLOW-UNREG data set and open the Tools | Math Functions. Select the General tab and the Screen using Minimum and Maximum operator. Set the Minimum Value Limit to 0. Compute and save the dataset.
Comparison
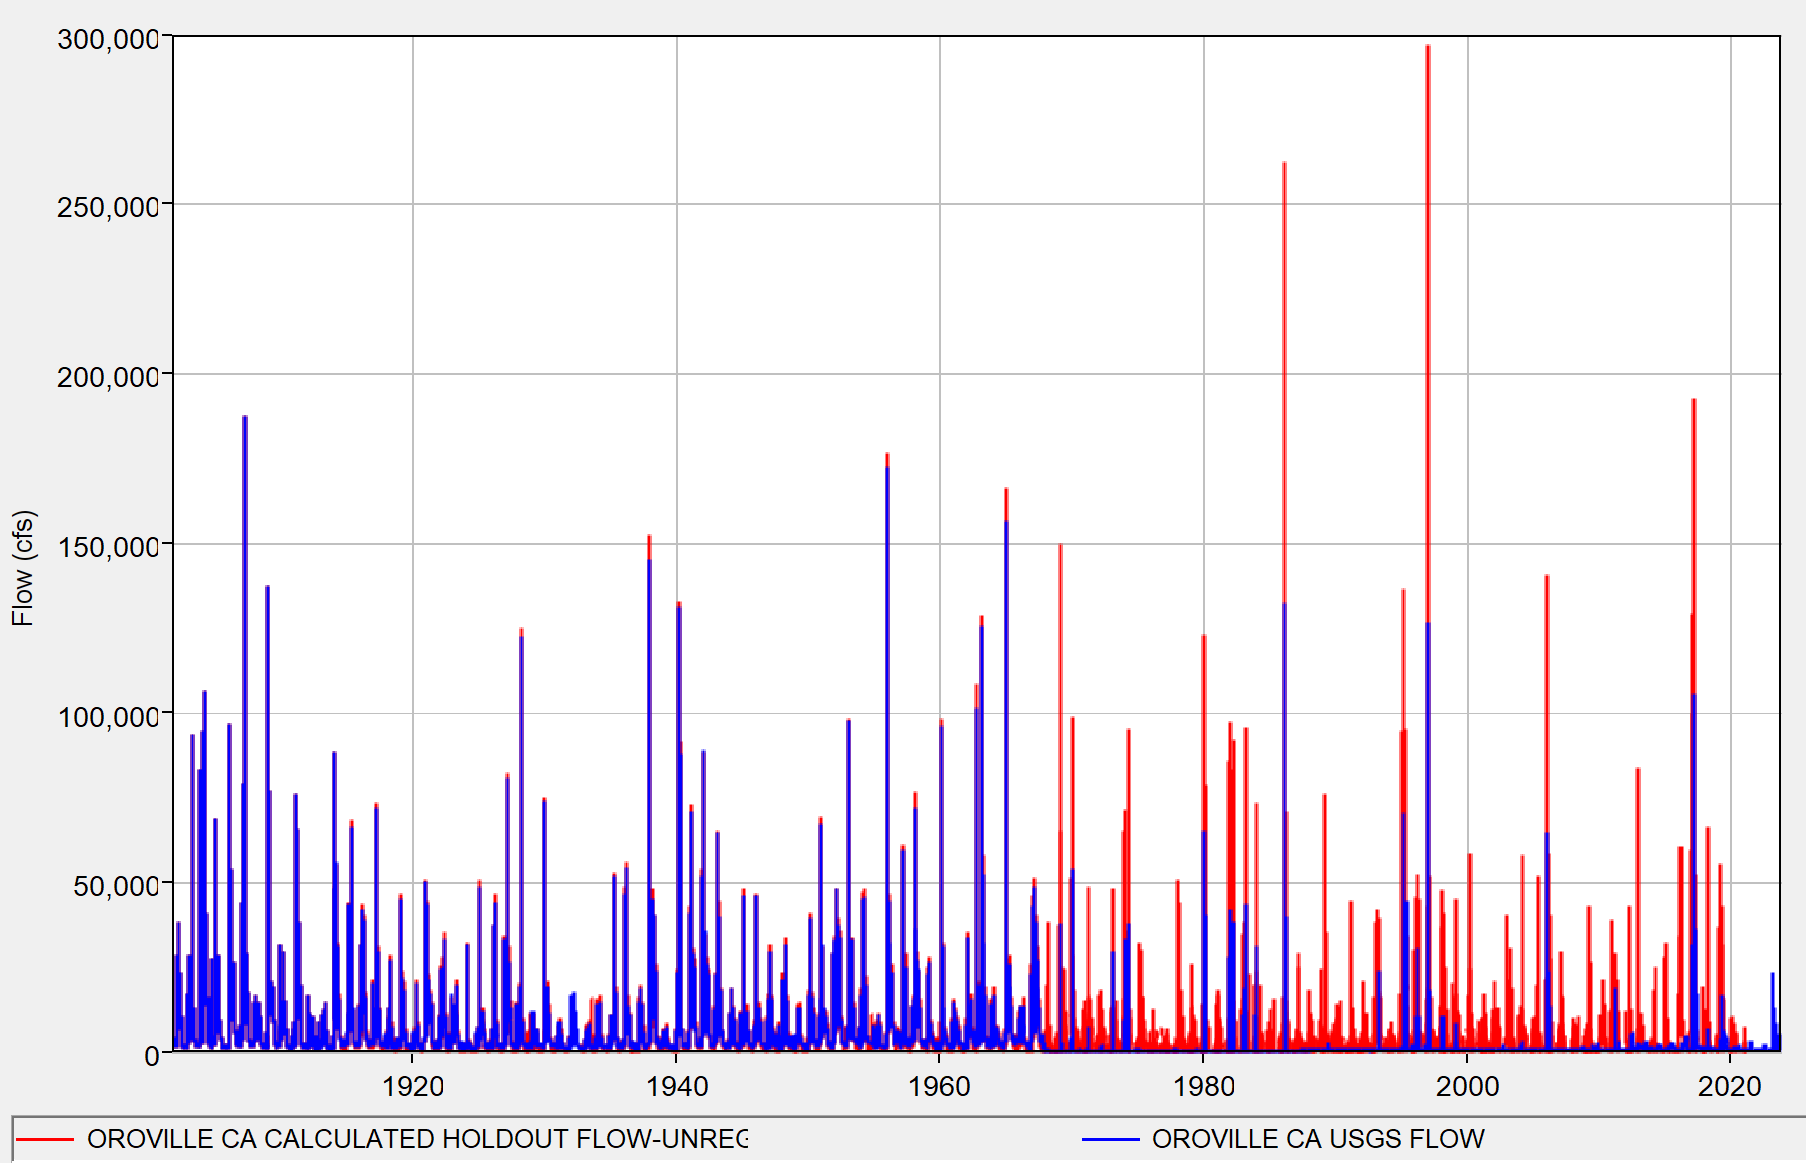
The plot of the calculated unregulated flow compared against the observed regulated flow is shown below. The majority of the flow regulation was contributed by Oroville Dam. The holdout contributions from Lake Almanor accounted for less than 5,000 cfs on average and no more than 20,000 cfs. The holdout contributions from Mountain Meadows accounted for less than 1,000 cfs on average and no more than 4,000 cfs. Although these individual contributions are minor, the contributions of all 9 upstream reservoirs combined can result in more significant effects.
While this method can quickly and effectively estimate unregulated flow, routing hydrographs using a hydrologic model would be preferable as it better accounts for local flows and hydrograph attenuation.
Download the final files here: Feather_River_Calculations_Finish.zip