Download PDF
Download page Hydrologic Routing of Reservoir Holdouts.
Hydrologic Routing of Reservoir Holdouts
A reservoir holdout is the volume of water that is temporarily stored by a reservoir. The holdout hydrograph is computed as the difference between the reservoir inflow and the reservoir outflow. The general procedure to route reservoir holdouts is:
- Calculate the reservoir holdout hydrograph using the following equation: Reservoir\,Holdout = Reservoir\,Inflow - Reservoir\,Outflow
- Route the reservoir holdout hydrograph to a gage of interest downstream.
- Add the routed reservoir holdout hydrograph to the observed flow hydrograph at the gage to obtain the unregulated streamflow hydrograph: Unregulated\,Flow\,at\,Gage = Routed\,Reservoir\,Holdout + Observed\,Flow\,at\,Gage
Compute the Reservoir Holdout Hydrograph
- Navigate to the HEC-HMS project directory and open the data folder: "...\Lehigh_River_HMS\data"
- Open the Lehigh_River_Discharge.dss file.
- Right click on the record with B-part of FEWALTER and select Duplicate. Change the C-part to FLOW and the F-part to HOLDOUT. Click the OK button.
- Select the newly created record with F-part HOLDOUT and the record with B-part WHITEHAVEN.
- Navigate to Tools | Math Functions.
- On the Arithmetic tab, select the HOLDOUT record in the Selected Data Set drop down menu.
- Select Subtract from the Operator drop-down menu.
- Select the Data Set radio button and the WHITEHAVEN record in the selection box.
- The Math Functions tab should look like the figure below. This selection will perform the following computation:Reservoir\,Holdout = Reservoir\,Inflow - Reservoir\,Outflow

- Click the Compute button. Check that "Compute Complete" appears on the bottom of the Math Functions window and then close the window. Click the Yes button to save changes.
- Select the F5 button to refresh the catalog.
Select the HOLDOUT record and plot it.

Notice that many of the holdout hydrograph values are less than zero. Negative values within the holdout hydrograph are the result of delayed releases from F.E. Walter Dam. For example, during the August - September 2011 event, peak inflow to the reservoir occurred on 29 August 2011 02:00 (see figure below). However, minimal releases were made from the reservoir during a 48-hour period spanning 27 to 29 August 2011 to decrease flood damages downstream. After the storm event dissipated, higher releases were made from the reservoir. During a 48-hour period spanning 30 August 2011 to 01 September 2011, reservoir releases exceeded reservoir inflow in an attempt to draw down the reservoir pool.

- Select the HOLDOUT record.
- Navigate to Tools | Math Functions. Select the General tab.
- From the Operator drop-down menu, select Screen using Minimum and Maximum.
Enter 0 in the Minimum Value Limit field. This will screen out values of the holdout hydrograph that are less than 0 cfs. The General tab should look like the figure below.
 Screening negative holdout values creates mass by discarding negative discharges. In the Comparison of Results section, you will see discrepancies in the unregulated hydrographs between the two hydrologic routing methods. The implications of these differences is discussed further in the Comparison of Results section.
- Check that "Compute Complete" appears on the bottom of the Math Functions window and then close the window. Click the Yes button to save changes.
- Select the F5 button to refresh the catalog.
- Select the HOLDOUT record and plot it. Notice that in the figure below all discharge values are equal to or greater than 0 cfs.

Route the Reservoir Holdout Hydrograph
- Open the HEC-HMS project.
- Select Components | Time-Series Data Manager.
- Select Discharges Gages from the Data Type drop-down menu.
- Click the New... button. Enter FEWalter_Holdout in the Name field. Enter an appropriate description and click the Create button.
- Expand the Time-Series Data folder in the Watershed Explorer. Expand the Discharges Gages folder and click on the FEWalter_Holdout time series gage.
- In the Component Editor, locate the Data Source drop-down menu. Select Single Record HEC-DSS.
- Select the Lehigh_River_Discharge.dss file in the DSS File Name field and DSS record with F-part HOLDOUT. The Time-Series Gage tab should look like the figure below.

- Save the project.
- Expand the Basin Models folder. Right click on the Lehigh_Route_Inflow basin model and select Create Copy.... Enter Lehigh_Route_Holdout as the name and click the Copy button.
- Expand the new basin model and right click on the FEWalter_Inflow source element. Select Rename.... Enter FEWalter_Holdout as the name.
- In the Component Editor, navigate to the Inflow tab and select FEWalter_Holdout from the Discharge Gage drop-down menu.
- Save the project.
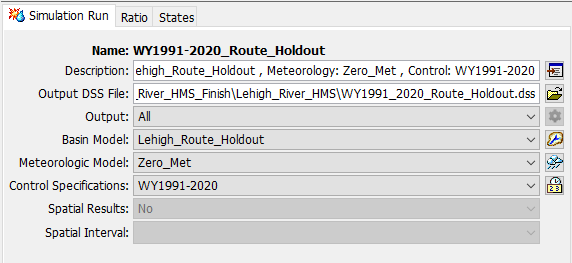
- Create a Simulation Run by selecting Compute | Create Compute | Simulation Run. Name the run WY1991-2020_Route_Holdout and select the Next button. Select the Lehigh_Route_Holdout basin model, the Zero_Met meteorologic model, and the WY1991-2020 control specifications on the following screens. Select the Finish button.
- Click the Compute button to run the simulation. The simulation should take approximately 40 seconds to finish.
- Close the HEC-HMS project.
Compute Unregulated Flow at the Lehighton Gage
- Navigate to the HEC-HMS project directory and open the WY1991_2020_Route_Holdout.dss file.
- Navigate to the following DSS record using the DSS part filters:
- File: WY1991_2020_Route_Holdout.dss
- Record Name: //LEHIGHTON/FLOW/30Sep1990 - 30Sep2020/1HOUR/RUN:WY1991-2020_ROUTE_HOLDOUT/
B-part: LEHIGHTON
C-part: FLOW
- After clicking a DSS record, click the Select button.
- Select Edit | Copy To from the top ribbon.
- Navigate to the Lehigh_River_Streamflow_Calcs.dss file and click the Open button. A window will appear indicating that the records have been copied. Click the OK button.
- Open the Lehigh_River_Streamflow_Calcs.dss file. If the file was already open, click the F5 keyboard button to refresh the catalog.
- Right click the record with F-part RUN:WY1991-2020_ROUTE_HOLDOUT and select Duplicate. Change the C-part to FLOW-UNREG and the F-part to COMPUTED_USING_HOLDOUTS. Click the OK button.
- Double click the following records: //LEHIGHTON/FLOW-OBSERVED/30Sep1990 - 30Sep2020/1Hour/RUN:WY1991-2020_ROUTE_OUTFLOW/ and //LEHIGHTON/FLOW-UNREG/30Sep1990 - 30Sep2020/1Hour/COMPUTED_USING_HOLDOUTS/
- Select Tools | Math Functions from the top ribbon.
- On the Arithmetic tab, select the FLOW-UNREG record in the Selected Data Set drop down menu.
- Select Add from the Operator drop-down menu.
- Select the Data Set radio button and the FLOW-OBSERVED record in the selection box.
- The Math Functions tab should look like the figure below. This selection will perform the following computation: Unregulated\,Flow\,at\,Gage = Routed\,Reservoir\,Holdout + Observed\,Flow\,at\,Gage

- Click the Compute button. Check that "Compute Complete" appears on the bottom of the Math Functions window and then close the window. Click the Yes button to save changes.
- Select the F5 button to refresh the catalog.
Continue to Comparison of Results.
Project Files
Download the final files at the bottom of the Comparison of Results page.