Download PDF
Download page Using the New MetSim Precipitation and Temperature Methods.
Using the New MetSim Precipitation and Temperature Methods
Software Version
HEC-HMS version 4.12-beta.6 was used to create this example. You can open the example project with HEC-HMS v4.12 or a newer version.
The Bohn, et al. (2019) precipitation storm time to peak and storm duration grids can be downloaded here: Bohn_etal_2019_grids.dss
Overview
This tutorial demonstrates the usage of the new MetSim precipitation and temperature methods. These methods were added within HEC-HMS v4.12 and allow for a more effective usage of daily meteorological boundary conditions when combined with sub-daily computational time steps.
Introduction
While the availability of reliable fine temporal resolution gridded precipitation and temperature data sets have increased in recent years, their period of record (POR) is still relatively short when compared to coarse temporal resolution gridded data sets. An example of a reliable fine temporal resolution data set is the AORC precipitation and temperature gridded data sets which have a 1 hour temporal resolution and a POR of 44 years (1979 - present). Conversely, an example of a reliable coarse temporal resolution data set is the Livneh CONUS Near-Surface Gridded Meteorological and Derived Hydrometeorological Data (Livneh et al., 2015), which has a temporal resolution of 1 day and a POR of 96 years (1915-2011).
In order to effectively utilize these coarse temporal resolution data sets for relatively small watersheds (i.e., < 1000 square miles), sub-daily computational time steps on the order of 1 hour or less are required. Previous versions of HEC-HMS uniformly disaggregated these data sets to the computational time step. In the images below, the daily temporal resolution boundary condition data has been uniformly disaggregated to a 1 hour time step. This had the effect of "dampening" the computed runoff response when simulating the precipitation-runoff process. In other words, computed peak discharges, reservoir pool elevations, etc. were typically much less than that which were actually observed.
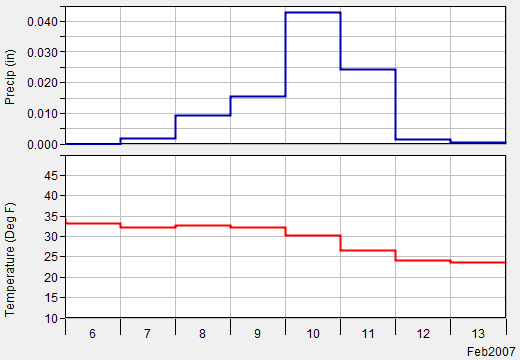
Two new meteorologic model methods were added within HEC-HMS v4.12 to better simulate the precipitation-runoff response for relatively small watersheds at sub-daily time steps when using daily temporal resolution gridded data. These two new methods are described below.
MetSim Precipitation Method
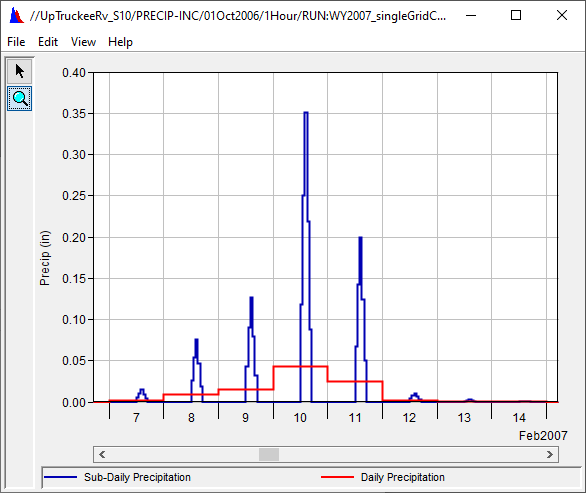
The MetSim Precipitation method, as implemented within HEC-HMS, follows that which is described in Bohn, et al (2019). In essence, this method converts a daily precipitation accumulation to sub-daily time steps through the use of an isosceles triangular-shaped temporal distribution. Daily precipitation grids, a storm duration parameter, and a storm time to peak parameter must be specified when using this method. The base width of the triangle is equivalent to the storm duration parameter while the triangle's time of peak is equivalent to the storm time to peak parameter. An example demonstrating this method is shown in the following figure where input daily precipitation (red line) was disaggregated to a sub-daily hyetograph (blue line).
MetSim Temperature Method
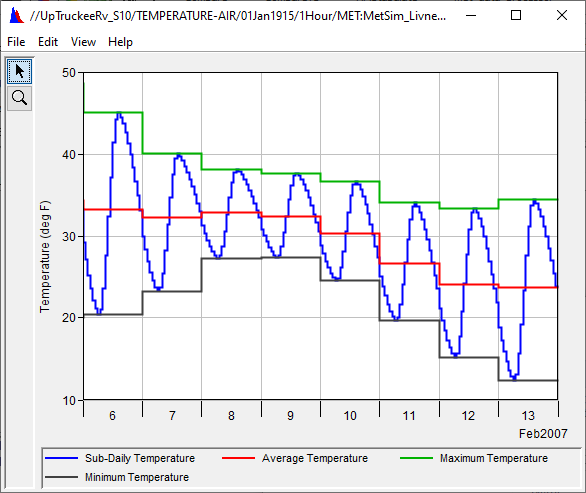
The MetSim Temperature method, as implemented within HEC-HMS, follows that which is described in Bohn, et al (2013). In essence, this method converts daily minimum and maximum temperature to sub-daily time steps through the use of a spline function. Daily minimum and maximum temperature grids in addition to an assumed time of maximum daily temperature must be specified when using this method. An example demonstrating this method is shown in the following figure where input daily minimum (black line) and maximum (green line) temperatures were disaggregated to a sub-daily temperature time series (blue line). The average temperature (red line) is shown for reference.
Example Watershed
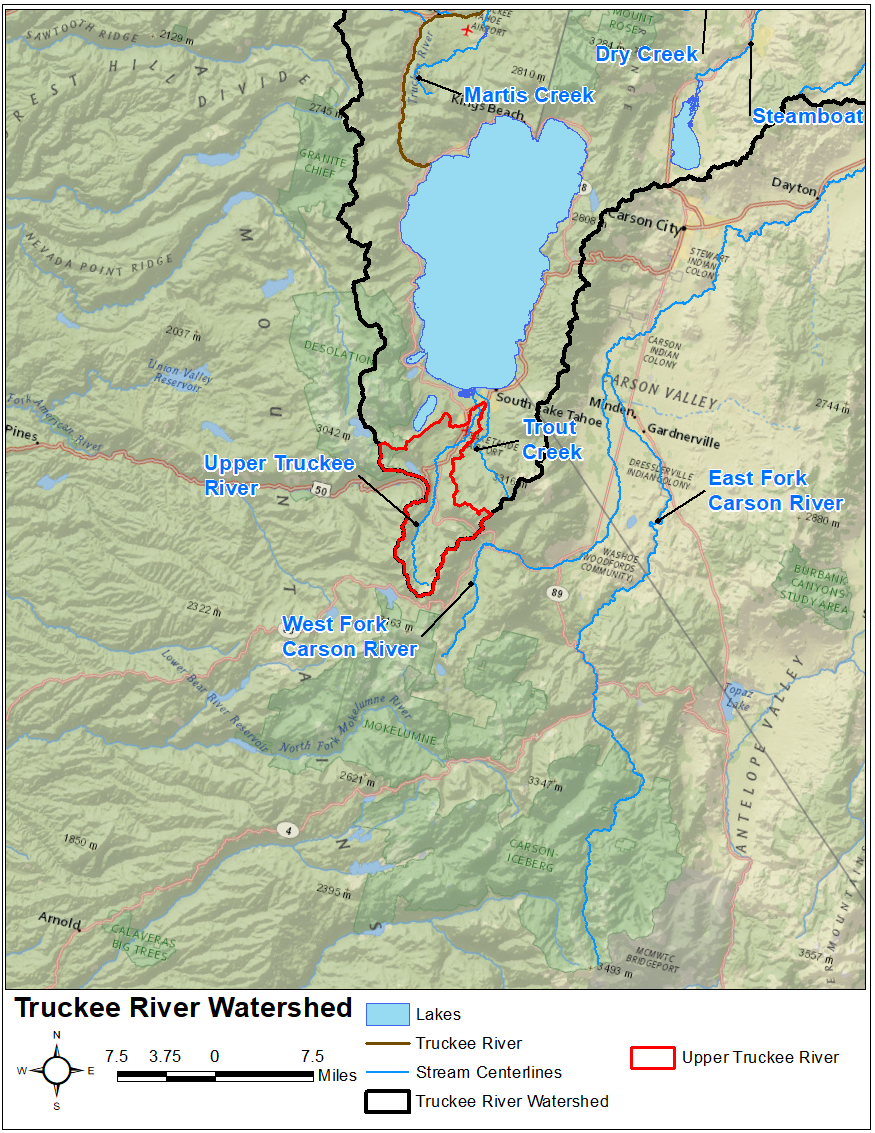
In this tutorial, the study area is designated as the Upper Truckee River watershed upstream of the USGS stream gage at South Lake Tahoe, CA. The Upper Truckee River watershed is part of the larger Truckee River watershed. The Truckee River originates as the Lake Tahoe outlet in California and flows approximately 105 miles north and east into Nevada. Major population centers within the Truckee River watershed include the cities of Truckee, CA, Reno, NV, and Sparks, NV with a total population greater than 350,000 (as counted during the 2010 census). While the Truckee River provides a major source of water for its nearby inhabitants, the river is also prone to significant flooding. Substantial damage has occurred during large scale and widespread rain-on-snow flood events in 1996-1997, 2005-2006, and 2016-2017 (amongst others). Numerous state and federal water supply and flood risk management projects have been constructed within this watershed. Several major federally-constructed projects include Martis Creek, Prosser, Stampede, and Boca dams, as shown below.
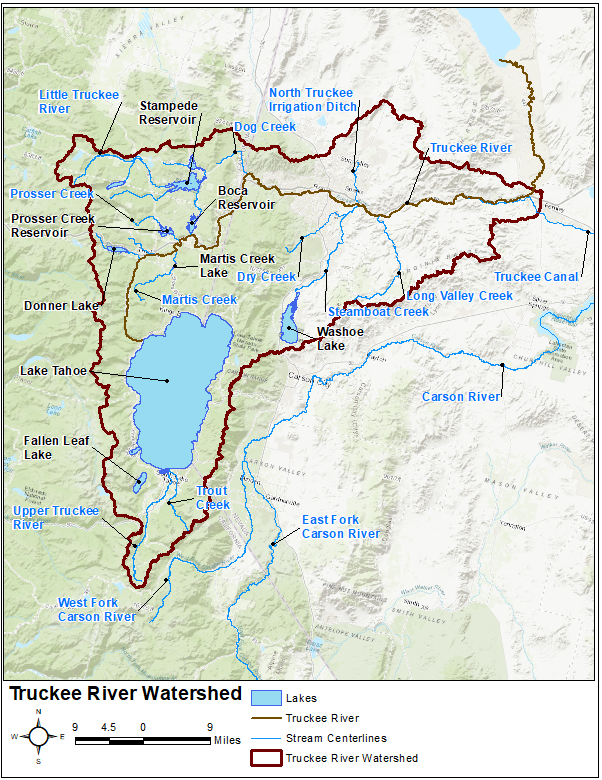
The Upper Truckee River watershed encompasses an approximate 54 square mile (sq mi) drainage area upstream of Lake Tahoe, as shown below.
Review Existing HEC-HMS Project
An HEC-HMS project named Upper_Truckee_River has already been created for you. This HEC-HMS project contains a Basin Model named MetSim_TI, several Control Specifications, several Time Series gages, several Grid Sets, and a Terrain. As shown below, there is one subbasin element named UpTruckeeRv_S10 which is connected to a junction element named SouthLakeTahoe within the existing basin model. This subbasin was originally delineated using terrain data downloaded from the USGS National Map Viewer.
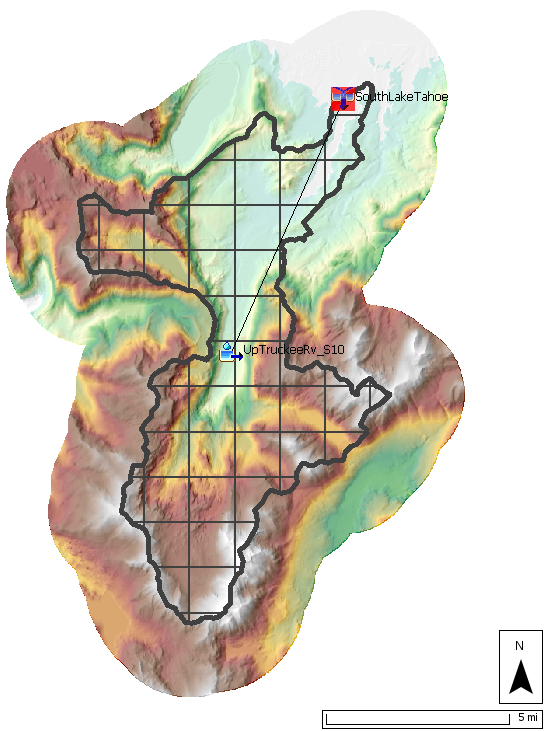
The subbasin element was configured to use a 2000-meter SHG Structured discretization, Simple canopy, Gridded Temperature Index snow, Deficit and Constant losses, ModClark unit hydrograph transform method, and Linear Reservoir baseflow. The previously-mentioned observed SWE and discharge time series were linked to the subbasin and junction elements as observed time series, respectively.
Data
The following boundary conditions and observed data were collected and imported to the existing HEC-HMS project:
| Data Type | Source |
|---|---|
| Daily Precipitation Accumulation | Livneh |
| Daily Minimum, Maximum, and Average Air Temperature | Livneh |
| Daily Average Streamflow | South Lake Tahoe USGS gage |
<Grids and time series have been created for each of the aforementioned data sets>
Create a New Meteorologic Model
Create a new Meteorologic model that uses the MetSim Precipitation and Temperature methods.
- Open the HEC-HMS project.
- Once the project opens, select Components | Meteorologic Model Manager | New....
- Enter MetSim_Livneh as the Name. Click Create to finalize the creation of this new Meteorologic Model.
- In the Watershed Explorer, expand the Meteorologic Models folder and select the MetSim_Livneh node.
- Set the Unit System to U.S. Customary.
- Set the Replace Missing option to Set To Default.
In the Component Editor, select and parameterize the following methods:
Process Method
Grid/Parameterization
Precipitation MetSim Precipitation Grid: Livneh_daily
Storm Characteristics Method: Annual Pattern
Storm Duration: Storm_Duration pattern
Storm Time to Peak: Storm_Time_to_Peak pattern
Temperature MetSim Temperature Grid: Livneh_dailyAverage
Time of Max Temperature: 1340 hours
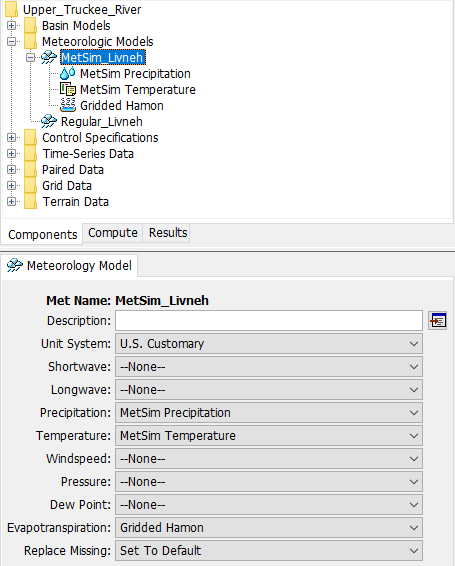
Evapotranspiration Gridded Hamon Coefficient: 0.0065 - The MetSim_Livneh Component Editor should resemble the following image:
MetSim Precipitation Parameters
- Click on the MetSim Precipitation node to open the MetSim Precipitation Component Editor.
- Select the Livneh_daily precipitation gridset within the Grid Name combo box.
- Leave the Time Shift Method set to None.
- Ensure the Bohn et al. 2019 Temporal Disaggregation method is selected.
- Select the Annual Pattern Storm Characteristics Method.
- Select the Storm_Time_to_Peak and Storm_Time_to_Peak patterns.
These values were extracted from grids that were originally produced within Bohn, et al (2019). Storm duration and storm time to peak values for each month of the year were derived from meteorological observations at U.S. Climate Reference Network stations and extended across the United States, Mexico, and southern Canada. Storm duration and storm time to peak grids were then produced using at a 6 km spatial resolution. The original NetCDF grids were converted to DSS and provided here: Bohn_etal_2019_grids.dss. Parameter Value Patterns were used to define these parameters which allows them to vary from month to month and repeat each year. The patterns were defined to follow a stepped or period-averaged pattern, as dictated within Bohn, et al (2019).
MetSim Temperature Parameters
- Click on the MetSim Temperature node to open the MetSim Temperature Component Editor.
- Select the Livneh_dailyMin and Livneh_dailyMax gridsets within the Daily Min Temperature and Daily Max Temperature combo boxes, respectively.
- Enter 960 minutes in the Time of Max Daily Temperature entry field.
Typically, the low and high temperatures at a specific location occur at a predictable time of the day. The low temperature occurs at or near the solar sunrise while the high temperature occurs in the early to mid afternoon, as shown in the following figure:
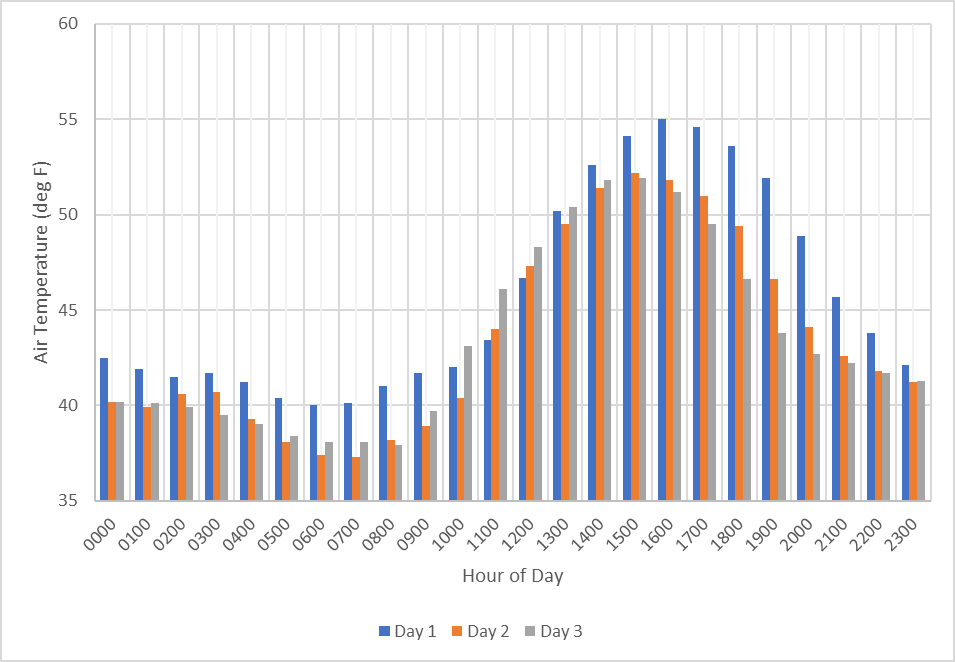
960 minutes corresponds to 1600 PST (i.e., 4PM local time) within the Upper Truckee River watershed.
- Leave the Time Shift Method set to None.
Simulate the WY1972 - WY2011 Time Period
Now, simulate the time period spanning WY1972 - WY2011. This time period aligns the available periods of record for both the Livneh gridded meteorological boundary conditions and the USGS streamflow data at the South Lake Tahoe gage.
This simulation could be used to calibrate land surface process parameters (e.g., snow, loss, transform, baseflow, etc.) using observed data. Example tutorials documenting the calibration process for a continuous simulation model can be found here: Calibrating a Continuous Simulation Model.
- Create a new Simulation named C1972-2011_MetSim_Livneh.
- Select the MetSim_TI basin model, MetSim_Livneh meteorologic model, and WY1972-WY2011 control specifications.
- Run the C1972-2011_MetSim_Livneh simulation by clicking the Compute All Elements button
 .
. - This compute will take approximately 4 minutes to finish.
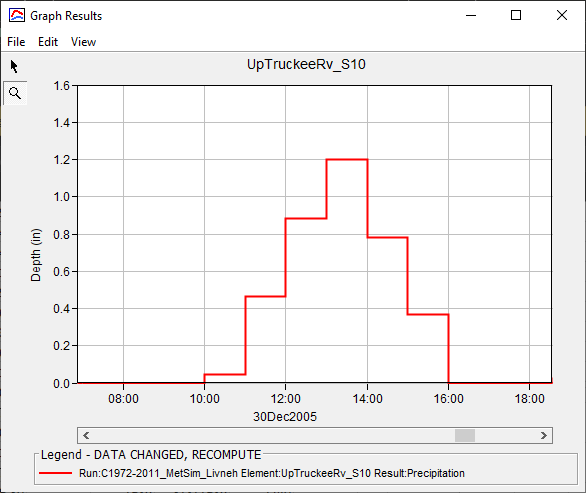
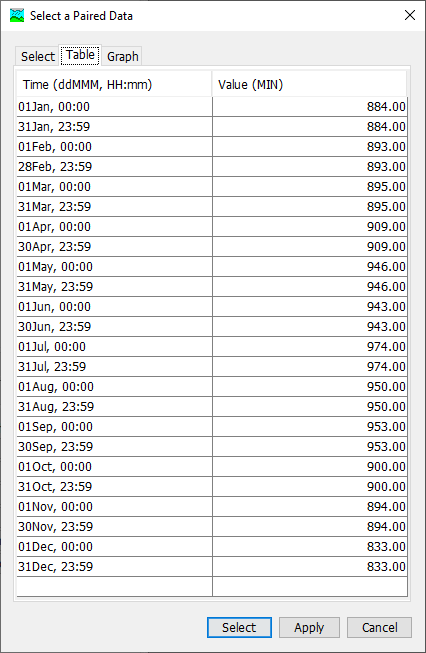
Question: What is the approximate storm duration and storm time to peak on 30Dec2005? What is the approximate storm duration and storm time to peak on 28Jun2006? How did you find this information?
The storm time to peak and storm duration for 30Dec2005 is approximately 13:00 (830 minutes) and 6 hours (360 minutes), respectively. The storm time to peak and storm duration for 28Jun2006 is approximately 15:00 (945 minutes) and 3 hours (180 minutes), respectively. This information can be found by investigating the hyetograph for the UpTruckeeRv_S10 subbasin and/or the Parameter Value Patterns, as shown in the following images:
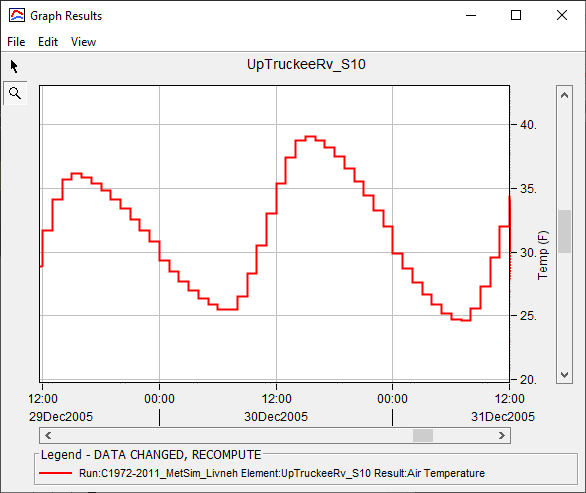
Question: What is the approximate time of the daily minimum and maximum temperatures on 30Dec2005? What is the approximate time of the daily minimum and maximum temperatures on 28Jun2006? How did you find this information?
The daily minimum and maximum temperatures on 30Dec2005 are approximately 0700 and 1500, respectively. The daily minimum and maximum temperatures on 28Jun2006 are approximately 0400 and 1500, respectively. This information can be found by investigating the thermograph for the UpTruckeeRv_S10 subbasin or grid cell of interest (if spatial results were computed), as shown in the following image:
Question: Why do the daily minimum temperatures for 30Dec2005 and 28Jun2006 differ?
The daily minimum temperature on 30Dec2005 occurs approximately 3 hours later than the daily minimum temperature on 28Jun2006. This is due to the difference in solar sunrise time (the sun rises later in the winter than in the summer).
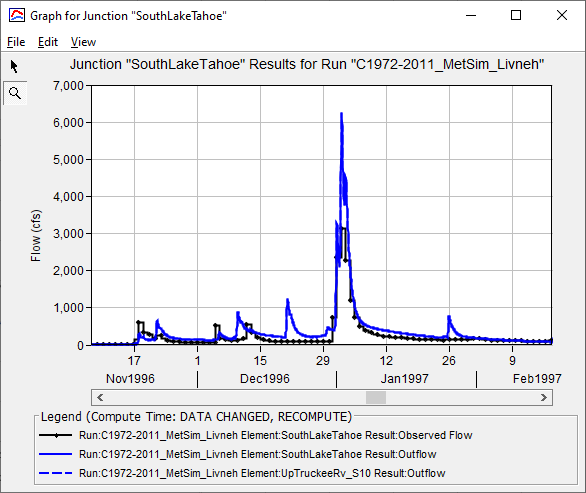
Question: How do the computed results compare against observed data at the USGS South Lake Tahoe gage for the January 1997 flood event (15Nov1996 - 9Feb1997)?
Qualitatively speaking, the computed discharge hydrograph matches the observed hydrograph fairly well, as shown in the following image. An instantaneous peak discharge of 5480 cfs was recorded at the South Lake Tahoe gage on January 2, 1997. The computed peak discharge is approximately 6250 cfs, which is approximately 14% larger than the observed peak. Using daily average/min/max boundary conditions to accurately assess extreme floods at relatively small spatial scales is difficult. In order to better simulate the runoff generated during this event, hourly boundary conditions should be used.
Assess Model Results for the WY1972 - WY2011 Time Period
In this instance, the computed results use an hourly time step while the observed data uses a daily average time step. In order to accurately assess model performance for the WY1972 - WY2011 time period, the computational and observed data time steps should be aligned to use the lowest common denominator (e.g., 1 day).
This can be done using the HEC Calibration App: https://github.com/HydrologicEngineeringCenter/calibration-app/releases.
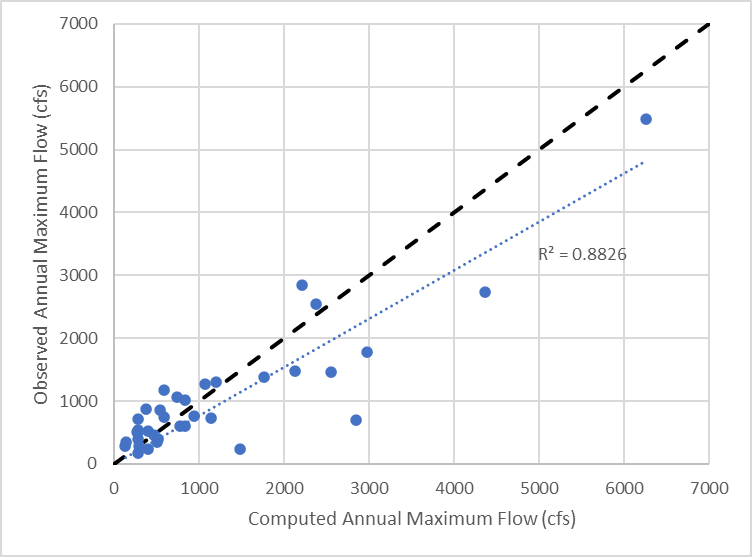
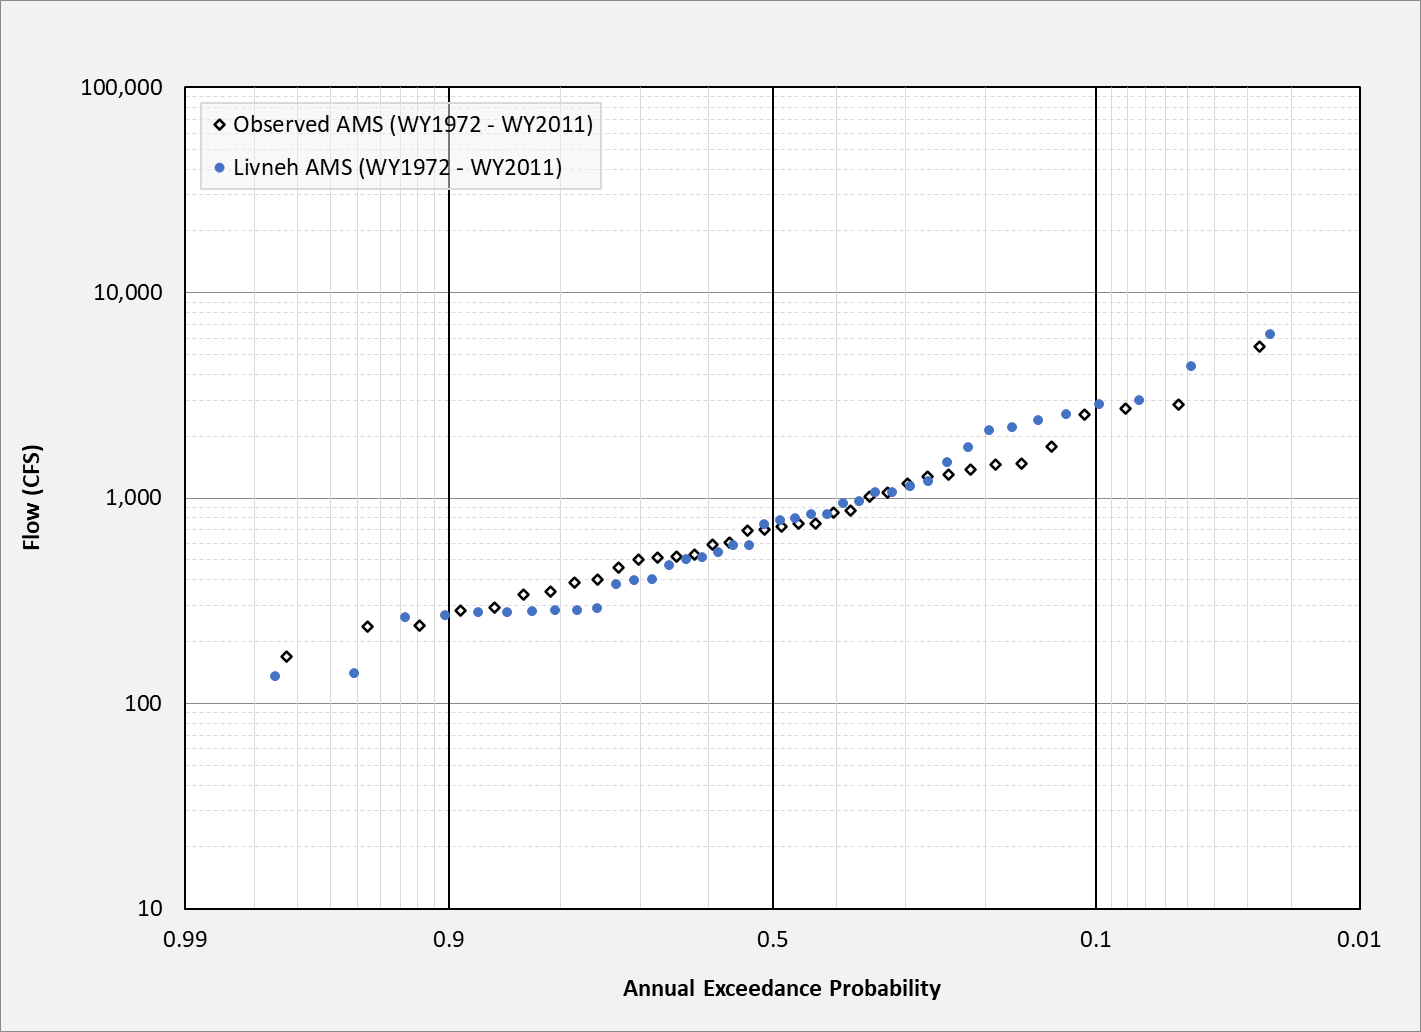
Model performance was evaluated by comparing computed results against observed results at numerous locations. Model parameters were altered to minimize the differences between computed and observed discharge at the South Lake Tahoe gage. Summary statistics were used to quantify model performance compared to observations (Moriasi, et al., 2007). Statistics that were used included Nash-Sutcliffe Efficiency (NSE), Ratio of the Root Mean Square Error to the Standard Deviation (RSR), Percent Bias (PBIAS), and Coefficient of Determination (R2). As shown in the following table, model performance was adequate for the WY1972-WY2011 time period.
WY1972 - WY2011 Summary Statistics
| Statistic | Value |
|---|---|
| NSE | 0.62 |
| RSR | 0.62 |
| PBIAS | 2.72 |
| R2 | 0.73 |
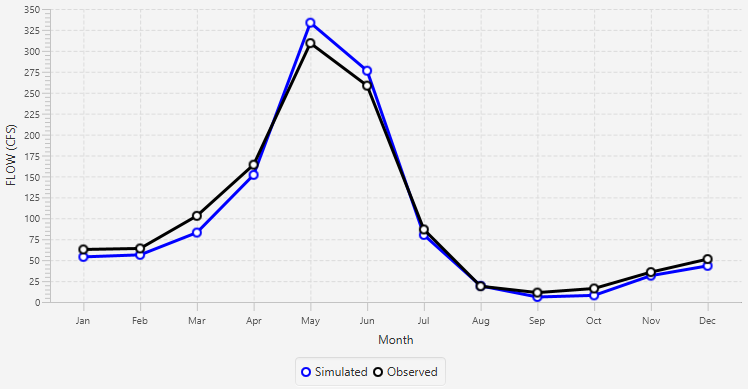
Computed and observed monthly average flow were also compared at the South Lake Tahoe gage and found to align very well.
Simulate Precipitation-Runoff Process for CY1915 - WY2011
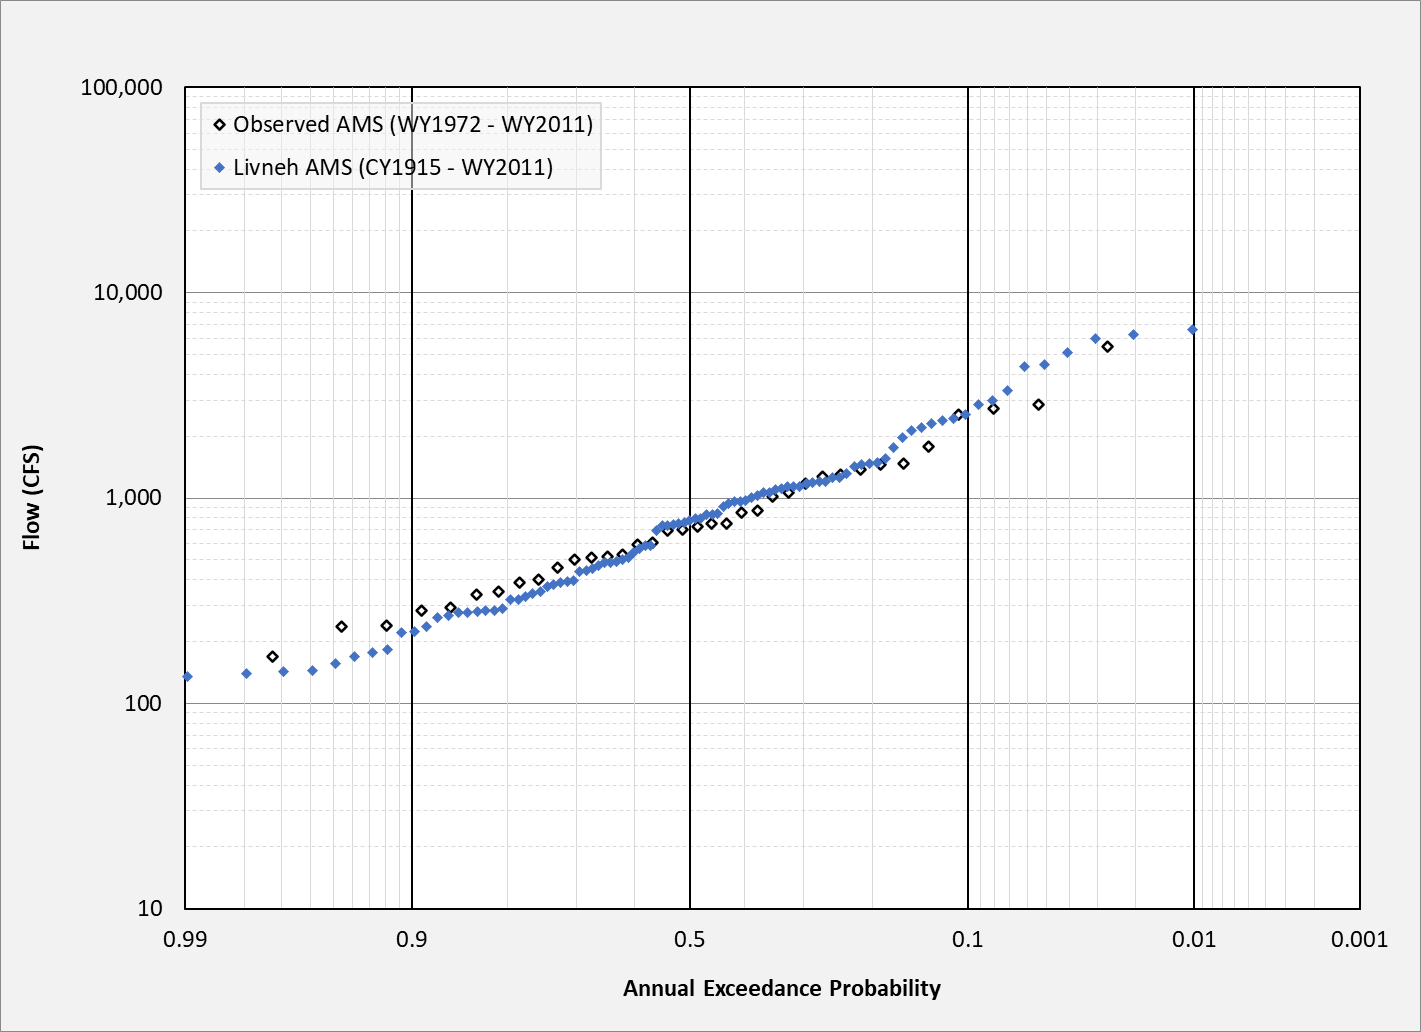
Now that the hydrologic model parameters have been calibrated, the entire POR available when using the Livneh gridded meteorological boundary conditions (1915 - 2011) can be simulated. This includes approximately 57 years' worth of information prior to the establishment of the USGS South Lake Tahoe gage.
- Create a new Simulation named C1915-2011_MetSim_Livneh.
- Select the MetSim_TI basin model, MetSim_Livneh meteorologic model, and Jan1915-WY2011 control specifications.
- Run the C1915-2011_MetSim_Livneh simulation by clicking the Compute All Elements button
 .
. - This compute will take approximately 9 minutes to finish.
- The results of this simulation are shown in the following figure:
Summary
In this tutorial, you gained experience using the new MetSim Precipitation and Temperature methods. You also accurately simulated nearly 100 years' worth of precipitation-runoff processes accurately using daily boundary condition data.
Project Files
