Download PDF
Download page Multi-Sequence Debris Prediction Method (MSDPM).
Multi-Sequence Debris Prediction Method (MSDPM)
The Multi-Sequence Debris Prediction Method (MSDPM), as outlined by Pak and Lee in 2008, emerged from an extensive analysis of debris clean-out data spanning from 1938 to 2002. This dataset was meticulously collected from 80 debris basins located across Southern California. MSDPM has proven effective for the continuous simulation of debris yield within relatively modest watersheds, covering areas ranging from 0.1 mi² to 3.0 mi².
The underpinnings of MSDPM are grounded in three fundamental physical processes. First, it considers the critical conditions necessary for sediment entrainment. Second, it factors in the transport capacity required to convey sediment toward the focal point of concentration, which typically corresponds to a debris basin. Finally, MSDPM integrates the antecedent precipitation state in conjunction with subsequent rainfall events as critical variables in its predictive model.
It is important to note that MSDPM performs most effectively in arid or semi-arid regions, particularly within the specific geographic context of Southern California, where it was initially developed and refined.
| \begin{aligned} & \sum_{i=1}^N\left(D_y\right)_i=0.25 \sum_{i=1}^N\left(1+\frac{\left|\left(I_m\right)_i-I_C\right|}{\left(\left(I_m\right)_i-I_C\right)}\right)\left(1+\frac{\left|(P)_i-P_c\right|}{\left((P)_i-P_C\right)}\right)\left(I_m\right)_i^{0.541} S^{0.134} A^{1.023} e^{0.290 F F} \\\\ & D_y=\text { Sediment Yield per Event }\left(\mathrm{m}^3\right) \\ & I_m=\text { Maximum 1-hour Rainfall Intensity per Event }(\mathrm{mm} / \mathrm{h}) \\ & I_c=\text { Threshold Maximum 1-hour Rainfall Intensity }(\mathrm{TMRI})(\mathrm{mm} / \mathrm{h}) \\ & P=\text { Total Rainfall Amount per Event }(\mathrm{mm}) \\ & P_c=\text { Total Minimum Rainfall Amount }(T M R A)(\mathrm{mm}) \\ & S=\text { Relief Ratio }(\mathrm{m} / \mathrm{km}) \\ & \quad \mathrm{S}=\frac{h_2-h_1}{L} \\ & \quad \quad h_2=\text { Highest Elevation in the Watershed }(\mathrm{m}) \\ & \quad \quad h_1=\text { Lowest Elevation in the Watershed }(\mathrm{m}) \\ & \quad \quad \text { L= Maximum Stream Length }(\mathrm{km}) \\ & A=\text { Drainage Area (ha) } \\ & F F=\text { Non-Dimensional Fire Factor } \\ & P \neq P_c \text { and } I_m \neq I_c \end{aligned} |
This Fire Factor (FF) equation has been meticulously designed to cater specifically to the continuous, long-term simulation, allowing for the dynamic incorporation of the recovery process following a fire event, in tandem with the influence of rainfall events over time. In the course of this research, a comprehensive fire factor (FF) was ingeniously formulated by taking into account several key parameters. These parameters include the extent of watershed burned, the temporal elapsed since the fire incident, and the count of antecedent precipitation events surpassing a predefined threshold value since the fire occurrence.
Furthermore, it's important to note that the Fire Factor (FF) equation is applicable in conjunction with LA Debris Equation 1 for continuous simulation. Nonetheless, an essential consideration arises when extending its usage to LA Debris Equations 2-5, particularly when dealing with areas exceeding 3.0 mi². This is due to the fact that the original equation was established using the Fire Factor Curve within the range of 0.1 mi² to 3.0 mi². Therefore, for reliable application beyond this range, the equation necessitates calibration with empirically measured data.
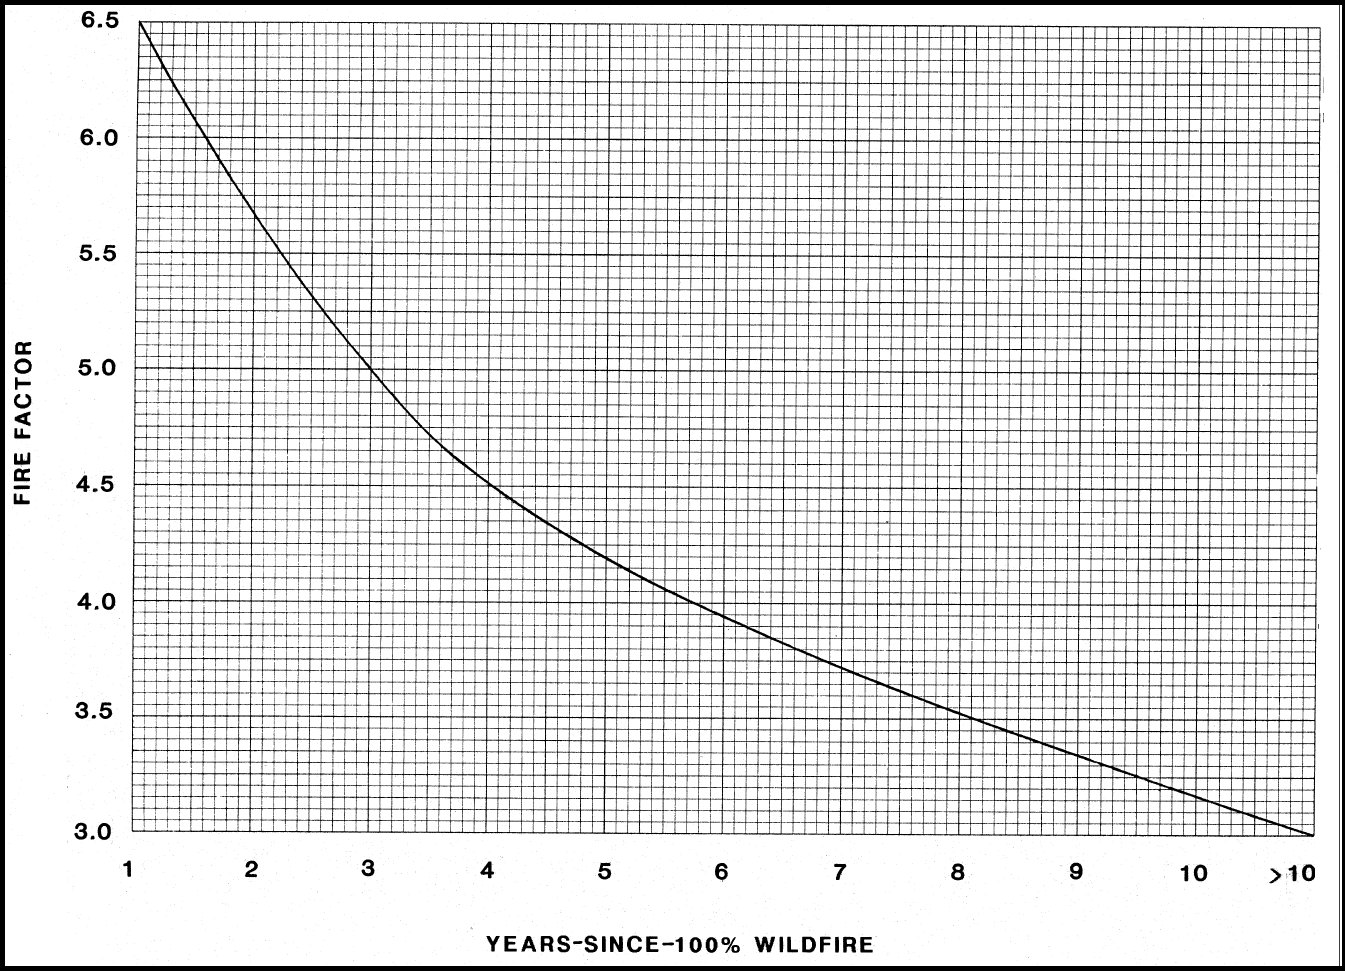
| \begin{aligned} & FF=\text { Fire Factor, } 3.0 \leq FF \leq 6.5(\text { dimensionless }) \\ & \begin{aligned} FF=6.5 \times\left(B_p \times\right. & \left.B_y^{-0.29}+\left(1-B_p\right) \times\left(20-B_y\right)^{-0.29}\right) \times\left(2-e^{\left(A_p / 200\right)}\right) \\ A_p= & \text { Number of antecedent ef fective precipitation events } \\ & \text { that have enough energy to generate sediment yield } \\ B_p= & \% \text { of, }\left(0 \leq B_p \leq 1\right) \\ B_y= & \text { Number of years since burn, }\left(1 \leq B_y \leq 10 y r\right) \end{aligned} \end{aligned} |
Additionally, should the need arise, the below Fire Factor Curve (watersheds ranging from 0.1 mi² to 3 mi²) can be effectively employed in conjunction with MSDPM for event-based simulations.
Required Parameters
Parameters that are required to utilize this method within HEC-HMS include the maximum 1-hour precipitation [inches or millimeters], Threshold Maximum 1-hour Rainfall Intensity (TMRI) [inched/hour or millimeters/hour], Total Rainfall Amount per Event [inches or millimeters], Total Minimum Rainfall Amount (TMRA) [inches or millimeters], relief ratio [ft/mi or m/km], and non-dimensional fire factor.
A tutorial using the Multi-Sequence Debris Prediction Method (MSDPM) in an event simulation can be found here: OLD_Applying Debris Yield Methods in HEC-HMS.
A Note on Parameter Estimation
HEC-HMS initially assigns a default value of 1.0 to the Adjustment-Transposition (A-T) factor. However, it's essential to fine-tune and verify this value by taking into account the disparities in geomorphological characteristics between the specific watershed under consideration and the original watershed (San Gabriel Mountains, CA) from which the regression equation was originally derived.
The Flow Rate Threshold parameter was introduced as an independent variable to segment storm events for continuous simulation. It establishes the lower boundary for direct runoff flow rate, marking the commencement of a debris flow event when the direct runoff exceeds this threshold. Conversely, the event concludes when the direct runoff drops below the specified threshold. This parameter assumes particular significance in the calibration process, especially for continuous simulations.
Threshold Maximum 1-hour Rainfall Intensity (TMRI): It's worth noting that not every instance of rainfall can trigger sediment entrainment, as a certain minimum energy level is required to mobilize sediment particles effectively. Consequently, rainfall events underwent a rigorous screening process to isolate those instances where the actual rainfall exceeded the critical threshold necessary for sediment entrainment.
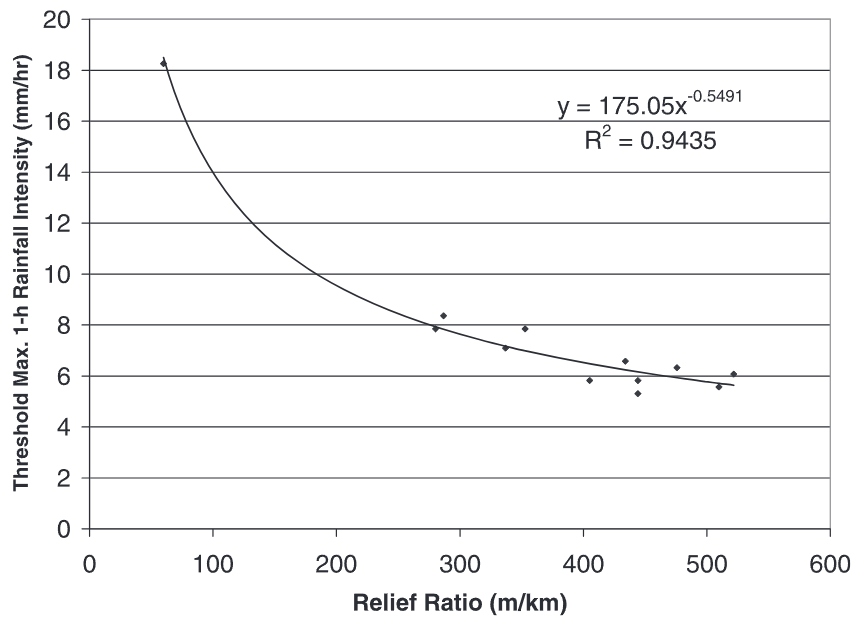
The determination of the TMRI, specifically for the initiation of sediment entrainment, was guided by an initial estimate rooted in the relationship between TMRI and relief ratio, as illustrated in the figure below. The initial TMRI value for each watershed can be obtained from the TMRI-relief ratio graph below. Fine-tuning and calibration occur during the calibration process using outlet flow gage data for increased accuracy and precision.
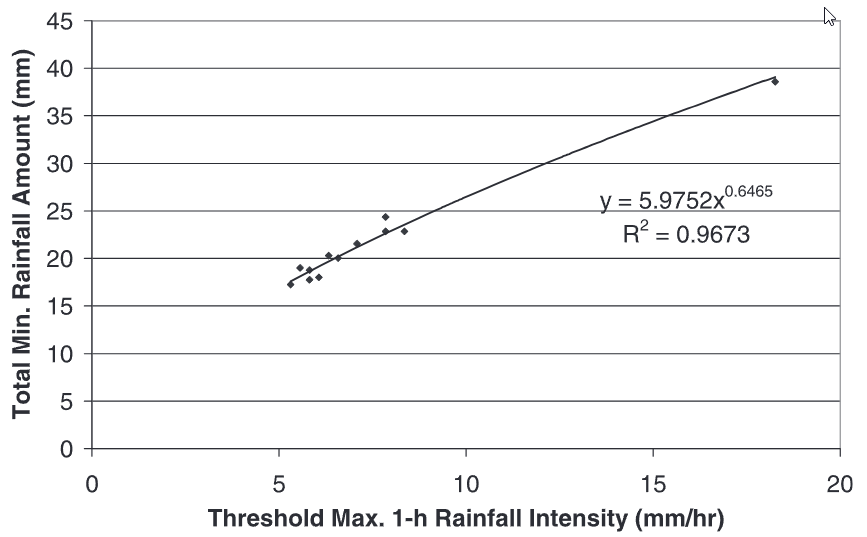
Total Minimum Rainfall Amount (TMRA): TMRA is directly linked to the sediment transport capacity required to channel sediment toward the concentration point. However, it's crucial to recognize that not all rainfall events possess the capacity to facilitate substantial sediment transport. Once sediment entrainment occurs, an additional level of energy is necessary to transport the sediment effectively to the concentration point. Consequently, another round of screening was conducted to identify rainfall events capable of providing this essential energy.
The critical total rainfall amount, represented as TMRA, was established individually for each watershed by analyzing the interplay between TMRA and TMRI, as visually depicted in the figure below. This pivotal threshold signifies the minimal rainfall accumulation required to facilitate substantial sediment transport within the watershed. The initial TMRA value for each watershed can be extracted directly from the TMRA and TMRI graph below. For further refinement and calibration, precision and accuracy are enhanced through the calibration process, which incorporates outlet flow gage data.