Download PDF
Download page Monthly Average Method.
Monthly Average Method
The monthly average method is designed to work with data collected using evaporation pans. Pans are a simple but effective technique for estimating evaporation. There is a long history of using them and data is widely available throughout the United States and other regions.
Basic Concepts and Equations
Evaporation pans are measurement instruments. A standard pan is 121 centimeters in diameter and 24 centimeters deep, though variations exist. It is set on a wooden platform close to the ground as shown in Figure 24. It is common to measure the windspeed adjacent to the evaporation pan, as well as the minimum and maximum water temperature each day. Water is added to the pan. Care must be taken to keep the water surface at least 5 centimeters below the top of the pan so that wind does not blow waves over the edge. Usually the pan will be refilled daily to keep the water level from falling more than 7.5 centimeters below the top. If the pan is allowed to empty too much, the temperature of the water may increase and cause overestimation of the evaporation rate.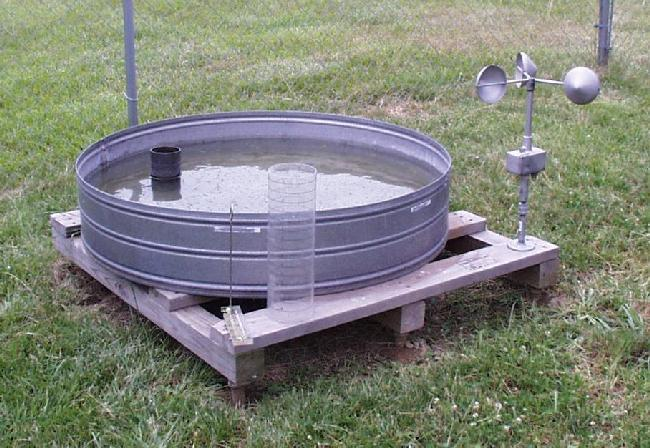
Figure 24.Example installation of a Class A evaporation pan.
Measurements are often performed in two separate ways. First, the pan may be marked with calibrated graduations. The graduations represent depth and measure the volume in the evaporation pan. The water surface is noted against the graduations to determine the water level each day. The difference on two sequential days is the amount of evaporation that occurred, measured as an equivalent depth. Second, the volume of water added to the pan each day can be measured; with the pan always being filled to the same level. Given the volume of water added and the area of the pan, the equivalent depth can be calculated. An average of the two depths may be taken as the estimate of the evaporation for each day.
Data collected with evaporation pans is usually reported in monthly averages. Averages must be determined for a long period of time in order to eliminate yearly variations. The United Nations World Meteorological Organization (ref needed) recommends a minimum record length of 30 years. It has been found that for long-term simulations greater than 15 years, using pan evaporation data compares favorably with more sophisticated models of evaporation (ref needed).
Estimating Parameters
There are many sources of data for pan evaporation rates. The source could be the monthly evaporation normals for a site where data is collected with an evaporation pan. More often the data are presented within the context of a regional analysis utilizing multiple measure sites, for example Roderick and Farquhar (2004). Within the United States the National Weather Service has estimated average evaporation as shown in Figure 25.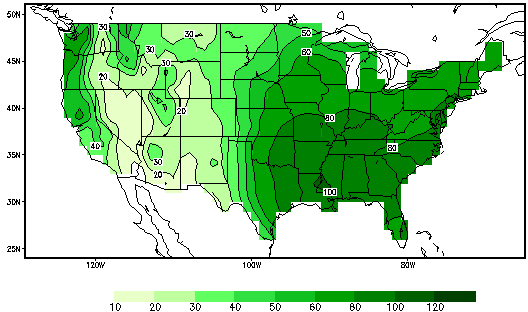
Figure 25.Calculated evaporation climatology in millimeters for the month of January using data from 1971 to 2000.
The measured pan evaporation rates overestimate evapotranspiration. The usual practice is to multiple the pan evaporation rate by a reduction ratio in order to approximate the evapotranspiration. The ratio typically ranges from 0.5 to 0.85 with the specific value depending on how the evaporation pan is sited and the atmospheric conditions. The ratio is larger when the relative humidity is higher. The ratio decreases as the windspeed increases. Typical values taken from the United Nations Food and Agriculture Organization (FAO, 1998) are shown in Table 14 and Table 15. The values are for a Class A evaporation pan and depend on the how the pan is located relative to vegetation, as shown in Figure 26.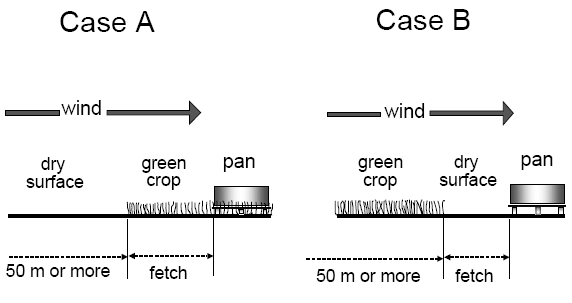
Figure 26.Two cases of evaporation pan siting and their environment.
Table 14.Pan coefficients for Class A pan sited on grass with a grass fetch but measuring transpiration over bare ground, and different levels of mean relative humidity (RH) and windspeed.
RH (%) --> | Low (< 40) | Medium (40-70) | High (> 70) | |
|---|---|---|---|---|
Windspeed | Fetch Length | |||
Light | 1 | 0.55 | 0.65 | 0.75 |
< 2 | 10 | 0.65 | 0.75 | 0.85 |
100 | 0.70 | 0.80 | 0.85 | |
1,000 | 0.75 | 0.85 | 0.85 | |
Moderate | 1 | 0.50 | 0.60 | 0.65 |
2-5 | 10 | .06 | 0.70 | 0.75 |
100 | 0.65 | 0.75 | 0.80 | |
1,000 | 0.70 | 0.80 | 0.80 | |
Strong | 1 | 0.45 | 0.50 | 0.60 |
5-8 | 10 | 0.55 | 0.60 | 0.65 |
100 | 0.60 | 0.65 | 0.70 | |
1,000 | 0.65 | 0.70 | 0.75 | |
Very strong | 1 | 0.40 | 0.45 | 0.50 |
> 8 | 10 | 0.45 | 0.55 | 0.60 |
100 | 0.50 | 0.60 | 0.65 | |
1,000 | 0.55 | 0.60 | 0.65 |
Table 15.Pan coefficients for Class A pan sited on bare ground with a bare ground fetch but measuring transpiration over grass, and different levels of mean relative humidity (RH) and windspeed.
RH (%) --> | Low (< 40) | Medium (40-70) | High (> 70) | |
|---|---|---|---|---|
Windspeed | Fetch Length | |||
Light | 1 | 0.70 | 0.80 | 0.85 |
< 2 | 10 | 0.60 | 0.70 | 0.80 |
100 | 0.55 | 0.65 | 0.75 | |
1,000 | 0.50 | 0.60 | 0.70 | |
Moderate | 1 | 0.65 | 0.75 | 0.80 |
2-5 | 10 | 0.55 | 0.65 | 0.70 |
100 | 0.50 | 0.60 | 0.65 | |
1,000 | 0.45 | 0.55 | 0.60 | |
Strong | 1 | 0.60 | 0.65 | 0.70 |
5-8 | 10 | 0.50 | 0.55 | 0.65 |
100 | 0.45 | 0.50 | 0.60 | |
1,000 | 0.40 | 0.45 | 0.55 | |
Very strong | 1 | 0.50 | 0.60 | 0.65 |
> 8 | 10 | 0.45 | 0.50 | 0.55 |
100 | 0.40 | 0.45 | 0.50 | |
1,000 | 0.35 | 0.40 | 0.45 |
The monthly average method is designed to work with data collected using evaporation pans. Pans are a simple but effective technique for estimating evaporation. There is a long history of using them and data is widely available throughout the United States and other regions.
Basic Concepts and Equations
Evaporation pans are measurement instruments. A standard pan is 121 centimeters in diameter and 24 centimeters deep, though variations exist. It is set on a wooden platform close to the ground as shown in Figure 24. It is common to measure the windspeed adjacent to the evaporation pan, as well as the minimum and maximum water temperature each day. Water is added to the pan. Care must be taken to keep the water surface at least 5 centimeters below the top of the pan so that wind does not blow waves over the edge. Usually the pan will be refilled daily to keep the water level from falling more than 7.5 centimeters below the top. If the pan is allowed to empty too much, the temperature of the water may increase and cause overestimation of the evaporation rate.
Figure 24.Example installation of a Class A evaporation pan.
Measurements are often performed in two separate ways. First, the pan may be marked with calibrated graduations. The graduations represent depth and measure the volume in the evaporation pan. The water surface is noted against the graduations to determine the water level each day. The difference on two sequential days is the amount of evaporation that occurred, measured as an equivalent depth. Second, the volume of water added to the pan each day can be measured; with the pan always being filled to the same level. Given the volume of water added and the area of the pan, the equivalent depth can be calculated. An average of the two depths may be taken as the estimate of the evaporation for each day.
Data collected with evaporation pans is usually reported in monthly averages. Averages must be determined for a long period of time in order to eliminate yearly variations. The United Nations World Meteorological Organization (ref needed) recommends a minimum record length of 30 years. It has been found that for long-term simulations greater than 15 years, using pan evaporation data compares favorably with more sophisticated models of evaporation (ref needed).
Estimating Parameters
There are many sources of data for pan evaporation rates. The source could be the monthly evaporation normals for a site where data is collected with an evaporation pan. More often the data are presented within the context of a regional analysis utilizing multiple measure sites, for example Roderick and Farquhar (2004). Within the United States the National Weather Service has estimated average evaporation as shown in Figure 25.
Figure 25.Calculated evaporation climatology in millimeters for the month of January using data from 1971 to 2000.
Daily and monthly average pan evaporation rates for CONUS can be visualized here: https://www.cpc.ncep.noaa.gov/products/Soilmst_Monitoring/US/Evap/Evap_clim.shtml
The measured pan evaporation rates overestimate evapotranspiration. The usual practice is to multiple the pan evaporation rate by a reduction ratio in order to approximate the evapotranspiration. The ratio typically ranges from 0.5 to 0.85 with the specific value depending on how the evaporation pan is sited and the atmospheric conditions. The ratio is larger when the relative humidity is higher. The ratio decreases as the windspeed increases. Typical values taken from the United Nations Food and Agriculture Organization (FAO, 1998) are shown in Table 14 and Table 15. The values are for a Class A evaporation pan and depend on the how the pan is located relative to vegetation, as shown in Figure 26.
Figure 26.Two cases of evaporation pan siting and their environment.
Table 14.Pan coefficients for Class A pan sited on grass with a grass fetch but measuring transpiration over bare ground, and different levels of mean relative humidity (RH) and windspeed.
RH (%) --> | Low (< 40) | Medium (40-70) | High (> 70) | |
|---|---|---|---|---|
Windspeed | Fetch Length | |||
Light | 1 | 0.55 | 0.65 | 0.75 |
< 2 | 10 | 0.65 | 0.75 | 0.85 |
100 | 0.70 | 0.80 | 0.85 | |
1,000 | 0.75 | 0.85 | 0.85 | |
Moderate | 1 | 0.50 | 0.60 | 0.65 |
2-5 | 10 | .06 | 0.70 | 0.75 |
100 | 0.65 | 0.75 | 0.80 | |
1,000 | 0.70 | 0.80 | 0.80 | |
Strong | 1 | 0.45 | 0.50 | 0.60 |
5-8 | 10 | 0.55 | 0.60 | 0.65 |
100 | 0.60 | 0.65 | 0.70 | |
1,000 | 0.65 | 0.70 | 0.75 | |
Very strong | 1 | 0.40 | 0.45 | 0.50 |
> 8 | 10 | 0.45 | 0.55 | 0.60 |
100 | 0.50 | 0.60 | 0.65 | |
1,000 | 0.55 | 0.60 | 0.65 |
Table 15.Pan coefficients for Class A pan sited on bare ground with a bare ground fetch but measuring transpiration over grass, and different levels of mean relative humidity (RH) and windspeed.
RH (%) --> | Low (< 40) | Medium (40-70) | High (> 70) | |
|---|---|---|---|---|
Windspeed | Fetch Length | |||
Light | 1 | 0.70 | 0.80 | 0.85 |
< 2 | 10 | 0.60 | 0.70 | 0.80 |
100 | 0.55 | 0.65 | 0.75 | |
1,000 | 0.50 | 0.60 | 0.70 | |
Moderate | 1 | 0.65 | 0.75 | 0.80 |
2-5 | 10 | 0.55 | 0.65 | 0.70 |
100 | 0.50 | 0.60 | 0.65 | |
1,000 | 0.45 | 0.55 | 0.60 | |
Strong | 1 | 0.60 | 0.65 | 0.70 |
5-8 | 10 | 0.50 | 0.55 | 0.65 |
100 | 0.45 | 0.50 | 0.60 | |
1,000 | 0.40 | 0.45 | 0.55 | |
Very strong | 1 | 0.50 | 0.60 | 0.65 |
> 8 | 10 | 0.45 | 0.50 | 0.55 |
100 | 0.40 | 0.45 | 0.50 | |
1,000 | 0.35 | 0.40 | 0.45 |